Editors' Pick Charts of Note 2018
This chart gallery is a collection of the best Charts of Note from 2018. These charts were selected by ERS editors as those worthy of a second read because they provide context for the year’s headlines or share key insights from ERS research.

Monday, April 16, 2018
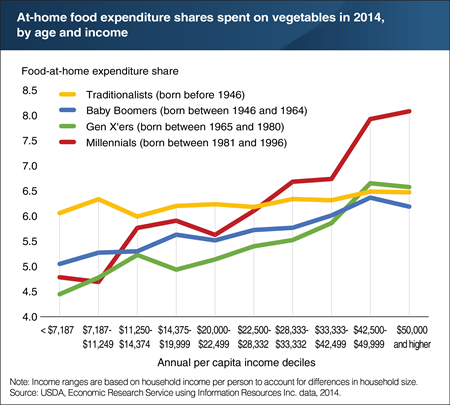
ERS researchers used household-level data from Information Resources Inc. to investigate how food spending patterns differ by household income and age of the household food shopper. The researchers found that as per person income rises, households spend a larger portion of their at-home food expenditures on vegetables. This was true for all four generations examined, though the increase for Traditionalists was small. Poorer Millennials assigned lower shares of at-home food spending to vegetables than Traditionalists and Baby Boomers with similar incomes. Millennials with higher incomes apportioned more of their food budgets to vegetables, surpassing Traditionalists when per capita household income was around $30,000. The wealthiest Millennial households (per capita income greater than $50,000) dedicated about 8 percent of their food budgets to vegetables, compared to around 6 percent for the other generation groups in the same income decile. The rise in vegetable purchases among wealthier Millennials may reflect Millennials’ preference for healthy foods. A version of this chart appears in the ERS report, Food Purchase Decisions of Millennial Households Compared to Other Generations, released December 2017.

