

Data Visualizations
Click on any of the images below to explore an interactive data visualization:
-
4/12/2024
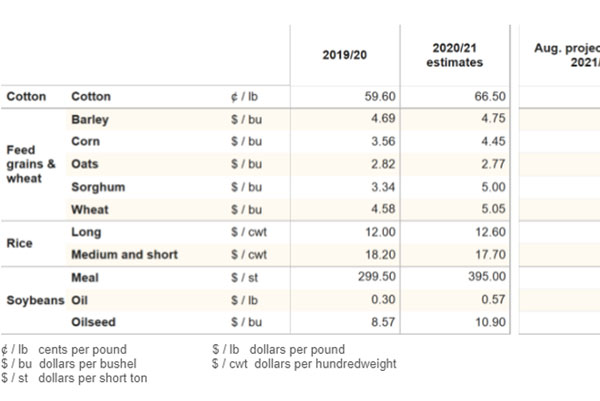
World Agricultural Supply and Demand Estimates at a Glance -
4/12/2024
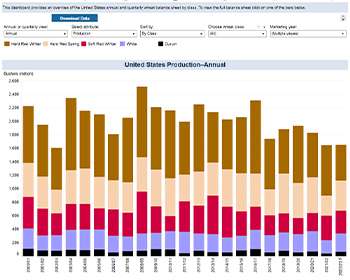
Wheat Data Visualization -
2/28/2024
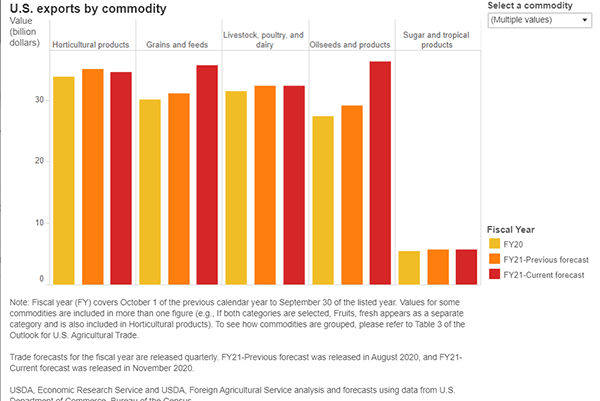
U.S. agricultural exports and imports (by commodity) -
2/28/2024
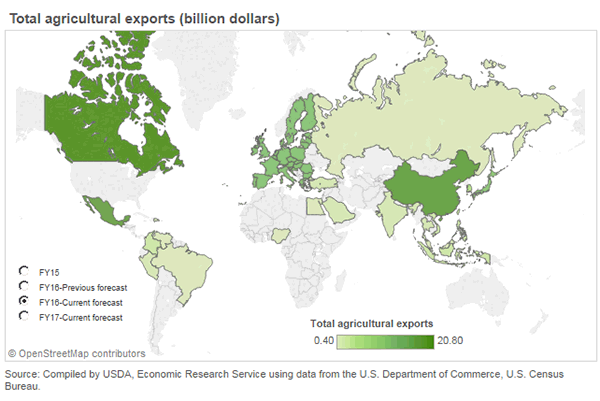
Total U.S. agricultural exports and imports -
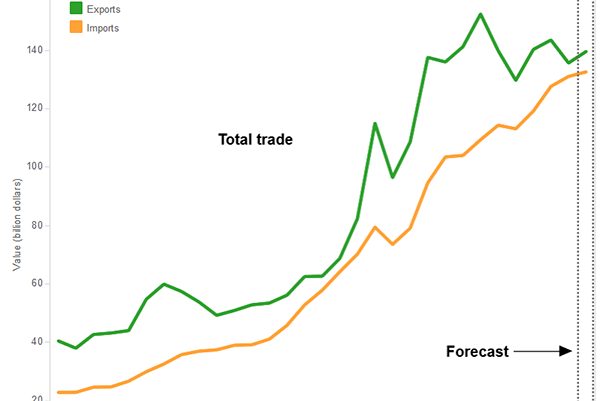
2/28/2024
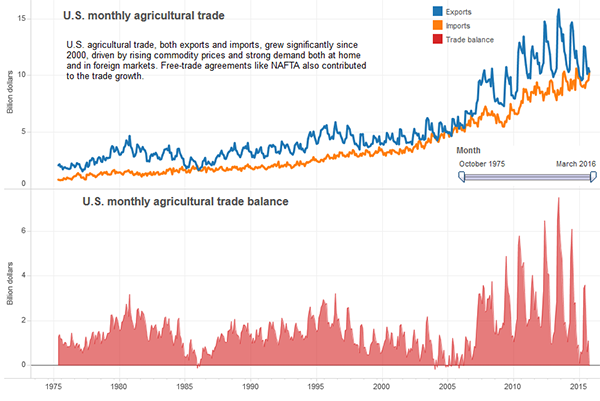
U.S. agricultural trade -
2/22/2024
International Baseline Projections -
2/14/2024
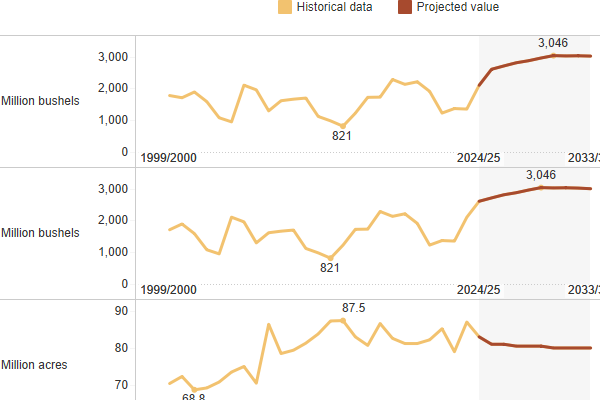
U.S. Agricultural Baseline Projections -
2/13/2024
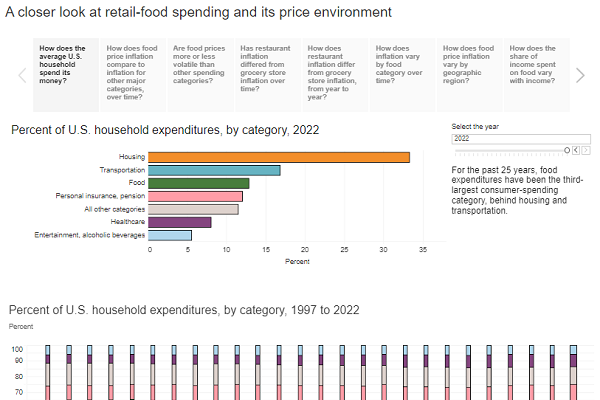
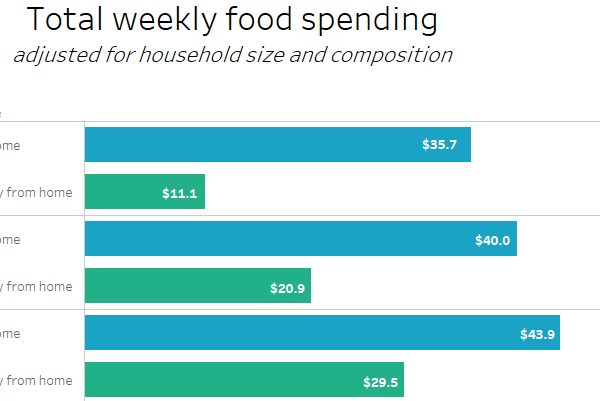
A Closer Look at Retail Food Spending and Price Environment -
2/7/2024
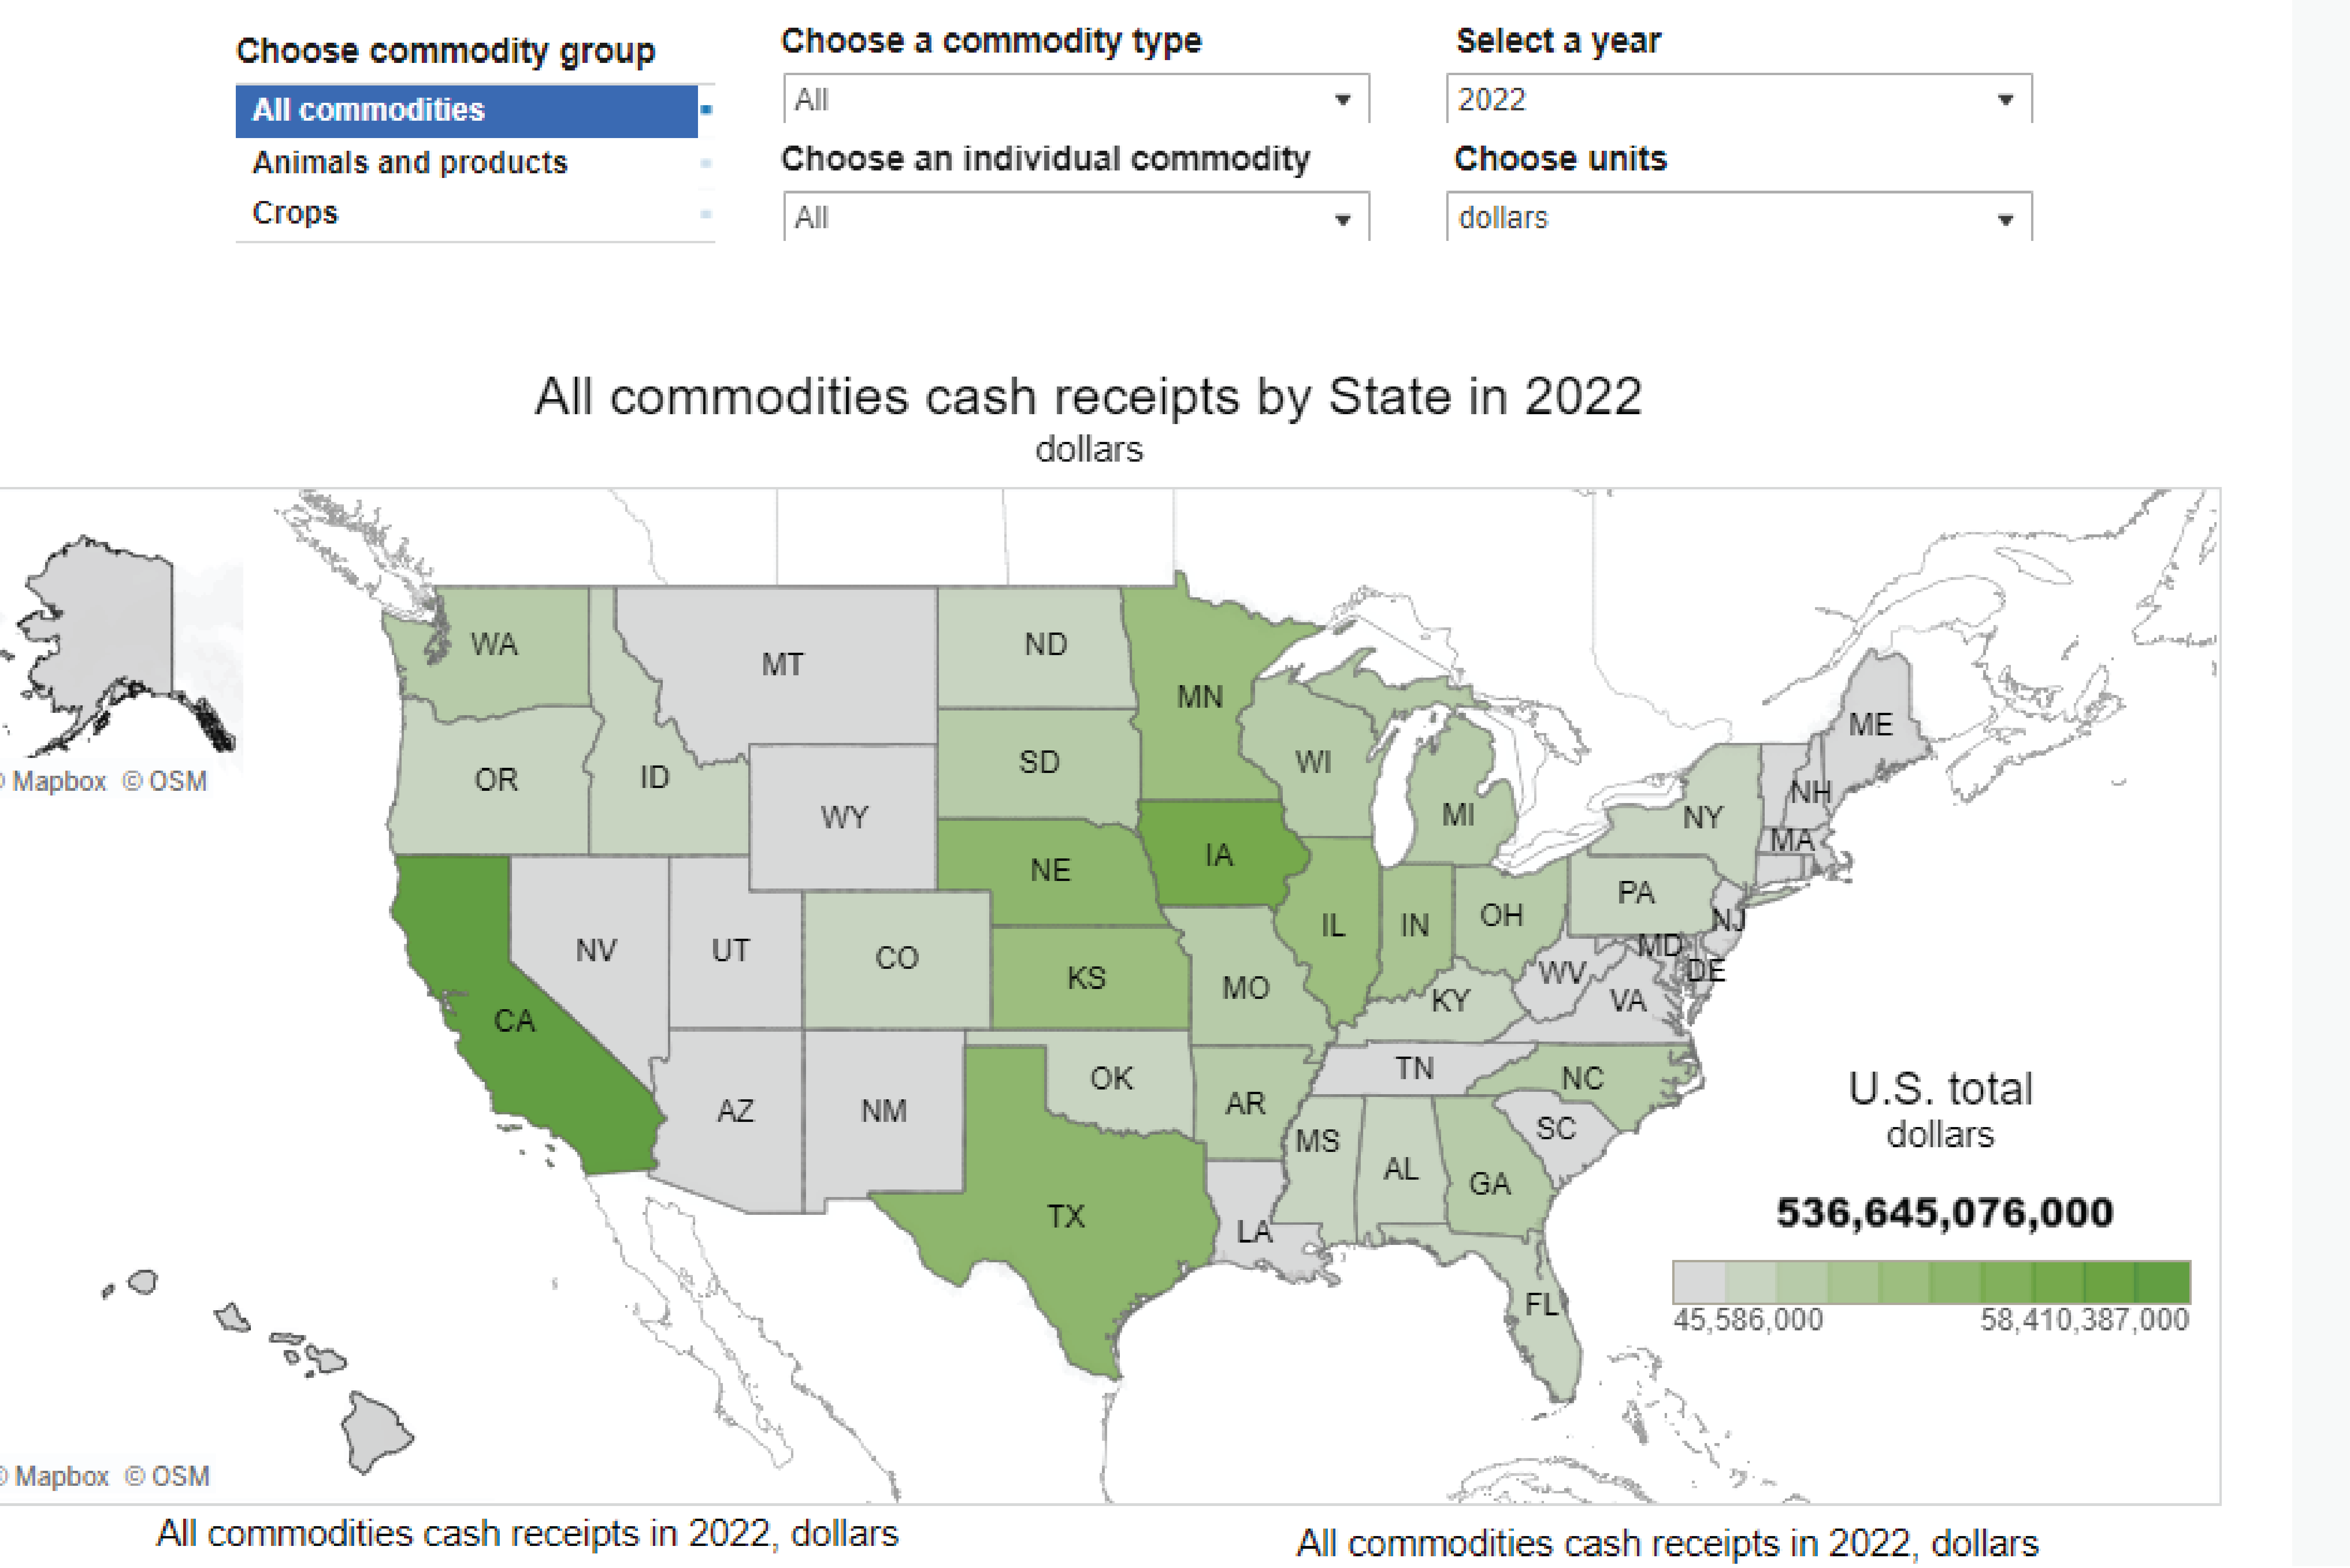
Charts and Maps of U.S. Farm Income Statement Data -
2/7/2024
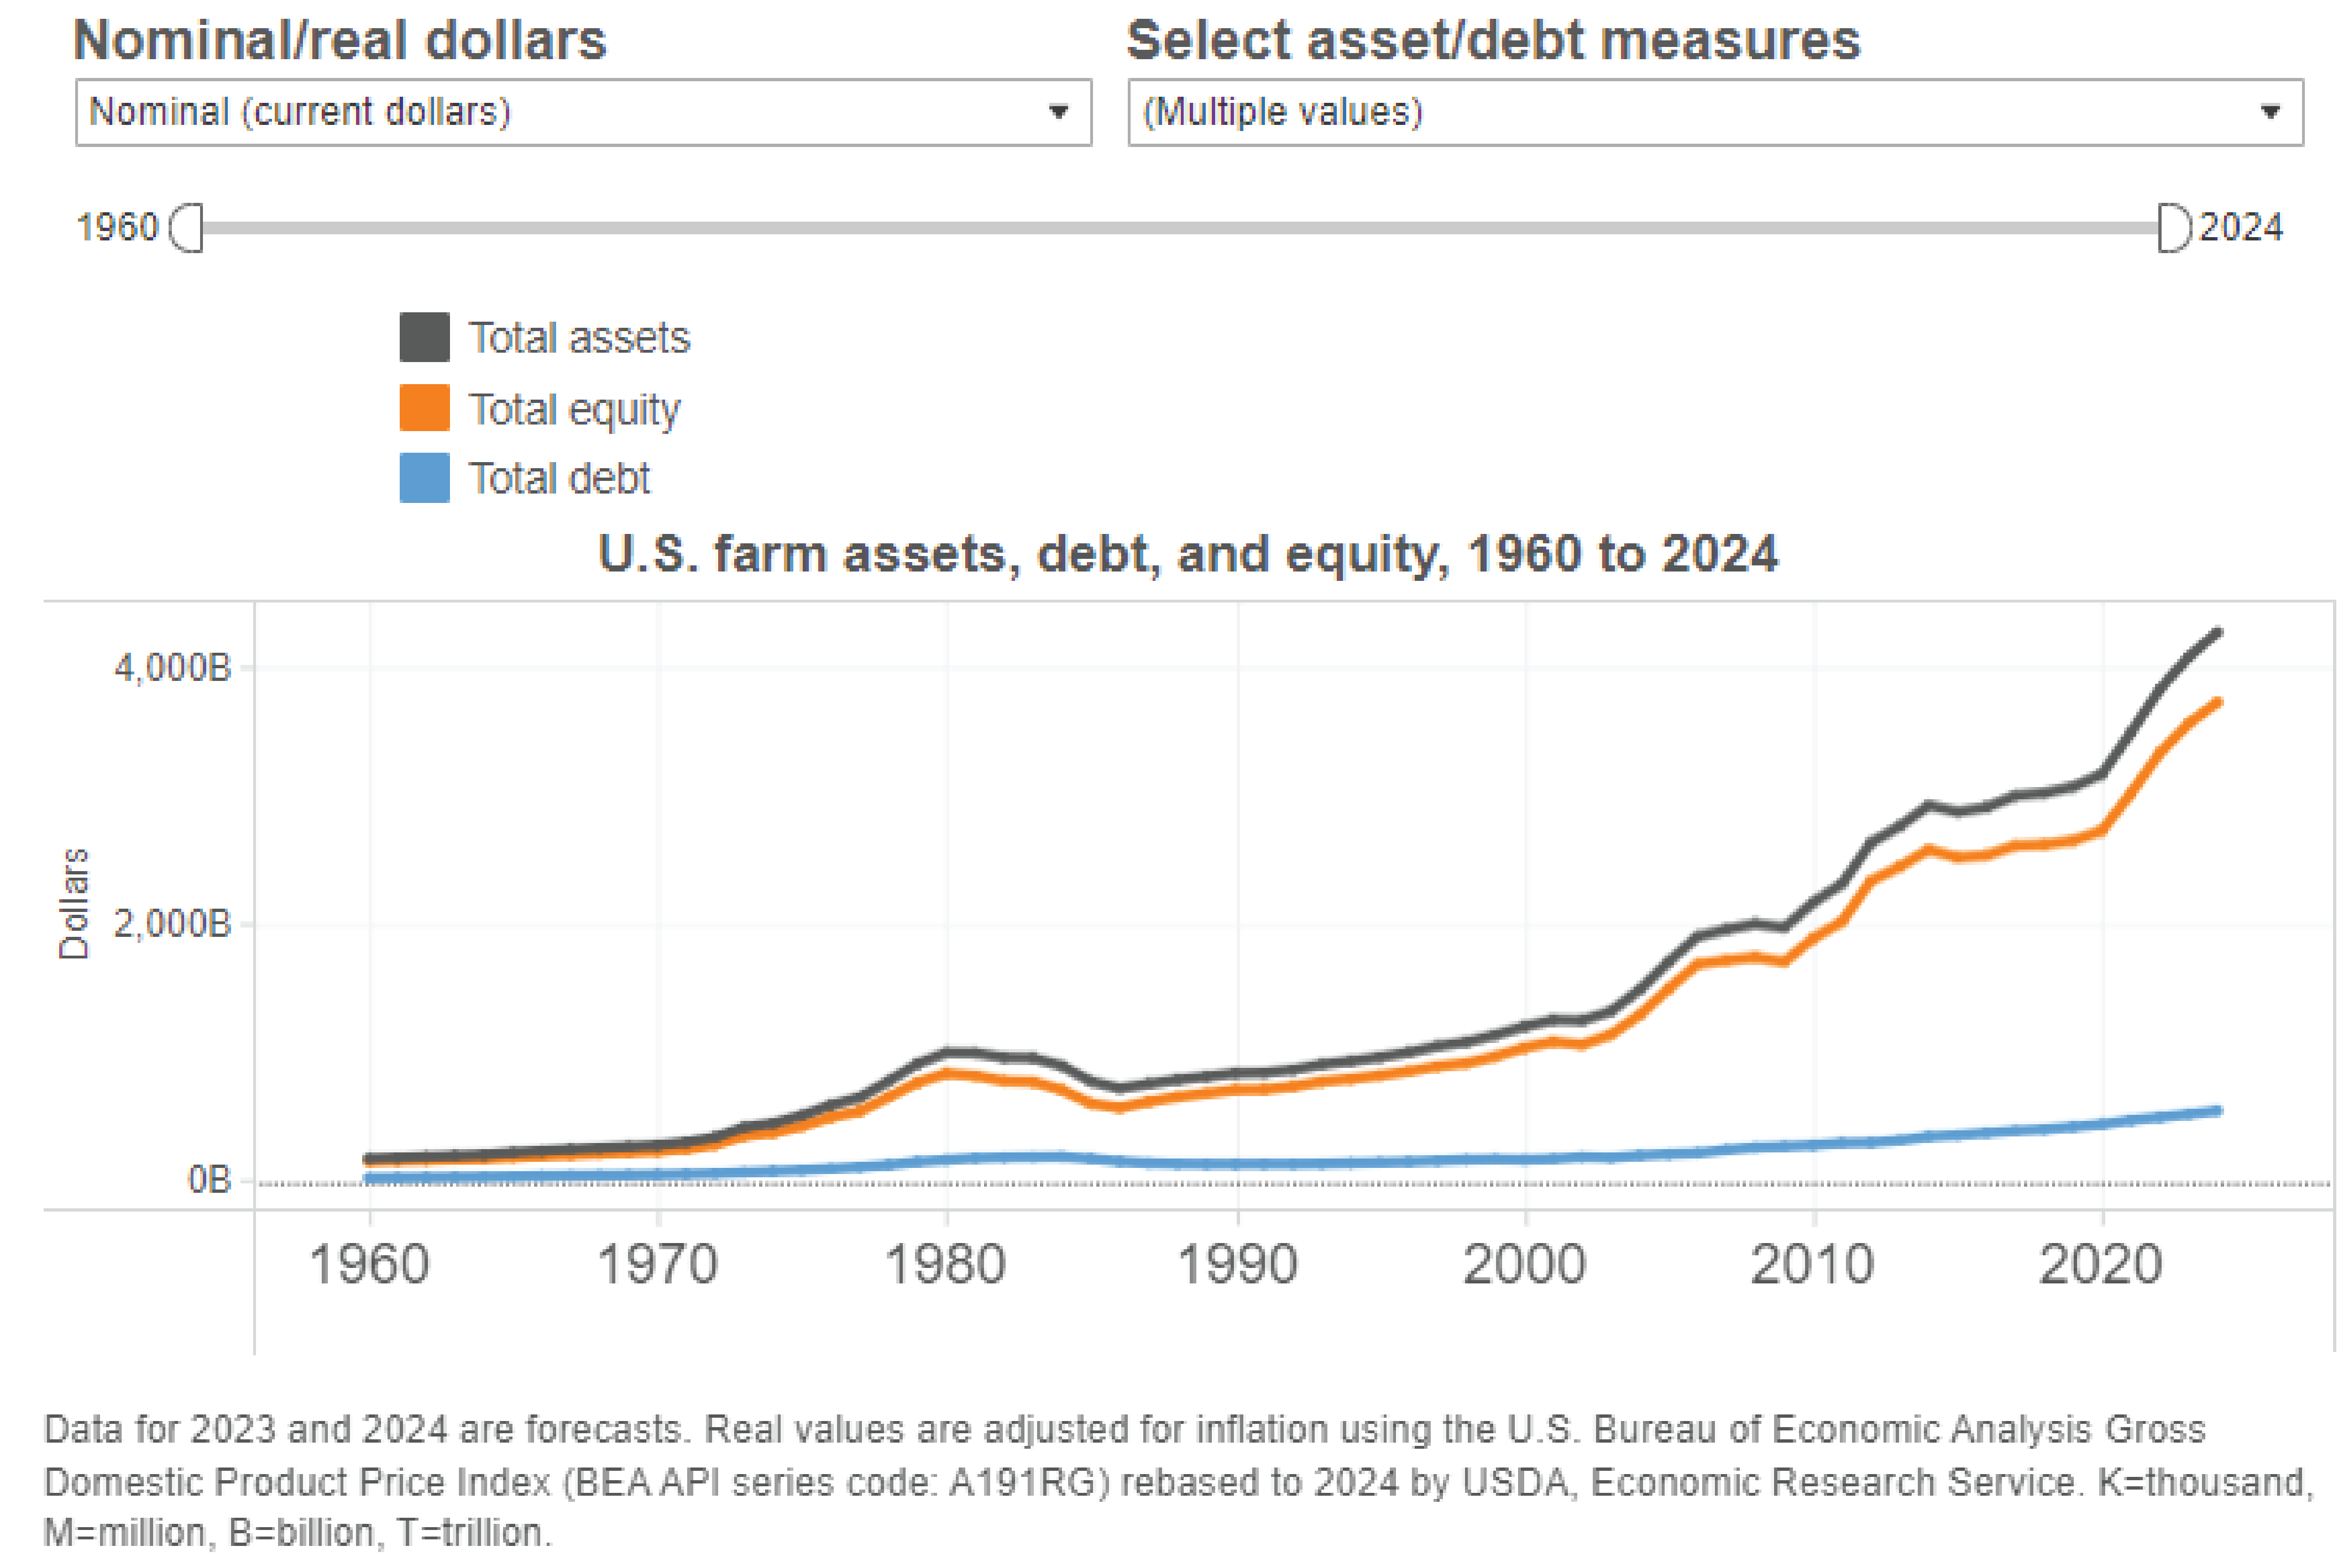
Charts and Maps of U.S. Farm Balance Sheet Data -
2/7/2024
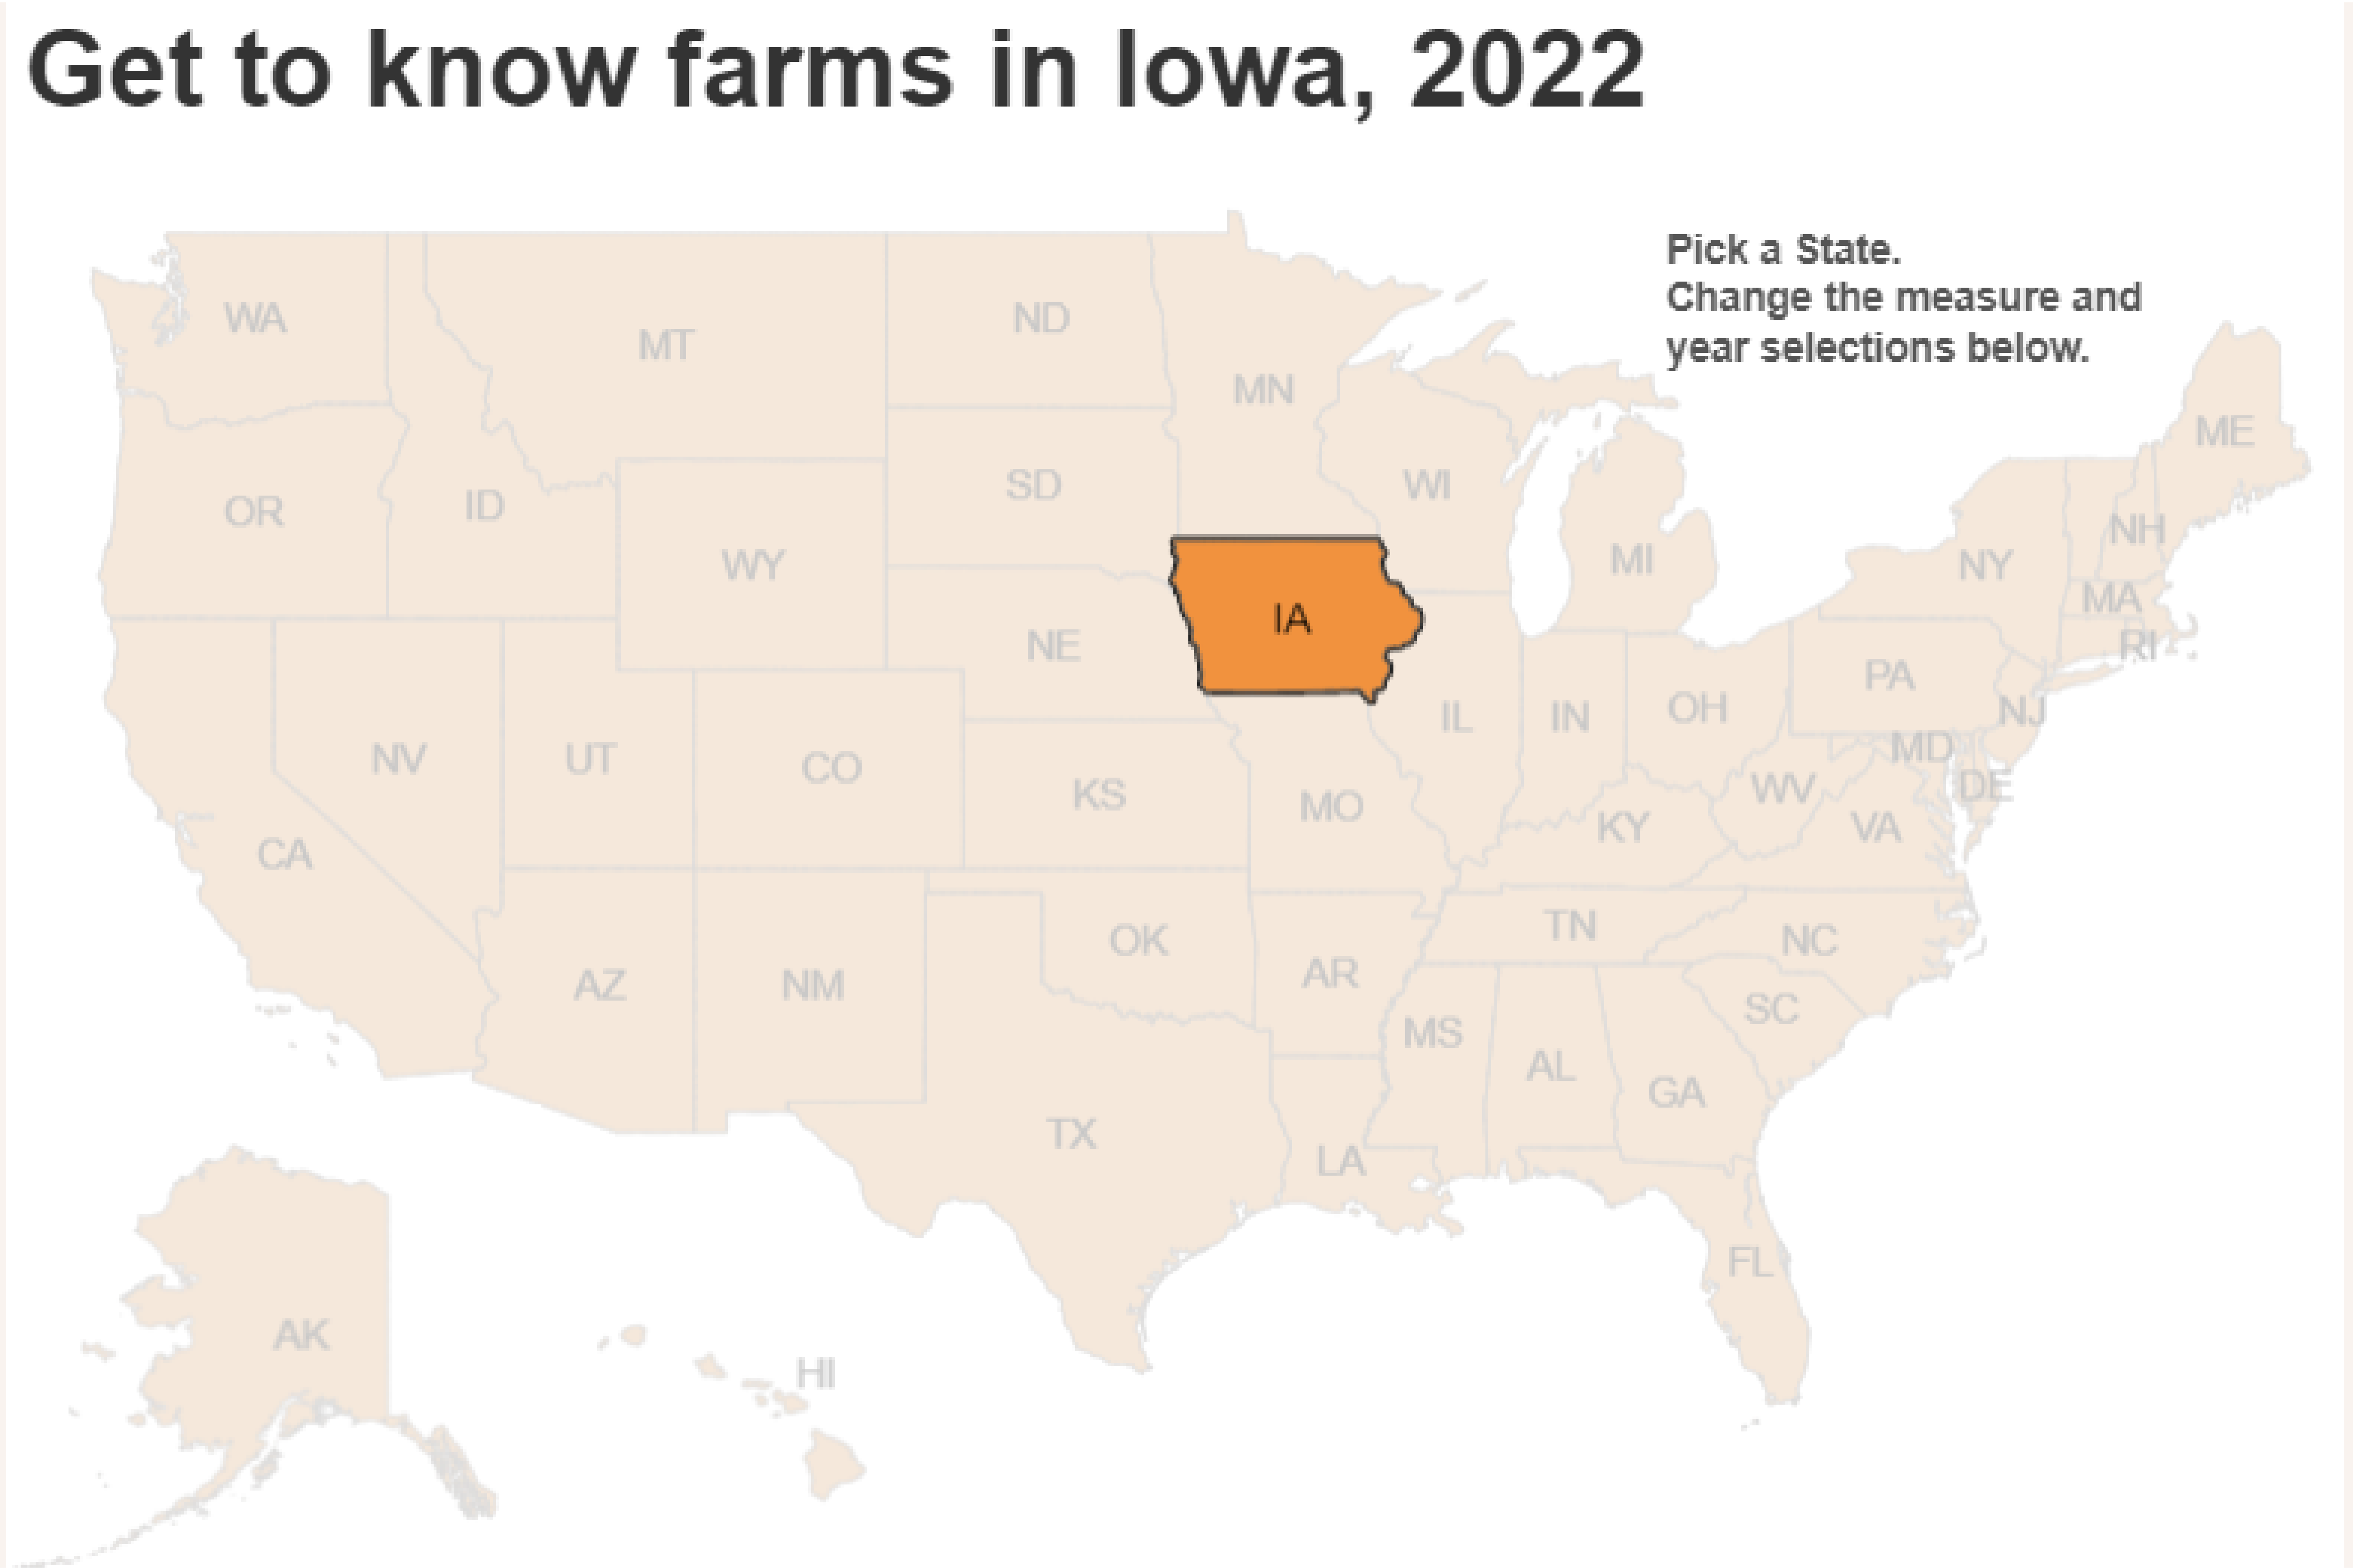
Charts and Maps About Your State -
1/31/2024
Average share of exports in U.S. agricultural production -
1/31/2024
Average share of imports in U.S. consumption -
10/31/2023
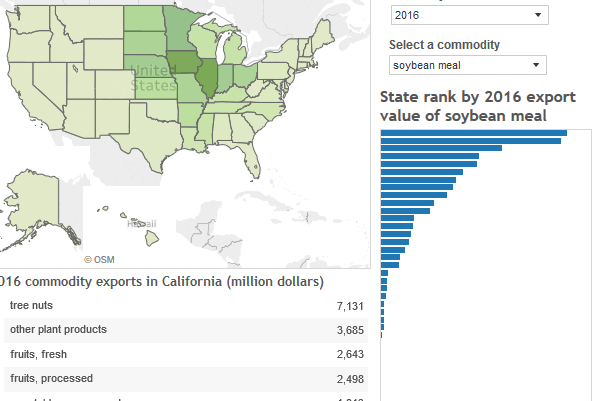
Annual Value of State Exports -
10/25/2023
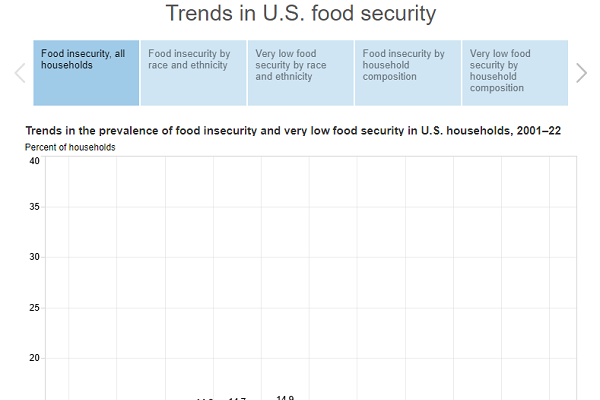
Trends in U.S. food security -
10/25/2023
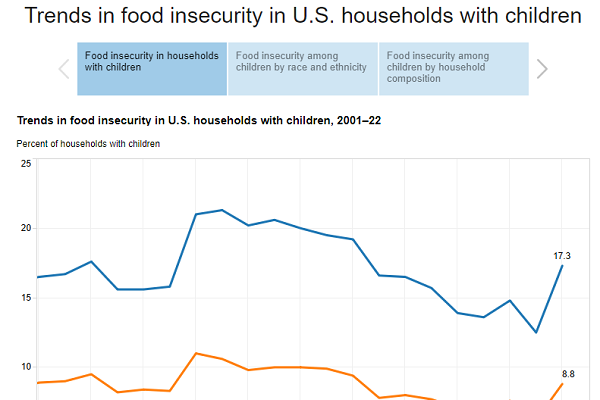
Trends in food insecurity in U.S. households with children -
10/25/2023
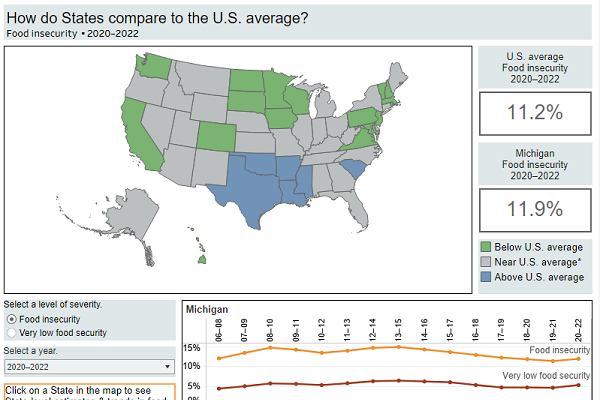
Food Security in the United States: How Do States Compare? -
10/25/2023
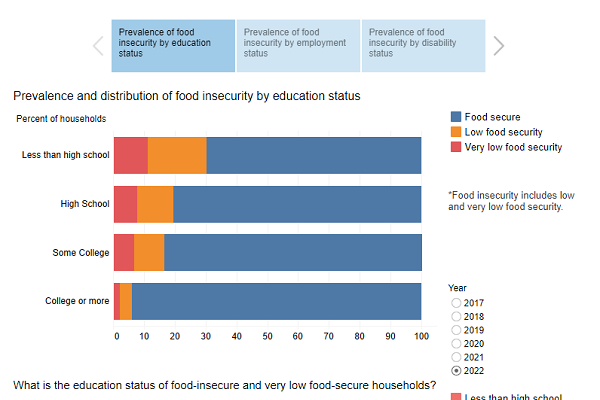
Prevalence and distribution of food insecurity by education status -
10/3/2023
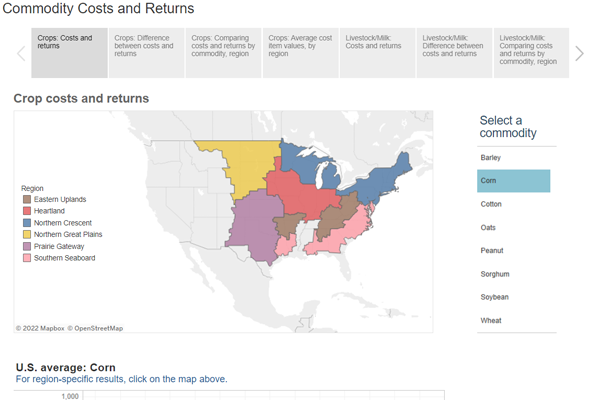
Commodity Costs and Returns: Crops -
10/3/2023
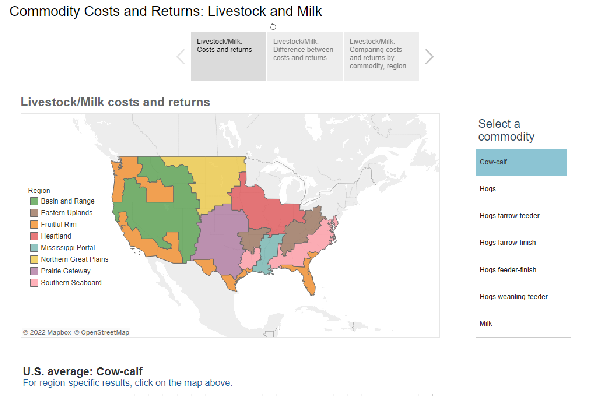
Commodity Costs and Returns: Livestock and Milk -
9/29/2023
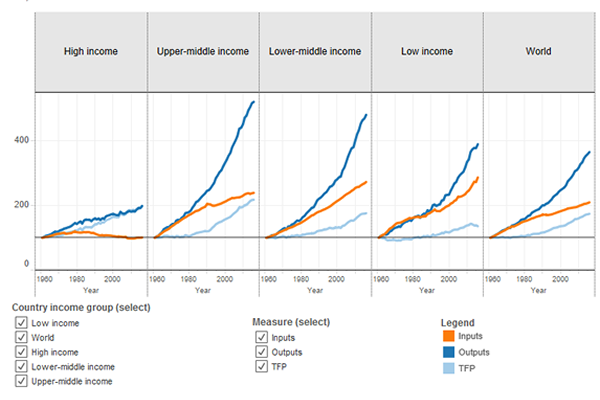
Trends in agricultural outputs, inputs, and total factor productivity (TFP) by country income group, 1961–2021 -
9/27/2023
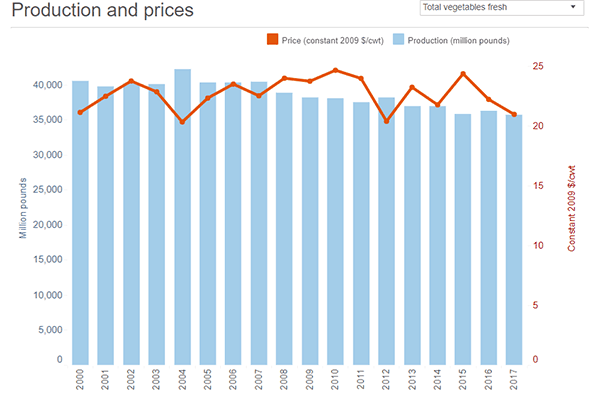
Vegetables and Pulses: commodity highlights -
9/27/2023
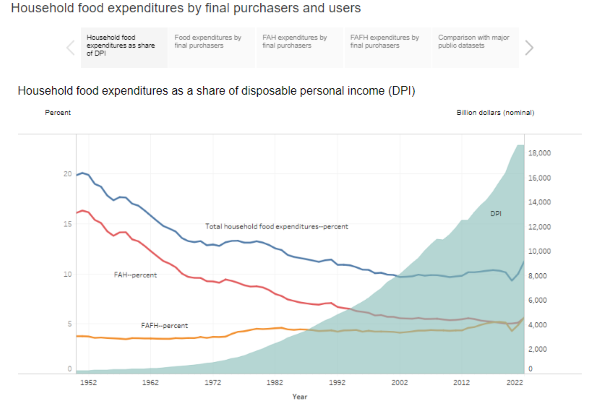
Household food expenditures by final purchasers and users -
9/27/2023
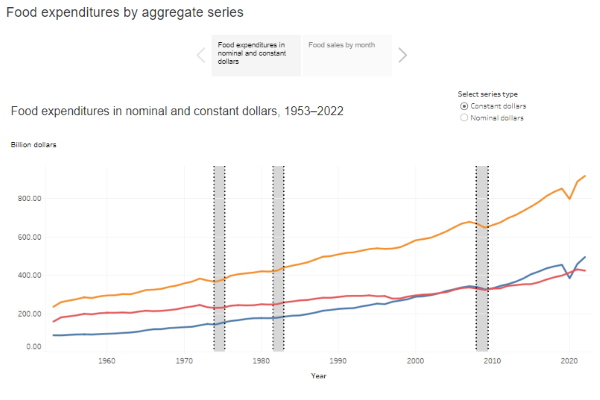
Food expenditures by aggregate series -
9/27/2023
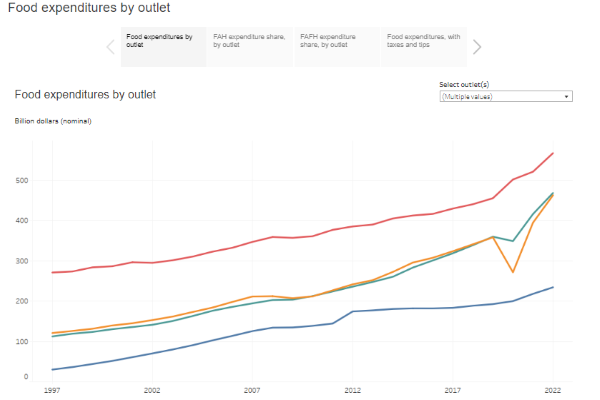
Food expenditures by outlet -
7/20/2023
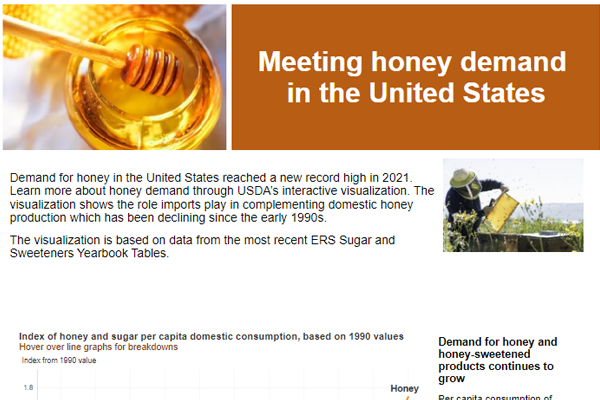
Meeting honey demand in the United States -
6/1/2023
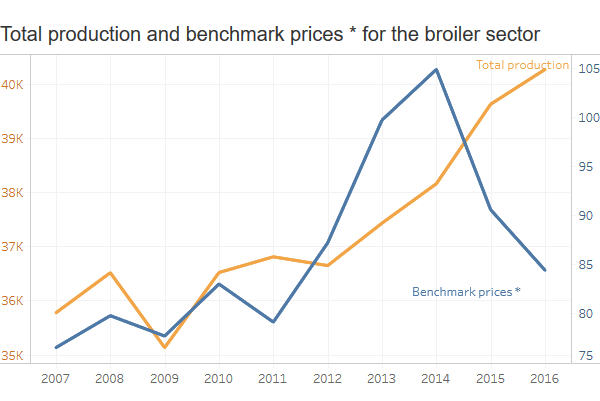
Statistical summary of the broiler sector, 2013—22 -
6/1/2023
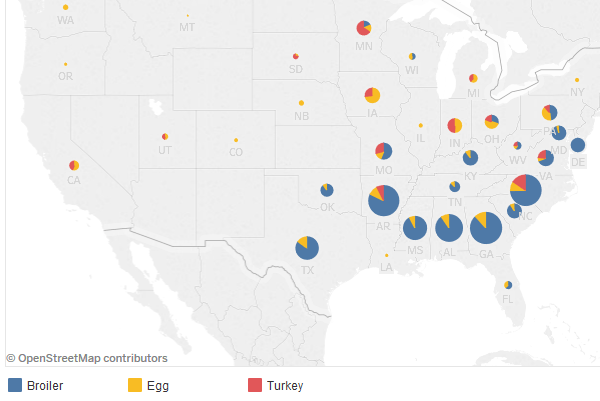
U.S. State-level poultry sales for major commodities, 2022* -
6/1/2023
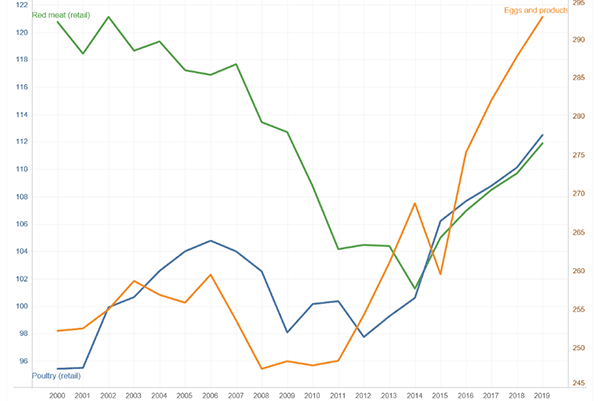
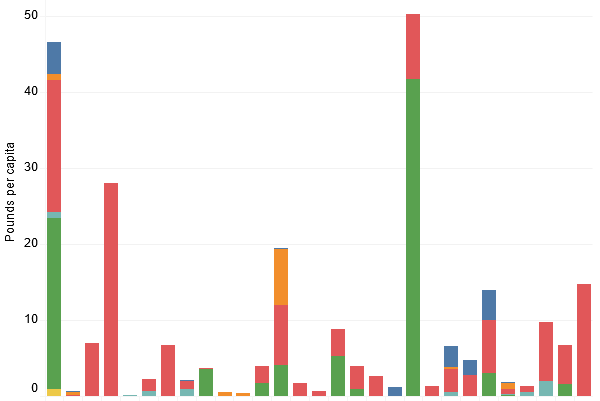
Estimated U.S. poultry and red meat disappearance per capita by year, 2000 to 2022 -
3/29/2023
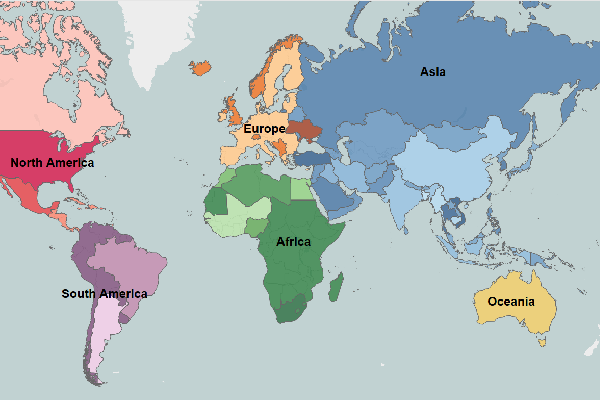
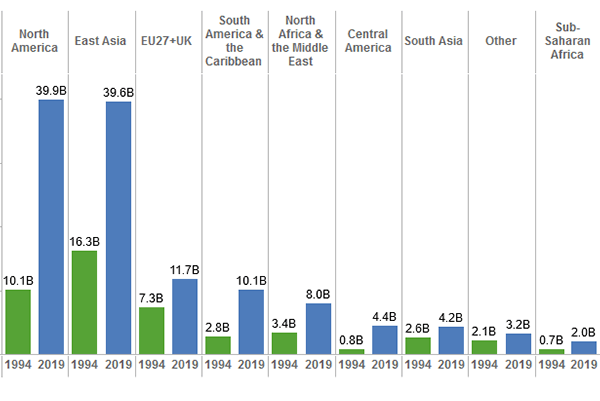
U.S. export values per region -
3/29/2023
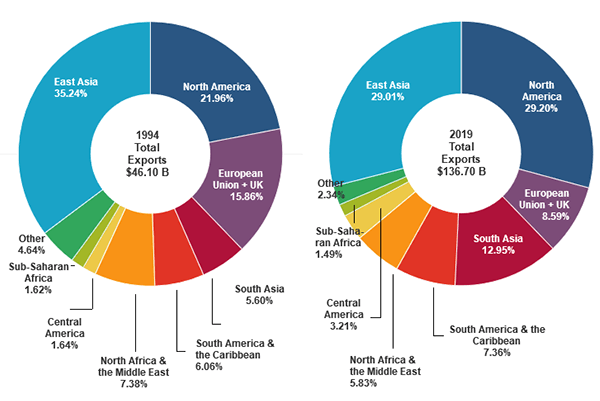
Shares of different regions in U.S. agricultural exports -
3/29/2023
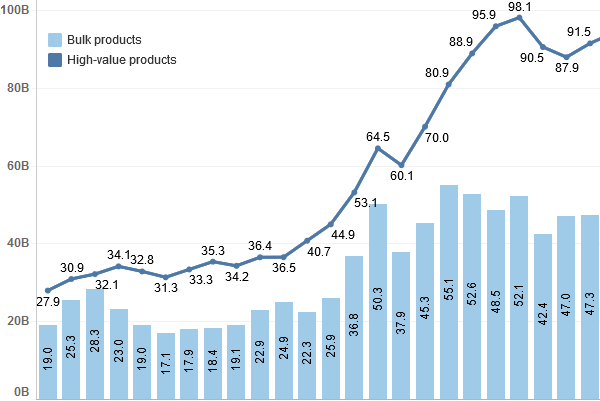
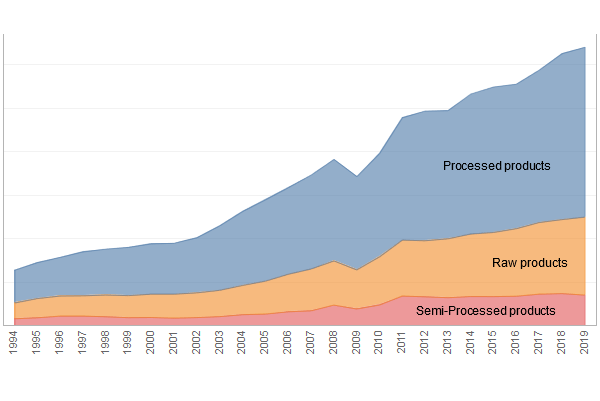
Exports of bulk and high-value commodities -
3/29/2023
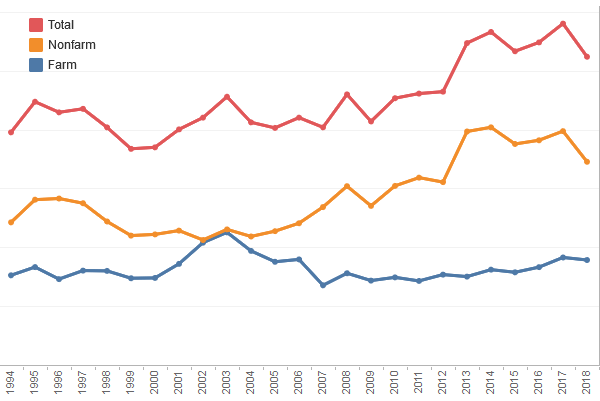
U.S. agricultural exports supported jobs outside farming -
3/29/2023
Imports of bulk and high-value commodities -
11/10/2022
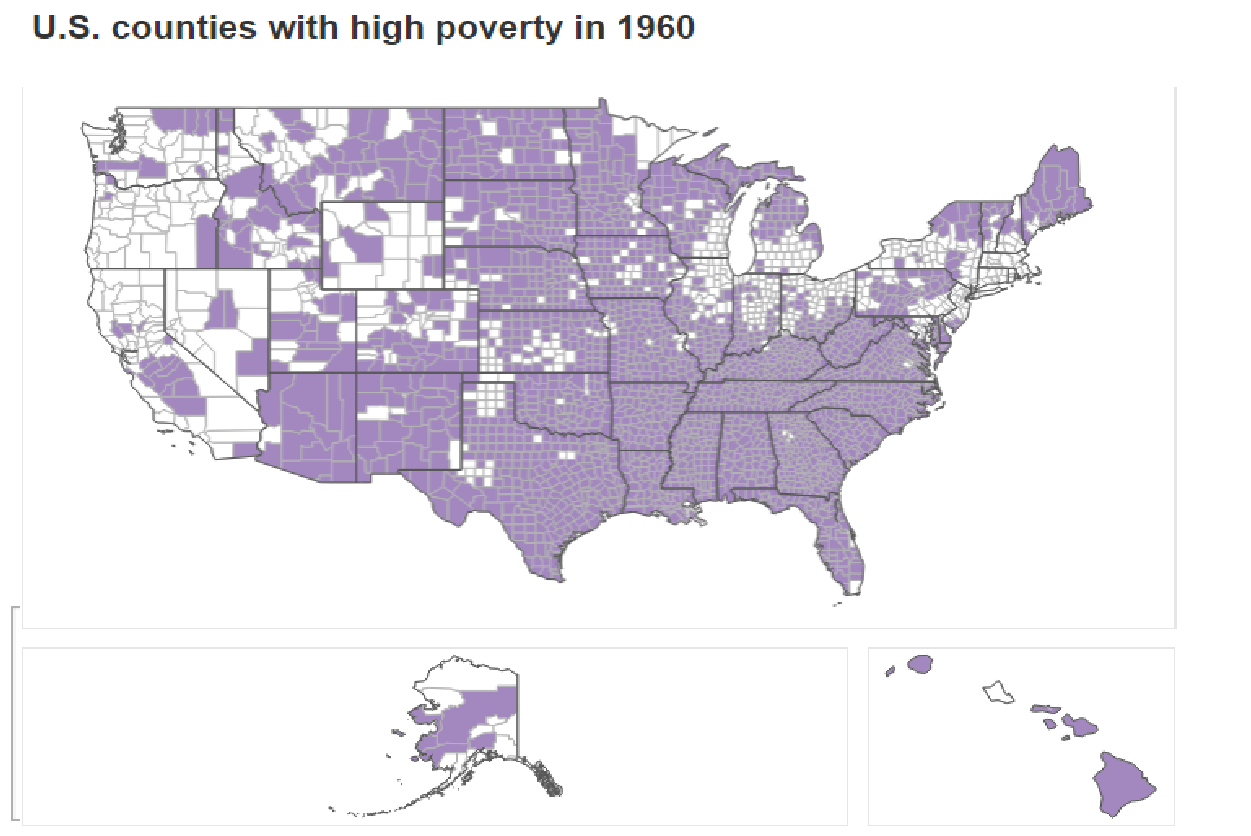
Consecutive decades of high poverty since 1960 in U.S. counties -
2/8/2022
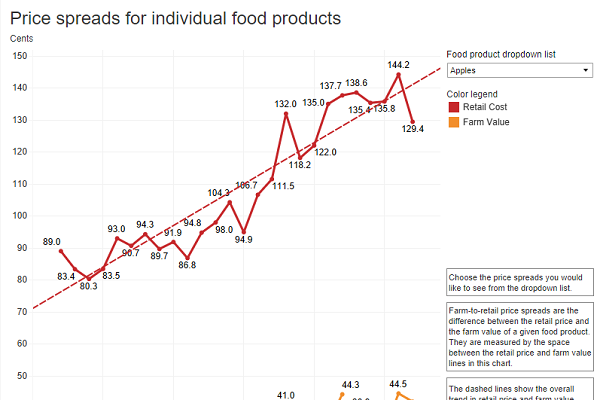
Price spreads for individual food products -
2/8/2022
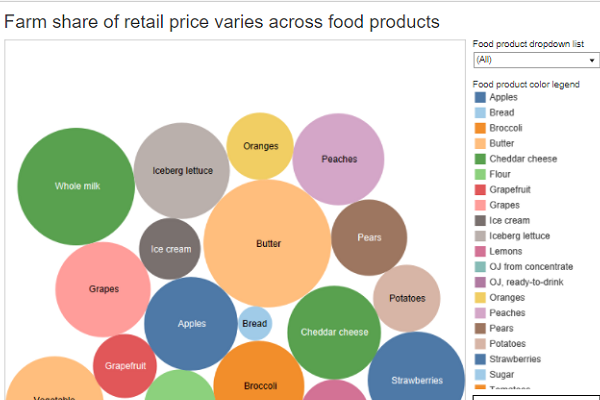
Farm share of retail price varies across food products -
2/8/2022
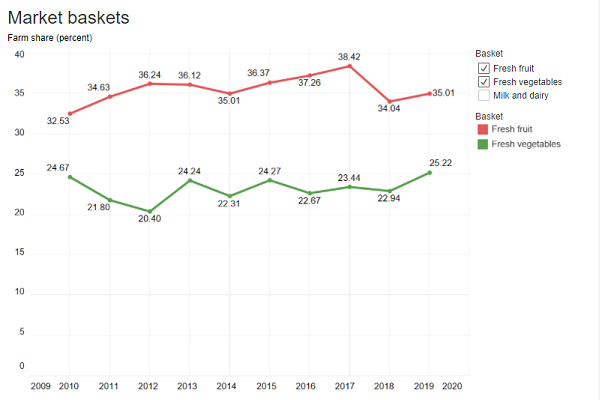
Market baskets -
2/8/2022
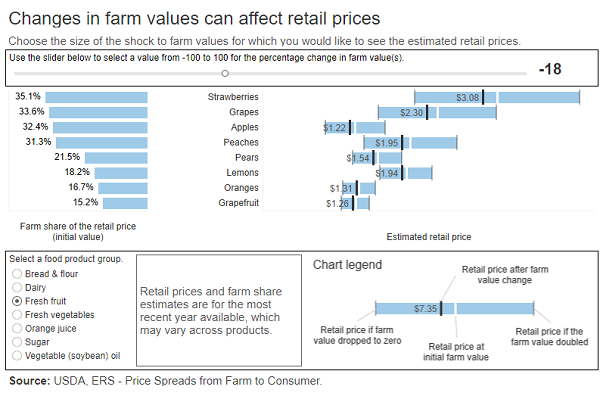
Changes in farm values can affect retail prices -
11/19/2021
UK agricultural imports and exports -
11/19/2021
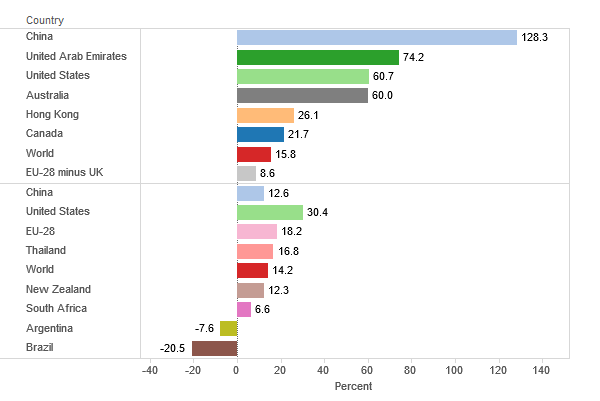
Percentage change in UK agricultural exports and imports between 2015 and 2020 -
11/19/2021
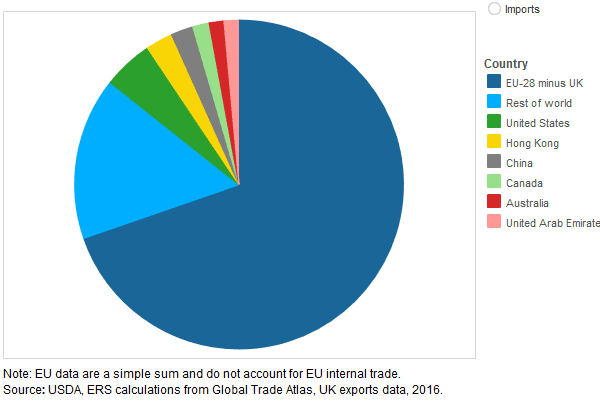
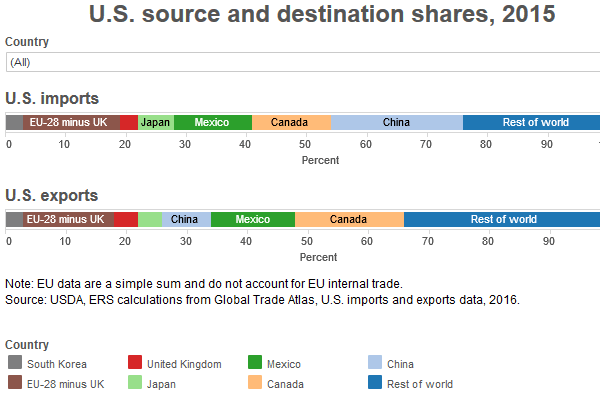
U.S. source and destination shares, 2020 -
11/19/2021
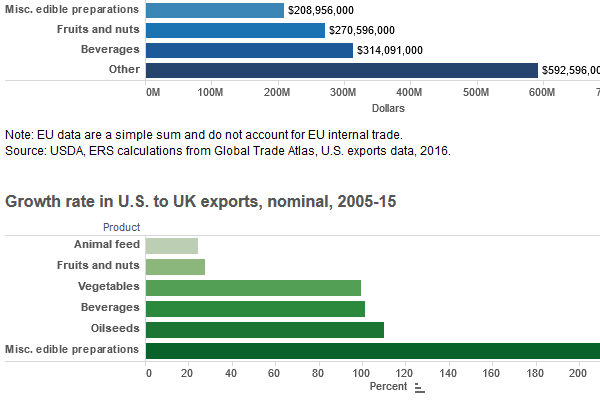
U.S. agricultural exports to the UK by product, 2020 -
6/17/2021
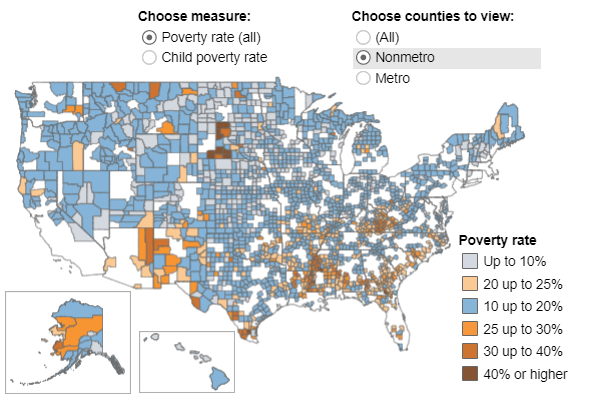
U.S. county poverty rates, 2015-19 average -
6/17/2021
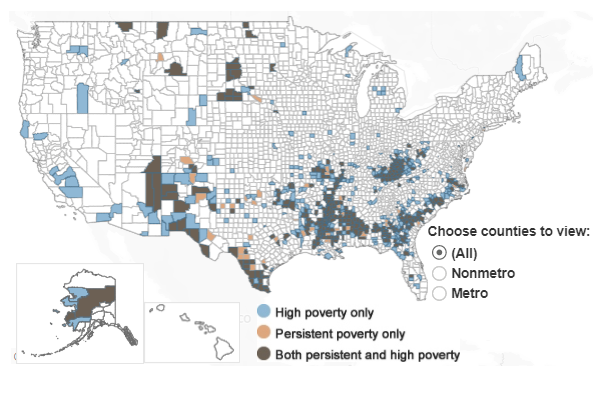
Persistent poverty (2015 ERS county type) and high poverty (2015-19 ACS average) U.S. counties -
11/16/2020
Food away from home average price per meal by State and outlet -
9/30/2019
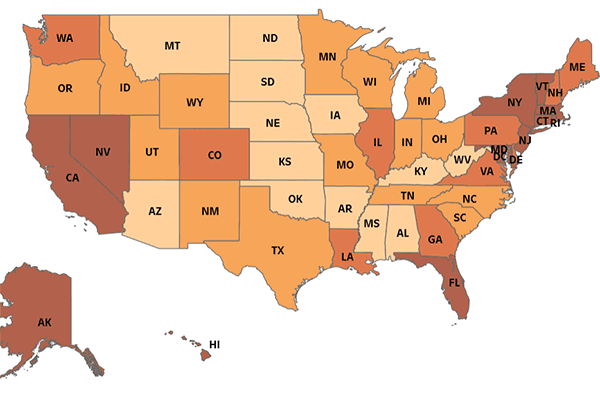
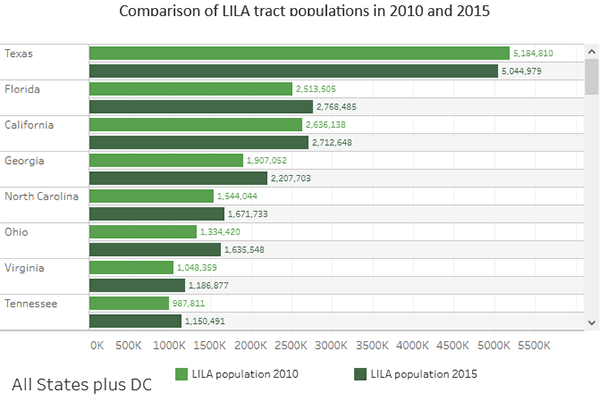
State-Level Estimates of Low Income and Low Access Populations -
9/5/2019
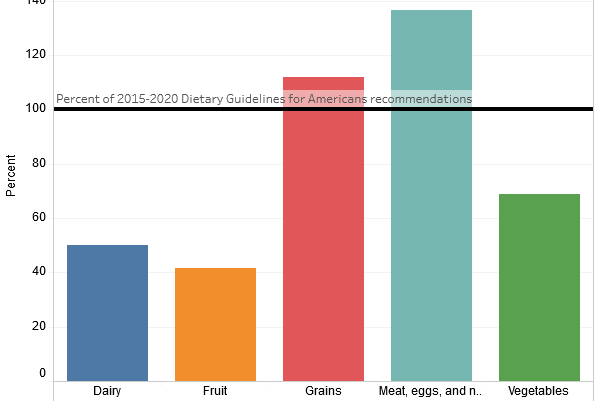
Dietary Recommendations and Calorie Consumption -
9/5/2019
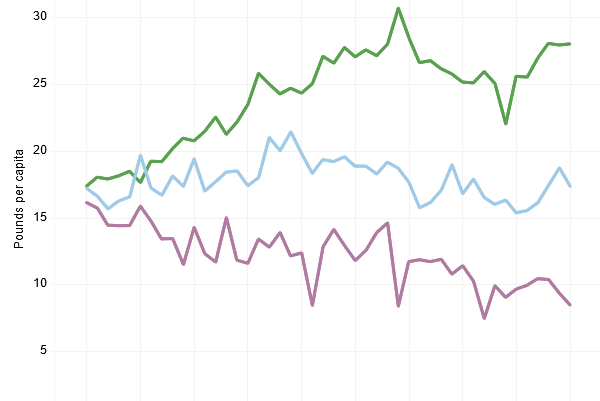
U.S. per capita food availability for additional commodities -
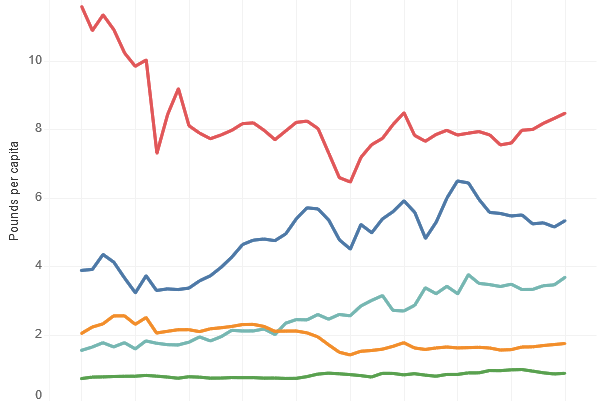
9/5/2019
U.S. per capita food availability for selected commodities -
9/5/2019
Fruit and Vegetable Availability -
12/18/2018
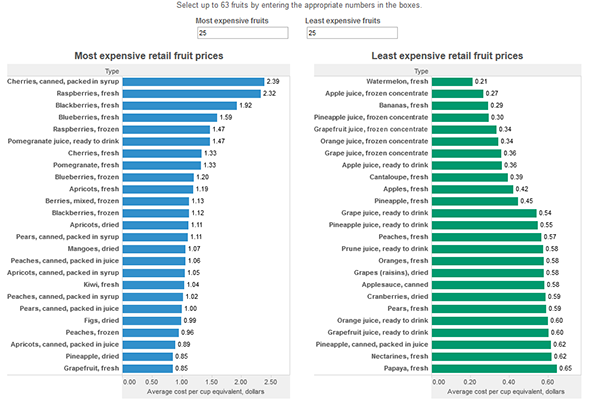
Fruit and vegetable retail prices: Most and least expensive, 2016 -
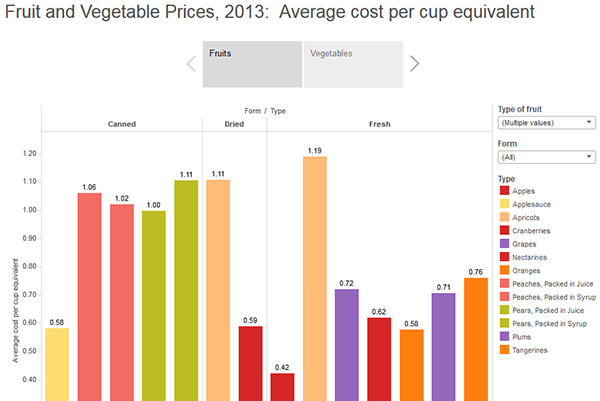
12/17/2018
Fruits and Vegetable Costs per Edible Cup Equivalent -
9/6/2018
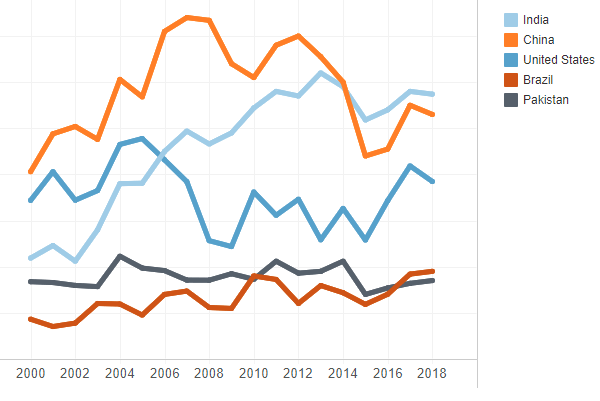
Global cotton supply and use -
5/16/2018
FoodAPS National Household Food Acquisition and Purchase Survey -
2/5/2018
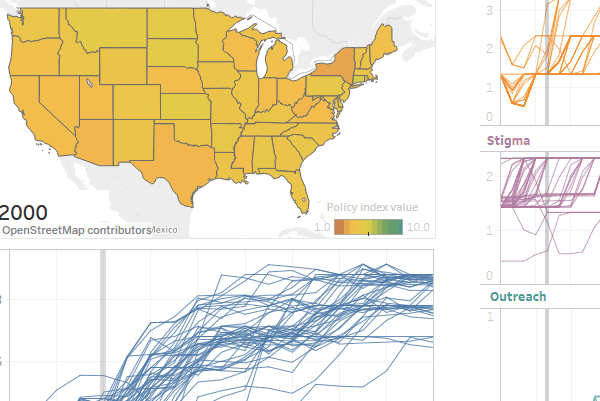
SNAP Policy Index -
8/28/2017
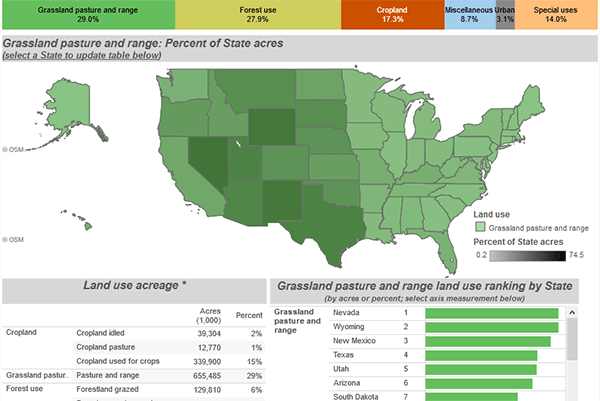
Maps and State Rankings of Major Land Uses -
3/2/2017
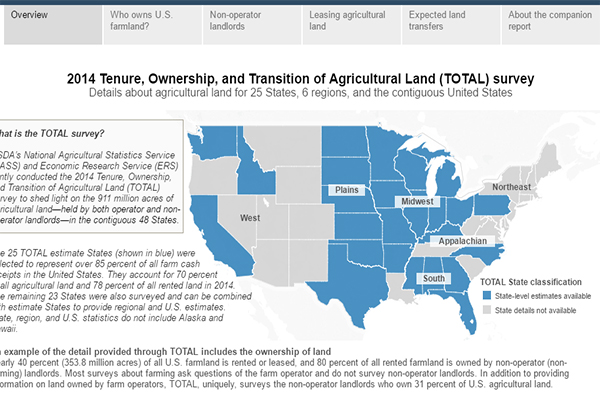
2014 Tenure, Ownership, and Transition of Agricultural Land (TOTAL) survey -
12/8/2016
U.S. Agricultural Trade Balance -
10/5/2015
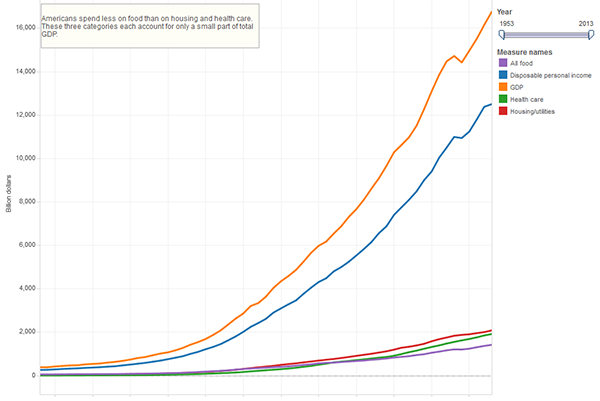
Trends in U.S. food expenditures -
5/7/2015
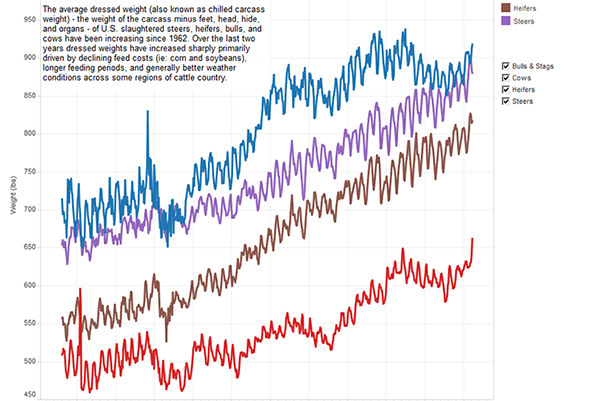
Cattle-Dressed Weights and Prices -
1/15/2015
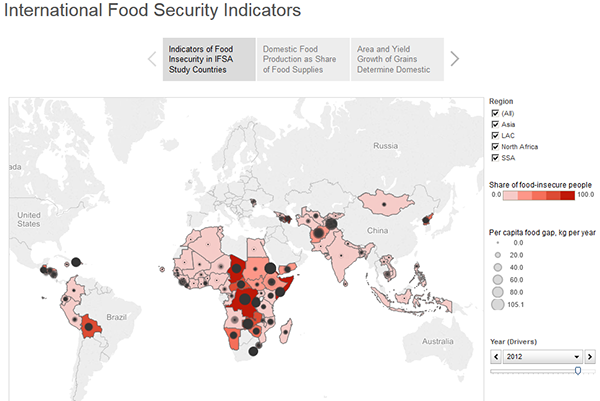
International Food Security Indicators