ERS Charts of Note
Subscribe to get highlights from our current and past research, Monday through Friday, or see our privacy policy.
Get the latest charts via email, or on our mobile app for  and
and 
Wednesday, October 18, 2023
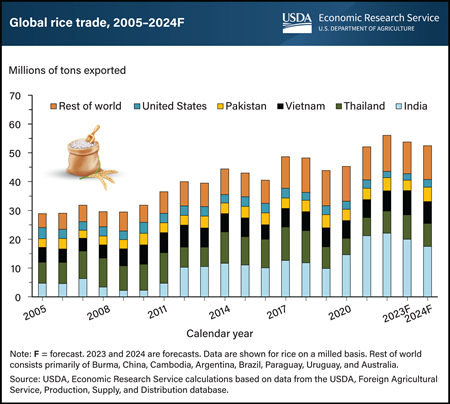
Global rice trade is projected to decline in 2023 and 2024 after India, the world’s largest rice exporter, implemented additional export restrictions on rice in July and August 2023. India accounted for more than 40 percent of global exports in 2022, supplying more rice than each of the next four largest suppliers—Thailand, Vietnam, Pakistan, and the United States. In summer 2023, India placed a ban on export sales of regular-milled white rice while imposing tariffs and additional restrictions on other types of exported rice. Global prices for rice then rose by 12 to 14 percent by the end of July. Prices continued to surge in August, reaching their highest since 2008, dropping slightly by mid-September as panic buying slowed. The impact is felt by many of the world’s food-insecure countries, especially in Sub-Saharan Africa, India’s largest export market. This region is expected to import less rice in 2023 and 2024 even as Thailand, Vietnam, and Pakistan pick up additional sales, despite tight supplies in Thailand and Vietnam. This chart is drawn from the October 2023 Rice Outlook, published by USDA, Economic Research Service. Also see the August 2023 and September 2023 Rice Outlook.
Thursday, September 21, 2023
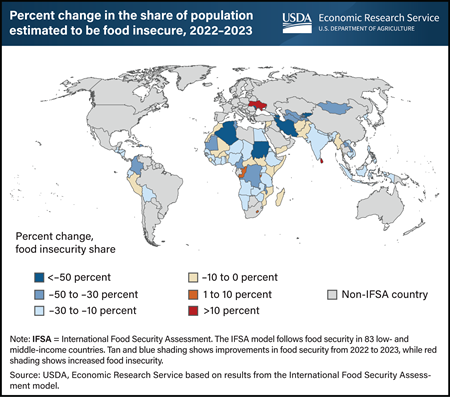
USDA’s International Food Security Assessment (IFSA) model estimates how food prices and incomes affect food demand and access in 83 low- and middle-income countries. Food security is then evaluated by estimating the share of a country’s population that is unable to access sufficient calories to sustain a healthy and active lifestyle. In IFSA countries in 2023, almost 229 million fewer people are estimated to be food insecure compared with 2022, a 16.8-percent decrease. That improvement stems from average annual income growth of 3.7 percent for countries included in the IFSA. In 2023, the average per capita Gross Domestic Product—a proxy for income—for the IFSA countries was $2,415, higher than the $2,253 average for 2020–22. In addition, the drop in the price of vegetable oils contributes to food security improvements in 2023. Vegetable oil is a common component of many foods and, according to the Food and Agricultural Organization of the United Nations, makes up about 10 percent of calories consumed in a day in low-income countries. The year-to-year reduction in food insecurity indicates recovery from factors that continue to affect the global economy, including the Coronavirus (COVID-19) pandemic, high inflation rates for food and farm production inputs, and the ongoing Russian military invasion of Ukraine. This chart appears in the USDA, Economic Research Service report International Food Security Assessment, 2023-33, published in August 2023.
_450px.png?v=9236.8)
Tuesday, October 11, 2022
Access to food by the world’s most vulnerable households becomes constrained when food commodity prices are high, especially when the foods they purchase are sourced through international trade. USDA’s International Food Security Assessment (IFSA) model estimates how food prices and incomes affect food demand and access in 77 low- and middle-income countries. Food security is then evaluated by estimating the population unable to access sufficient calories to sustain a healthy, active lifestyle. Of the people in countries included in the 2022 IFSA, almost 119 million more people are estimated to be food insecure compared to 2021. That marks a nearly 10-percent year-to-year increase. The upward trend in international prices for wheat, coarse grains, and vegetable oils during the 2021/22 marketing year has been further exacerbated by Russia’s military invasion of Ukraine which reduced exports of these commodities from the Black Sea region. Domestic prices of major grains in 2022 are projected to rise in 70 of the 77 countries included in the IFSA, with the North Africa region being the most affected. North Africa, which is dependent on imports of wheat and corn, is estimated to see an increase in the prevalence of food insecurity by nearly 25 percent, relative to 2021. This chart appears in the USDA, Economic Research Service report, International Food Security Assessment, 2022-32, released September 15, 2022.
Friday, October 15, 2021
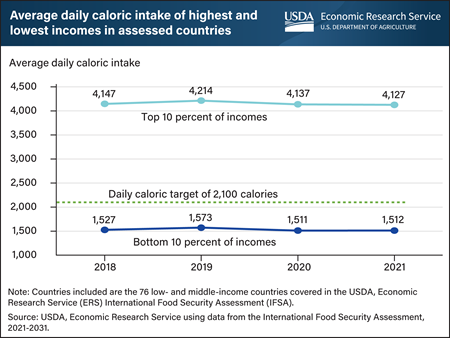
Globally, food insecurity—defined as lacking access to at least 2,100 calories per day—has intensified during the Coronavirus (COVID-19) pandemic. The world’s poorest populations experienced a reduction in consistent access to food and increased food insecurity, in part because of pandemic-related income shocks. In the 76 low- and middle-income countries covered in USDA, Economic Research Service’s (ERS) International Food Security Assessment (IFSA), average daily caloric consumption for the 10 percent of these countries’ population with the lowest income fell by 3.9 percent, or 62 calories per day, in 2020 relative to 2019. Access to food for the wealthiest 10 percent of the 76 countries’ population was also affected, with daily caloric intake falling by 1.8 percent, or 77 calories, year to year. In part because of the persistent effects of COVID-19 on income levels, the number of food-insecure people in 2021 is estimated at 1.2 billion, an increase of 32 percent, or 291 million people, from the 2020 estimate. This suggests that in 2021, nearly one-third of the population of the countries included in the IFSA study will lack access to sufficient food to reach the daily nutritional target of 2,100 calories set by the Food and Agricultural Organization of the United Nations. This chart is drawn from the USDA, ERS International Food Security Assessment, 2021-31.
Monday, August 2, 2021
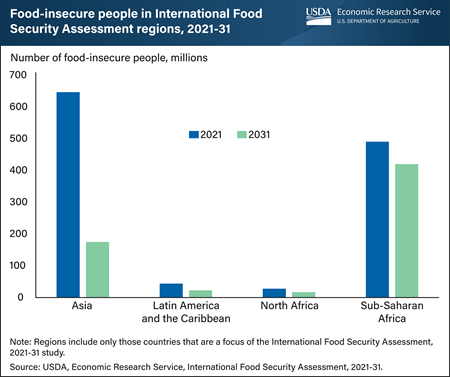
About a third of the 3.9 billion people in 76 low and middle-income countries may not have consistent access to adequate calories needed to sustain a healthy and active lifestyle in 2021, according to the latest International Food Security Assessment (IFSA) released by USDA’s Economic Research Service (ERS). The IFSA model looks at per capita food demand and compares that estimate with a daily 2,100-calorie nutritional target set by the United Nations to forecast long-term projections of food security and nutrition. The number of people without access to 2,100 calories a day—the food-insecure—is estimated at 1.2 billion, an increase of almost 32 percent (291 million people) from the 2020 estimate. Most of the additional 291 million people estimated to be food insecure are in Asia (72 percent) and in Sub-Saharan Africa (21 percent). By 2031, income growth across the IFSA regions is projected to accelerate, especially if the effects of the COVID-19 pandemic on local economies recede. Slower population growth coupled with an expectation for lower food prices over the next decade will reduce the number of people considered food insecure to 642.4 million in 2031, the IFSA study projects. The share of the population that is food insecure in the 76 countries studied is projected to fall to 14.1 percent, a 54.4 percent drop from its 2021 estimate. This chart appears in ERS’ International Food Security Assessment, 2021-2031 situation and outlook report.
Friday, April 30, 2021
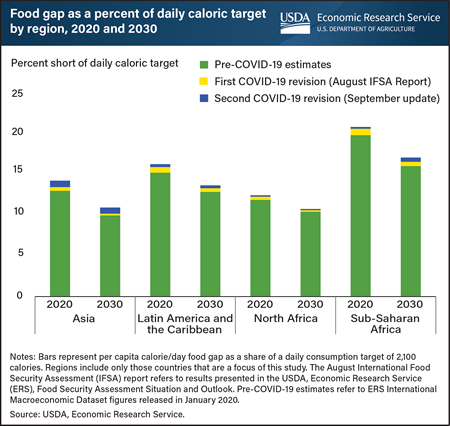
The intensity of global food insecurity, indicated by a measure called the food gap, is projected to lessen over the coming decade in the world’s poorest regions, even amid decreased incomes associated with pandemic-related drops in Gross Domestic Product (GDP). The food gap measures how much food is needed to raise consumption at every income level to meet the nutritional target of 2,100 calories per capita per day, a minimum intake to sustain a healthy and active lifestyle. For the four regions studied in the USDA, Economic Research Service International Food Security Assessment (IFSA), the food gap in 2020 ranged from a low of 12 percent of the daily caloric target in North Africa to 20 percent in Sub-Saharan Africa. In Asia, income effects related to the Coronavirus COVID-19 pandemic are estimated to have increased the food gap’s share of the daily caloric target in 2020 by more than 1 percent, the most of any region. The least impacted region was North Africa, where that share is estimated to have increased by about half a percent. Despite lower economic growth prospects for the IFSA regions associated with the pandemic, the food gap is projected to narrow by 2030. Income growth, along with relatively stable prices for major grains and lower population growth, are contributing factors to this improvement; however, the gap is 12 percent higher than earlier estimates reported by USDA after pandemic-related revisions. This chart is drawn from the USDA, Economic Research Service COVID-19 Working Paper, International Food Security Assessment 2020–30: COVID-19 Update and Impacts on Food Insecurity.
Wednesday, September 16, 2020
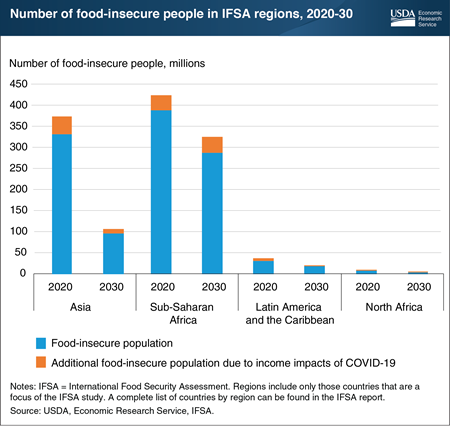
More than one-fifth of the 3.8-billion people located in 76 low- and middle-income countries in 2020 may not have consistent access to adequate calories to sustain a healthy and active lifestyle. The International Food Security Assessment (IFSA) models per capita food demand and compares it with a daily 2,100-calorie nutritional target to estimate long-term projections of food security and nutrition. In 2020, the number of people without access to 2,100 calories a day—the food-insecure—is estimated at 844 million. Of those, about 50 percent live in Sub-Saharan African countries, and 44 percent live in Asian countries. By 2030, however, the outlook for food security improves, even considering the income-depressing effects of COVID-19, with the number of food-insecure people projected to fall by 46 percent to 456.8 million. Of the regions evaluated in IFSA, Asia is expected to make the most progress reducing food insecurity in the 10-year period, while Sub-Saharan Africa is projected to improve at the slowest rate. Rising per capita incomes in most countries in the model, combined with relatively low food grain prices, are the expected drivers of the improvement in the food security outlook over the next decade. This chart appears in the Economic Research Service’s International Food Security Assessment, 2020-2030 situation and outlook report.
Friday, November 15, 2019
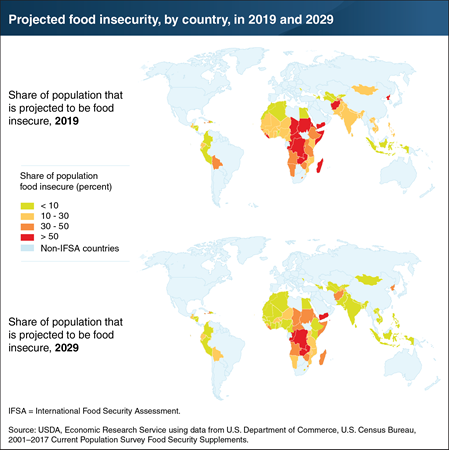
ERS’s annual International Food Security Assessment (IFSA) estimates and projects levels of food insecurity at a national level for 76 low- and middle-income countries. ERS projects per capita food consumption based on food prices and income and evaluates it against a daily caloric target of 2,100 calories per person per day—the lower bound of average calorie requirements across all regions, assuming a healthy and active lifestyle. In 2019, 19 percent of the population in the 76 studied countries is estimated to be food insecure. This means that about 728 million people—out of a population of 3.8 billion in the studied countries—consume fewer than 2,100 calories a day. By 2029, based on projected income growth and sustained low food prices, the share of food-insecure people in these countries is expected to decline to 9 percent and the number to 399 million. The biggest improvements are projected for Asia, where strong economic growth, particularly in India and Southeast Asia, combined with slowing population growth, contribute to increasing per capita incomes and expected improved food security by 2029. This chart appears in the ERS report, “International Food Security Assessment, 2019-2029,” released in August 2019.
Friday, August 9, 2019
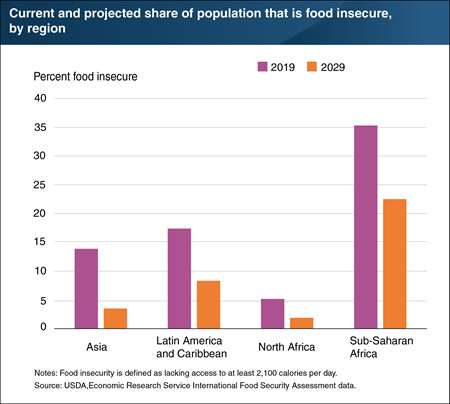
ERS’s annual International Food Security Assessment analyzes food insecurity conditions in 76 low- and middle-income countries spanning four regions of the world. The assessment projects per capita food consumption based on prices, income levels, and availability, and evaluates it against a caloric target of 2,100 calories per person per day, a level necessary to sustain life at a moderate level of activity. Across all countries studied, the share of the population that is food insecure will fall from an estimated 19.3 percent in 2019 to 9.2 percent by 2029, and the number of food-insecure people in the four regions will fall from an estimated 728 million to 399 million. While all regions are expected to see improvements in food security, Sub-Saharan Africa is expected to continue to experience the highest rates of food insecurity. Over the next decade, the share of Sub-Saharan Africa’s population that is projected to be food insecure is expected to fall from 35.3 percent to 22.5 percent. Although this improvement is significant, food insecurity in this region would be nearly three times that of any other region by 2029. Conversely, food-insecurity rates for both Asia and Latin America and the Caribbean are expected to fall below double digits by 2029. Beginning from the lowest level of the four regions, the rate in North Africa is expected to fall below 2 percent by 2029. This chart appears in the August 2019 ERS report, International Food Security Assessment, 2019–2029.
Wednesday, June 26, 2019
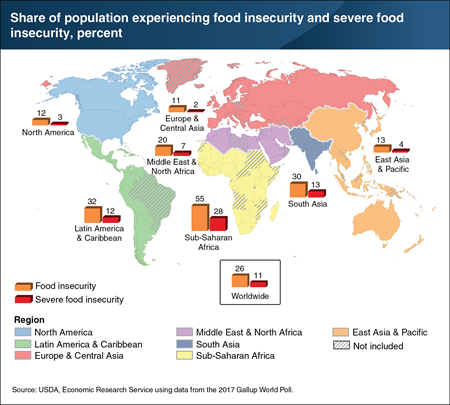
Food insecurity—the lack of access to sufficient, safe, and nutritious food—exists at some level in every country. In 2014, the Food and Agriculture Organization of the United Nations created the Food Insecurity Experience Scale (FIES) based on responses to a series of survey questions to provide a standardized measure of people’s direct experiences of food insecurity. The measure can be used to track food insecurity around the world and identify risk factors. FIES data from 2017 show significant variations across global regions in the prevalence of food insecurity and severe food insecurity. Severe food insecurity is the most extreme range of food insecurity and generally corresponds to hunger. In 2017, Sub-Saharan Africa had the highest prevalence of food insecurity (55 percent) and severe food insecurity (28 percent), followed by Latin America and the Caribbean (32 percent food insecure and 12 percent severely food insecure), and South Asia (30 percent and 13 percent, respectively). Food insecurity and severe food insecurity were lowest in North America and Eastern Europe and Central Asia. This chart appears in “Who Are the World’s Food Insecure? Identifying the Risk Factors of Food Insecurity Around the World” in the June 2019 edition of ERS’s Amber Waves magazine.
Tuesday, November 13, 2018
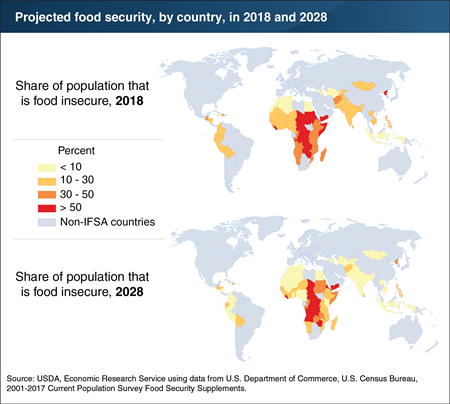
ERS’s annual International Food Security Assessment (IFSA) estimates and projects levels of food insecurity at a national level for 76 low- and middle-income countries. Using a demand-oriented model, ERS projects per capita food consumption based on prices and income and evaluates it against a daily caloric target of 2,100 calories per person per day, a level necessary to sustain a moderately active adult. In 2018, 21 percent of the population in the 76 studied countries is estimated to be food insecure. This means that about 782 million people—out of a population of 3.7 billion in the studied countries—consume less than 2,100 calories a day. By 2028, based on projected income growth and sustained low food prices, the share and the number of food-insecure people in these countries are expected to decline to 10 percent and 446 million, respectively. Projected income growth is positive in almost all countries included in the analysis, although growth rates are lower than in the early 2000s. The biggest improvements are projected for Asia, where strong economic growth, particularly in India and Southeast Asia, combined with slowing population growth, contribute to increasing per capita incomes and expected improved food security by 2028. This chart appears in “International Food Security Expected To Improve, But Regional Differences Persist” in ERS’s November 2018 Amber Waves magazine.
Thursday, September 13, 2018
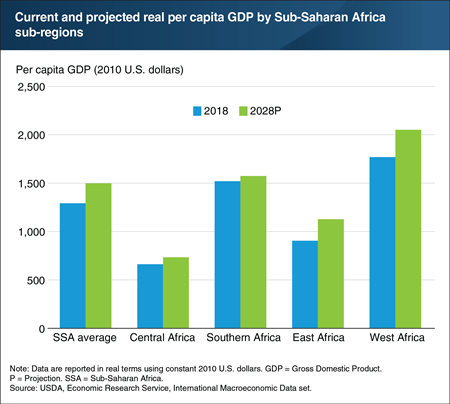
Based on ERS’s annual 10-year projections for key food security indicators for 76 low- and middle-income countries, the countries of Sub-Saharan Africa continue to be the most food insecure region among all those studied, though levels of food security vary within the region. The 39 Sub-Saharan African countries can be divided into four subregions: Central Africa (4 countries), East Africa (10 countries), Southern Africa (9 countries), and Western Africa (16 countries). Among the subregions, differences in social and economic structure, as well as in average income levels, contribute to the differences in food security. In terms of real per capita GDP growth by 2028 relative to 2018 levels, East and West Africa are expected to experience the largest growth at 25 percent and 16 percent, respectively. Conversely, Southern Africa, the second wealthiest subregion, is expected to grow by only 4 percent over the full 10-year projection period. The poorest subregion in Sub-Saharan Africa is expected to remain Central Africa, which has struggled with macroeconomic instability, conflict, and civil unrest. This chart appears in the September 2018 Amber Waves finding, “Sub-Saharan Africa’s Food Security Situation Varies by Region.”
Wednesday, July 11, 2018
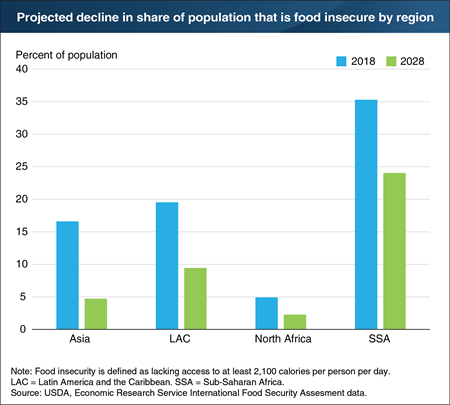
ERS’s annual International Food Security Assessment analyzes food security conditions in 76 low- and middle-income countries. The assessment projects per capita food consumption based on prices and income levels and evaluates it against a caloric target of 2,100 calories per person per day, a level necessary to sustain life at a moderate level of activity. Across all countries studied, the share of the population that is food insecure will fall from an estimated 21.1 percent in 2018 to 10.4 by 2028, and the number of food-insecure people will fall from an estimated 782 million to 446 million. While all regions are expected to see improvements in food security, Sub-Saharan Africa is expected to continue to struggle with significant food insecurity. Over the decade, the share of Sub-Saharan Africa’s population that is food insecure is expected to fall from 35 percent to 24 percent. While the change is significant, food insecurity would be more than double that of any other region by 2028. Conversely, Asia and Latin America and the Caribbean are both expected to fall below double digits by 2028. This chart appears in the July 2018 ERS report, International Food Security Assessment, 2018-2028.
Thursday, June 14, 2018
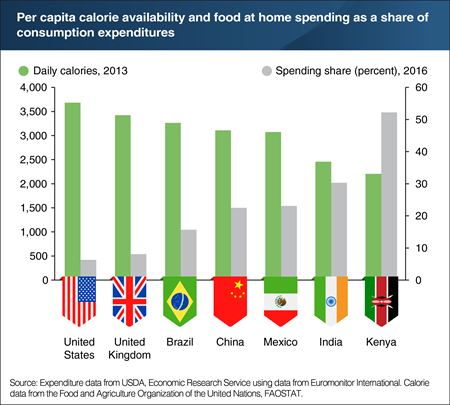
Countries vary in how much their citizens spend on food at home as a share of consumption expenditures. (Consumption expenditures include all household spending, but not savings.) In high-income countries such as the United States and the United Kingdom, spending shares on food at home are low because food is less expensive compared to other spending categories, people eat out more often, and incomes are high. In 2016, these two countries spent less than 10 percent of their consumption expenditures on food purchased from supermarkets and other food stores. In Kenya and other low-income countries, at-home food’s share of consumption expenditures can exceed 50 percent. Per capita calorie availability follows the reverse pattern. According to the most recent available data, U.S. per capita calorie availability was among the highest at 3,682 calories per day, while Kenya’s was estimated at only 2,206 calories per day, reflecting differences between the countries in supplies of food available for people to eat. This chart appears in ERS’s web product, Ag and Food Statistics: Charting the Essentials.
Monday, February 12, 2018
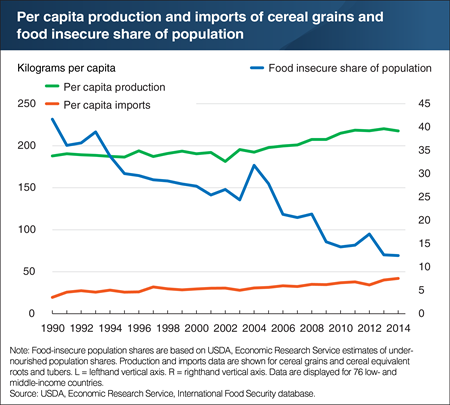
Global food security—when people have access to at least 2,100 calories per day—has improved over the past 15 years. Two key drivers of past improvements in food security are increased agricultural production and trade. Increases in production and agricultural productivity—producing the same or more output with fewer inputs like fertilizer or land—have improved food security. In countries where climate or lack of land or water resources limit the potential for local production, food imports have played an important complementary role. Since 1990, among the 76 low- and middle-income countries studied, production and imports of cereal grains and their equivalent has increased by 16 and 115 percent, respectively—although imports started from a much lower quantity. During this period, the share of populations experiencing food insecurity fell from 42 to 12 percent. Despite past success, challenges remain. Maintaining agricultural productivity growth as the global population rises will require investments to generate and deliver new technologies as well as efforts to broadly spread their adoption in food insecure countries. This chart appears in the February 2018 Amber Waves finding, "Progress and Challenges in Global Food Security."
Wednesday, December 20, 2017
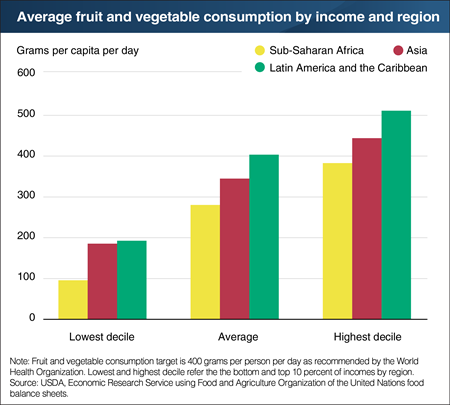
While food insecurity—measured as not having access to at least 2,100 calories per day—has declined across all regions of the world, challenges remain. Food insecurity is still prevalent in parts of Sub-Saharan Africa, Asia, and Latin America and the Caribbean. A key component of food security is access to fruits and vegetables, which are rich in essential nutrients. Latin America and the Caribbean has the highest fruit and vegetable intake level, being the only region with average consumption reaching the World Health Organization’s recommendation of 400 grams per capita of fruit and vegetable consumption per day. Sub-Saharan Africa falls short of the threshold for all income groups, and in Asia, only the highest income consumers are currently exceeding the target. Among the lowest income individuals across regions, however, consumers are especially sensitive to prices and are prone to rely on cheaper staple foods like grains over more expensive foods including fruits and vegetables. Globally, food security is projected to continue to improve as more developing nations grow economically, ultimately leading to increased fruit and vegetable consumption. This chart appears in the ERS Amber Waves feature, "International Food Security Assessment, 2017-27," released in July 2017.
Thursday, September 21, 2017
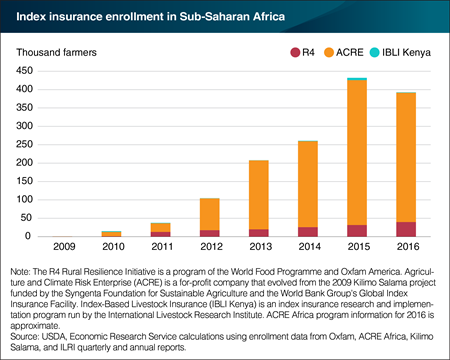
In the developing countries of Africa, most of the crop production needed to feed the region comes from smallholder farmers. But because of the risk of catastrophic loss, many of these farmers are unwilling to fully invest in inputs like machinery or better seeds, despite the potential to increase their average production and income. Index insurance (insurance based on a measure of weather that is highly correlated with farm-level losses), could help increase agricultural investments by allowing smallholder farmers manage their risk in places where traditional insurance might not be offered. Successful programs recently focused on developing countries include the R4 Rural Resilience Initiative, Agriculture and Climate Risk Enterprise (ACRE Africa), and Index-Based Livestock Insurance (IBLI) in Kenya. These programs, which have grown significantly since 2009 when fewer than 1,000 farmers were covered, have taken a holistic approach by offering index insurance alongside other risk management services and credit assistance. In 2016, nearly 400,000 farmers were covered. There is evidence that index insurance is improving farmer productivity and well-being in some developing country cases. In Senegal, insured R4 program participants increased rice production at 10 times the rate of uninsured control group farmers from 2013 to 2015. Index insurance is a promising approach to providing insurance and improving risk management, but it is still at the early stages of adoption and is available to only a small number of Sub-Saharan Africa’s 50 million farms. This chart appears in the ERS report, "Progress and Challenges in Global Food Security," released in July 2017.
Friday, August 25, 2017
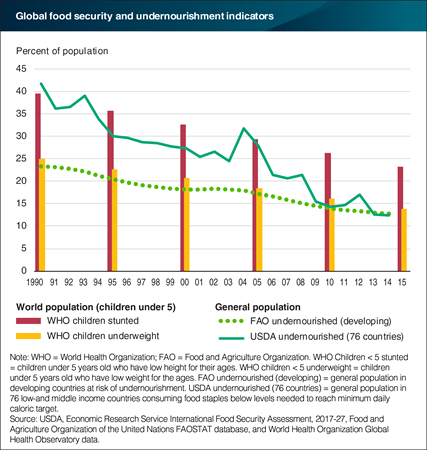
The United States made commitments to end global food insecurity by 2030 as part of the 2015 Global Sustainable Development goals. In 2016, the country enacted the Global Food Security Act, which seeks to reduce food insecurity and poverty through agricultural-led growth, increased resilience, and a broad commitment to improved nutrition. Because initiatives to address international food insecurity are evidence driven, advances in measuring food security remain critical to monitoring and evaluating progress. Assessments using metrics that primarily capture food availability and access dimensions confirm significant improvements in global food security over the past few decades. According to the Food and Agriculture Organization of the United Nations, the prevalence of undernourished people in the developing world declined from 23.3 percent to 12.9 percent between 1990 and 2015. The ERS International Food Security Assessment, 2017-27, finds that the prevalence of undernourishment has more than halved between 1990 and 2015 for the 76 low- and middle-income countries that USDA regularly tracks. This chart appears in the ERS report "Progress and Challenges in Global Food Security," released in July 2017.
Monday, March 20, 2017
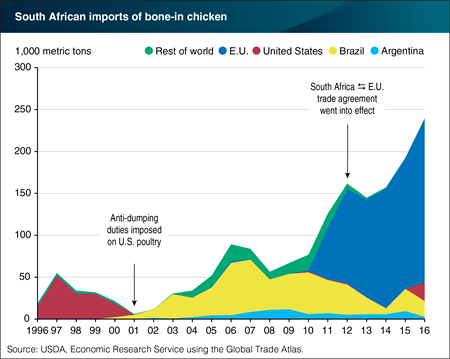
Until 2001, the United States was the largest supplier of bone-in chicken to the South African market. But in 2001, South Africa imposed anti-dumping duties on U.S. chicken leg quarters, after which U.S. exports dropped nearly to zero. In 2015, under pressure from the U.S. poultry industry, Congress threatened to exclude South Africa from the upcoming renewal of the African Growth and Opportunity Act (AGOA), unless the country provided greater market access to U.S. poultry. South Africa agreed in June 2015 to allow a quota of 65,000 metric tons of U.S. bone-in chicken at the most favored nation tariff rate of 37 percent. The first U.S. chicken entered the South African market in March 2016. Total U.S. exports of bone-in chicken to South Africa during 2016 reached 21,291 metric tons, taking 11 percent of the market. The U.S. share came at the expense of Brazil and Argentina, both of which saw a drop in their exports to South Africa. The largest supplier was the European Union (EU), which maintained its 74 percent share of South African imports of bone-in chicken. This chart appears in the March 2017 Amber Waves finding, "South Africa Resumes Imports of U.S. Chicken Following 15 Years of Anti-Dumping Duties."
Friday, December 2, 2016
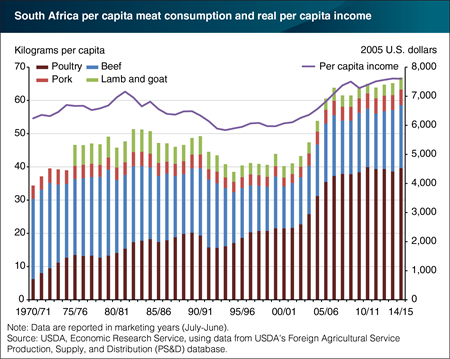
Like many middle-income countries, South Africa’s rising income has been accompanied by significant increases in per capita meat consumption. Poultry meat, being cheaper than other meats, accounts for most of the growth. Per capita poultry consumption more than doubled from 17 kilograms in 1994/95 to 40 in in the 2013/14 marketing year. In recent years, beef consumption has also risen, but poultry consumption remains dominant. Consumption of other meats has remained constant. South Africa’s real per capita income has maintained almost uninterrupted growth since 2000, only dropping in 2009 with the global recession. The initial surge in poultry consumption in the early 2000’s closely tracks the rapid rise in per capita income. While domestic production of poultry has expanded rapidly to accommodate demand, imports have grown at an even faster rate. This chart appears in the ERS Poultry Production and Trade in the Republic of South Africa: a Look at Alternative Trade Policy Scenarios special outlook report released in November 2016.


