ERS Charts of Note
Subscribe to get highlights from our current and past research, Monday through Friday, or see our privacy policy.
Get the latest charts via email, or on our mobile app for  and
and 
Thursday, May 28, 2015
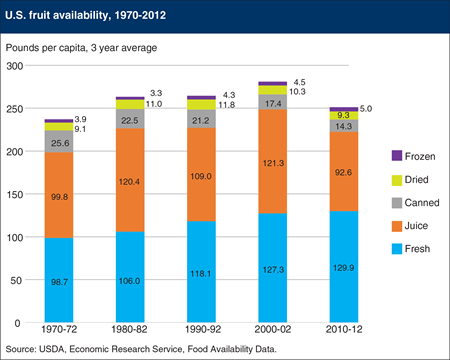
According to ERS’s Food Availability data, per capita supplies of fruit available for consumption in the United States have fallen over the last decade after rising since the early 1970s. In 2010-12, per capita fruit availability was 251 pounds per person (fresh-weight equivalent), down from 281 pounds per person in 2000-02. Increased U.S. production and greater imports of some types of fruit have not compensated for decreased U.S. citrus production. Fresh fruit accounted for 52 percent of fruit availability in 2010-12, up from a 42-percent share in 1970-72. Bananas, apples, and oranges were the most popular fresh fruits in 2010-12, accounting for 40 percent of fresh fruit availability. Processed fruit availability (canned, juice, frozen, and dried forms) has steadily fallen since reaching a peak of 171 pounds per person (fresh-weight equivalent) in 1977 to a low of 114 pounds in 2012. The bulk of the decline came from juice, especially orange juice. Availability of orange juice fell from 97 pounds per person in 1977 to 44 pounds in 2012. This chart appears in “Fresh Fruit Makes Up a Growing Share of U.S. Fruit Availability” in the May 2015 issue of ERS’s Amber Waves magazine.
Monday, April 20, 2015
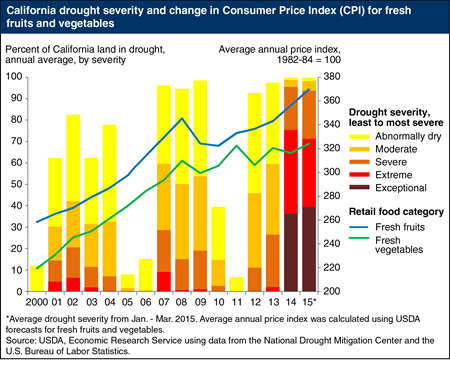
The California drought continues into 2015—as of March, 42 percent of the State is classified under the exceptional drought rating. Despite these conditions, U.S. fresh fruit and vegetable price inflation is expected to be close to its historical average in 2015. ERS predicts fresh fruit prices will increase 2.5 to 3.5 percent and fresh vegetable prices 2.0 to 3.0 percent. While California does grow a large percentage of many U.S. fresh fruits and vegetables, portions of the produce purchased in grocery stores are imported from various foreign markets. Currently, the strong U.S. dollar is making foreign produce relatively less expensive, putting downward pressure on U.S. retail produce prices. Commodities that are grown almost entirely in California and whose supplies are not largely supplemented by imports could begin to experience higher price increases in 2015. This chart appears in the Food Prices and Consumers section of the California Drought: Farm and Food Impacts page on the ERS website. Information on ERS’s food price forecasts can be found in ERS’s Food Price Outlook data product.
Thursday, April 9, 2015
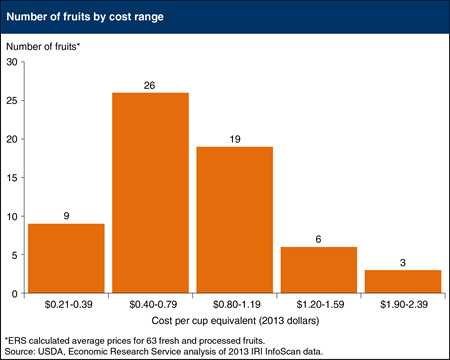
Food intake surveys find Americans consuming about half the amount of recommended fruits per day. One reason may be that some consumers perceive fruit to be expensive. ERS calculated average prices paid in 2013 for 63 fresh and processed fruits measured in cup equivalents. A cup equivalent is the edible portion that will generally fit in a 1-cup measuring cup; 1/2 cup for raisins and other dried fruits. The amount of fruit a person should eat per day depends on age, gender, and level of activity. For a 2,000-calorie diet, 2 cup equivalents of fruits per day is recommended. Fresh watermelon at 21 cents per cup equivalent and apple juice (made from concentrate) at 27 cents were the lowest priced fruits, while fresh blackberries, fresh raspberries, and canned cherries were the priciest. Thirty-five fruits cost less than 80 cents per cup equivalent. The data in this chart are from ERS's Fruit and Vegetable Prices data product on the ERS website, updated March 19, 2015.
_450px.png?v=8279.5)
Tuesday, December 30, 2014
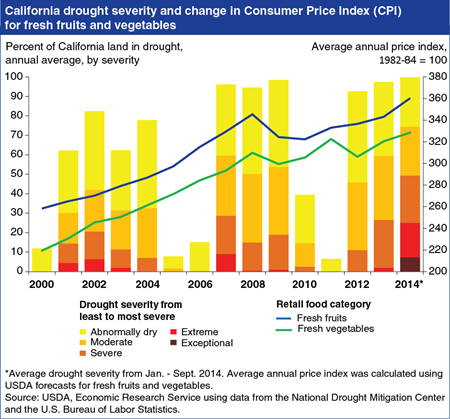
The severity and duration of the ongoing drought in California has raised concerns over its role in rising food prices at the grocery store, especially for fresh fruits and vegetables. In 2012, California produced nearly 50 percent (by value) of the nation’s vegetables and non-citrus fruit. Droughts in California are generally associated with higher retail prices for produce, but price increases are lagged due to the time it takes for weather conditions and planting decisions to alter crop production, which then influence retail prices. In 2005, following five years of drought, retail fruit prices rose 3.7 percent and retail vegetable prices increased 4 percent. Prices continued to rise in 2006, one year after drought conditions began to improve. However, other factors such as energy prices and consumer demand also affect retail produce prices. For example, prices for fresh produce fell in 2009 despite drought conditions, as the 2007-09 recession reduced foreign and domestic demand for many retail foods. As of October 2014, ERS analysts are forecasting fresh fruit prices to increase 4.5 to 5.5 percent in 2014 and vegetable prices to be 2 to 3 percent higher. This chart appears in the Food Prices and Consumers section of the 2014 California Drought page on the ERS website. Information on ERS’s food price forecasts can be found in ERS’s Food Price Outlook data product, updated October 24, 2014. Originally published Thursday October 30, 2014.
_450px.png?v=8279.5)
Tuesday, December 23, 2014
The successful cultivation of many U.S. specialty and orchards crops (including almonds, sunflowers, canola, grapes, and apples) is dependent upon commercial insect pollination. The European honey bee is largely preferred over other pollinators due to their relative ease of transport and management. Migration routes often include a stop in California to pollinate almonds in early spring. An estimated 60-75 percent of U.S. commercial hives are employed for the State’s almond bloom, which draws hives from as far away as Florida and Texas. Migratory paths diverge after the almond bloom; some beekeepers remain in California while others move north to service mainly orchard and berry crops, and others depart for southern and eastern States to pollinate a variety of specialty field crops. During the pollination season, an estimated 65-80 percent of commercial hives spend part of the summer foraging in the northern Great Plains. At the end of the summer, many operations return their hives to overwintering sites in southern States. Find this map and further discussion on U.S. pollination markets in Fruit and Tree Nut Outlook.
Thursday, December 18, 2014
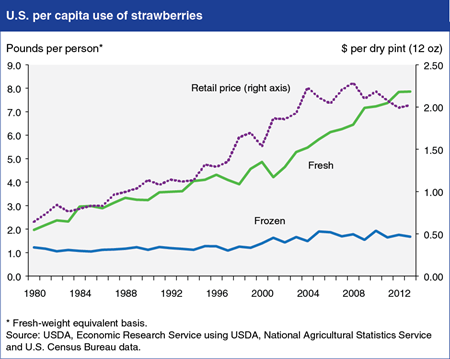
U.S. per capita strawberry use has generally trended higher since 1980, and the current production forecast supports the outlook for continued growth in 2014. Per capita use of fresh strawberries is expanding the fastest, reaching a record 7.9 pounds in 2013, in response to greater awareness of the importance of healthy diets, increased year-round availability through domestic production and imports, and adoption of improved varieties. The current USDA forecast for strawberry production in the three major strawberry-producing States?California, Oregon, and Florida?indicates combined output of 3.05 billion pounds in 2014, up 3 percent from last year. Production is forecast to increase 2 percent in California and 11 percent in Florida, but decline 3 percent in Oregon. Despite drought conditions, strawberry area in California is forecast to remain steady from a year ago at 41,500 acres, with higher yields per acre boosting production to a record 2.82 billion pounds. Even with a larger domestic crop and increased imports from Mexico and Canada, retail prices of fresh strawberries are averaging about 12 percent higher during the first 10 months of 2014 compared with a year earlier. Find this chart and additional analysis in Fruit and Tree Nut Outlook: September 2014.
Friday, November 21, 2014
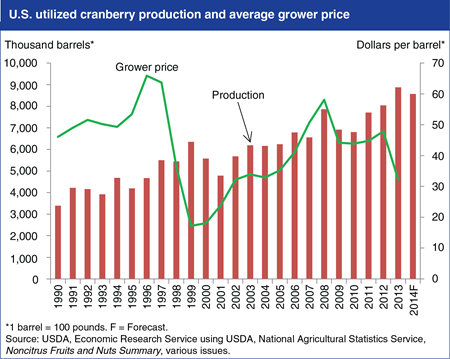
U.S. supplies of processed cranberries will likely remain large despite a small drop in forecast production for 2014, continuing downward pressure on cranberry grower prices. Cranberry production in 2014 is forecast at 8.57 million barrels (100 lbs each), down 4 percent from the record 2013 output, but still the second largest on record. Weather conditions reduced yields in Wisconsin, the largest producing State which accounts for about 60 percent of production, but generally favorable weather benefited the crops in Massachusetts, Oregon, and Washington. Following consecutive large harvests during 2011-2013, grower prices dropped 33 percent from $47.9 per barrel in 2012 to $32.3 per barrel 2013. This decline mostly reflected lower prices received for processing-use cranberries, which account for about three-quarters of domestic sales. For 2014, continued weak demand for some processed products and above-average beginning inventories signal continued weak grower prices. Find this chart and additional analysis in Fruit and Tree Nut Outlook: September 2014.
Wednesday, November 12, 2014
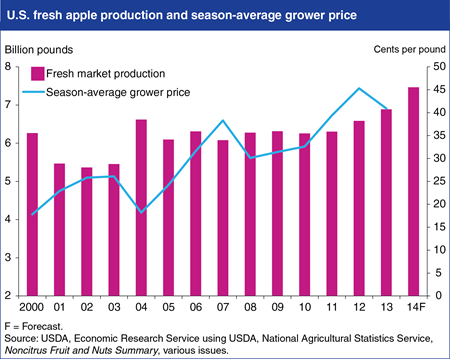
Despite harsh winter conditions in parts of the country, total U.S. apple production is forecast to rise 4 percent to 10.9 billion pounds in 2014, the third largest crop since 1990. Abundant supplies are expected to move into the fresh apple market and place downward pressure on U.S. fresh apple prices. Production in western States is expected to be up 13 percent, more than offsetting weather-reduced output in central and eastern States, including Michigan and New York. Washington’s 2014 apple crop is forecast to be 14 percent larger than in 2013, bringing in larger than normal supplies of apples for fresh use during the 2014/15 marketing season (August-July). Overall, about 7.5 billion pounds of production are forecast for fresh use, increasing fresh market supplies 8 percent from 2013 and 15 percent above the previous 5-year average. Early-season grower prices have weakened relative to recent years; the August 2014 average price of $0.375 per pound is 15 percent below the 2008-2012 average August (USDA did not report apple prices for August 2013). Find this chart and additional analysis in Fruit and Tree Nut Outlook: September 2014.
Thursday, October 30, 2014
The severity and duration of the ongoing drought in California has raised concerns over its role in rising food prices at the grocery store, especially for fresh fruits and vegetables. In 2012, California produced nearly 50 percent (by value) of the nation’s vegetables and non-citrus fruit. Droughts in California are generally associated with higher retail prices for produce, but price increases are lagged due to the time it takes for weather conditions and planting decisions to alter crop production, which then influence retail prices. In 2005, following five years of drought, retail fruit prices rose 3.7 percent and retail vegetable prices increased 4 percent. Prices continued to rise in 2006, one year after drought conditions began to improve. However, other factors such as energy prices and consumer demand also affect retail produce prices. For example, prices for fresh produce fell in 2009 despite drought conditions, as the 2007-09 recession reduced foreign and domestic demand for many retail foods. As of October 2014, ERS analysts are forecasting fresh fruit prices to increase 4.5 to 5.5 percent in 2014 and vegetable prices to be 2 to 3 percent higher. This chart appears in the Food Prices and Consumers section of the 2014 California Drought page on the ERS website. Information on ERS’s food price forecasts can be found in ERS’s Food Price Outlook data product, updated October 24, 2014.
Monday, October 27, 2014
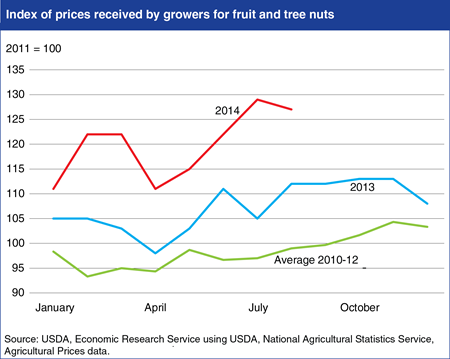
The index of prices received by U.S. fruit and tree nut growers has remained consistently above year-ago levels and 2010-12 average levels during 2014. The August grower price index for fruit and tree nuts was up 13 percent from a year earlier and 28 percent above the 2010-12 average. Late 2013 freezes in California and citrus greening issues in Florida have affected U.S. citrus crops and bolstered prices for most citrus fruit in 2014, with U.S. fresh orange prices reaching highs not seen since the early 1990s. Forecast smaller crops for grapes, peaches, and pears are contributing to elevated prices for non-citrus fruits. Lower expected production of some crops in California, as well as several other States, is contributing to the outlook for smaller overall harvests. Drought remains a serious concern among California fruit and tree nut growers, particularly if the lack of water for growing crops lingers through next year’s growing season. Find this chart and additional analysis in Fruit and Tree Nut Outlook: September 2014.
Wednesday, October 8, 2014
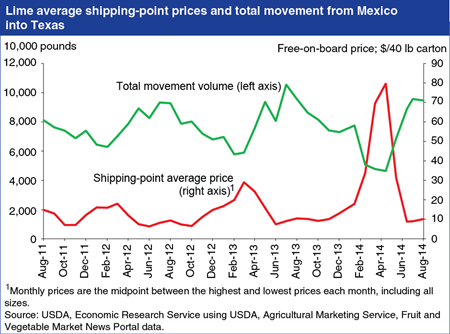
Since disease, pest outbreaks, and severe storm damage led to the decline of U.S. commercial lime production in the early 2000s, nearly all U.S. demand for fresh limes has been met through imports, originating almost exclusively from Mexico. Monthly shipment volumes and U.S. prices of limes generally reflect the seasonal pattern of supplies from Mexico, with lower volumes and higher prices during the winter months. In the spring of 2014, U.S. prices for limes spiked to record levels after heavy rainfall in Veracruz, Mexico in the fall of 2013 that led to a smaller harvest of Persian limes. The average shipping-point f.o.b. (free-on-board) price for Mexican limes peaked at $79.65 per 40-pound carton in April 2014, more than 3 times higher than in April 2013. National average advertised retail prices reported by USDA’s Agricultural Marketing Service (AMS) show that prices climbed to $1.02 per lime in April 2014, over triple the April 2013 price of $0.29 per lime. The price spike subsided by July 2014, as lime shipments increased with the beginning of the spring harvest in April 2014. Although there was speculation that a cartel in the state of Michoacán was behind the sharp rise in prices, that region primarily grows key limes rather than the Persian variety that is exported to the United States. Find this chart and additional analysis in Fruit and Tree Nuts Outlook.
Tuesday, September 30, 2014
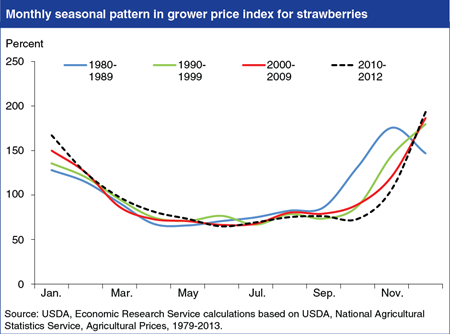
Developments in fresh fruit markets over the past 30 years, including changing production patterns, increased imports, improved storage, and shifts in consumer demand, have influenced the seasonal pattern of prices faced by U.S. growers. ERS analysis indicates that market conditions unique to each commodity affect the seasonality of grower prices. Products such as strawberries demonstrate a classic seasonal pattern for fresh produce, with higher prices at the beginning and/or end of the marketing season. However, there have been changes over time in the months when low and high fresh strawberry prices are realized. In the 1980s, the average monthly price index was at its lowest point in May, when shipment volumes were near their peak, but by the 2000s the low price point had moved to June, with high grower prices also shifting to later in the year. The range between high and low grower price indices did not change significantly for strawberries over the period studied, but it did for other fresh fruit, such as fresh peaches, grapes, and oranges. Find this chart and more in Evolving U.S. Fruit Markets and Seasonal Grower Price Patterns.
Friday, September 26, 2014
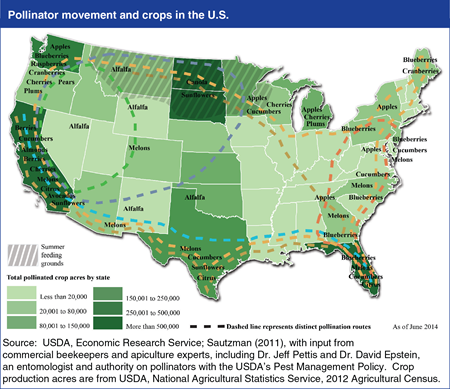
The successful cultivation of many U.S. specialty and orchards crops (including almonds, sunflowers, canola, grapes, and apples) is dependent upon commercial insect pollination. The European honey bee is largely preferred over other pollinators due to their relative ease of transport and management. Migration routes often include a stop in California to pollinate almonds in early spring. An estimated 60-75 percent of U.S. commercial hives are employed for the State’s almond bloom, which draws hives from as far away as Florida and Texas. Migratory paths diverge after the almond bloom; some beekeepers remain in California while others move north to service mainly orchard and berry crops, and others depart for southern and eastern States to pollinate a variety of specialty field crops. During the pollination season, an estimated 65-80 percent of commercial hives spend part of the summer foraging in the northern Great Plains. At the end of the summer, many operations return their hives to overwintering sites in southern States. Find this map and further discussion on U.S. pollination markets in Fruit and Tree Nut Outlook.
Friday, July 25, 2014
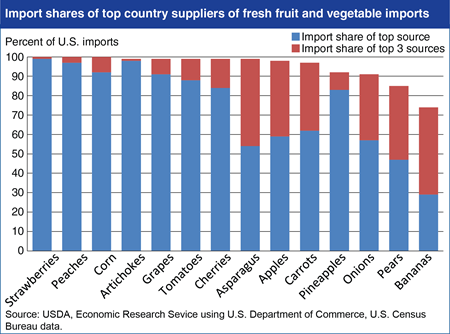
Imported fruits and vegetables account for a growing share of U.S. consumption and in most cases, U.S. imports are sourced from just a few supplying countries. Since 1990, U.S. per capita consumption of fresh fruits and vegetables has held steady, while the share of imports in U.S. fresh fruit consumption has risen from 12 to 34 percent and the import share for vegetables has risen from 10 to 25 percent. Trade has played a role in changing U.S. consumer diets by making produce available outside the traditional U.S. growing season, as well as providing access to a greater variety of produce. Despite the diversity of products available to U.S. consumers, the national sources of these products tend to be relatively concentrated among a few countries, with some variation across commodities. For strawberries, peaches, corn, artichokes, grapes, tomatoes, and cherries, more than 80 percent of imports come from a single country and nearly 100 percent come from just 3 suppliers. Overall, of the 29 imported goods studied by ERS, 18 had a single country supplying more than 80 percent of U.S. imports. Recent ERS research finds that source-country concentration does not appear to be related to U.S. phytosanitary regulations governing fresh fruit and vegetable imports, and may instead arise from market forces such as comparative advantage and specialization. Find more analysis in The Effects of Phytosanitary Regulations on U.S. Imports of Fresh Fruits and Vegetables, released July 2014.
Thursday, May 8, 2014
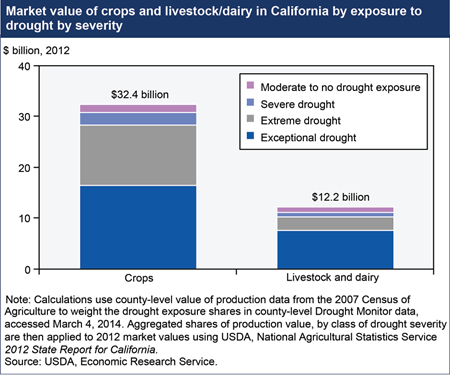
The driest year on record for California, following several prior years of drought, is likely to have an impact on the State’s agricultural production in 2014. On January 17, 2014, the Governor of California declared a drought emergency and as of March 4, over 94 percent of California’s nearly $45 billion agricultural sector was experiencing severe, extreme, or exceptional drought. The livestock sector is more directly exposed to exceptional drought (about 62 percent) than the crop sector (just over 50 percent). Given that much of California’s agricultural production takes place on irrigated land, effects of the drought depend on the cost and availability of water from irrigation in addition to local rainfall. Shortages of irrigation water sourced from snowfall are already evident, and the extent to which growers will be able to offset these reduced surface water supplies by pumping groundwater is uncertain. Find the table underlying this chart and additional analysis in California Drought 2014: Farm and Food Impacts.
Tuesday, January 14, 2014
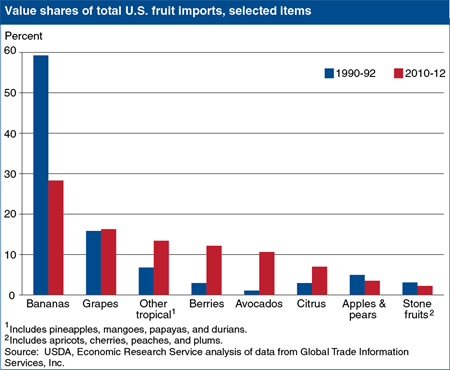
Since the 1990s, the U.S. fresh fruit market has changed, with growing imports of a wider variety of fresh fruit shaping the market. Americans now consume an increased amount and expanded variety of fresh fruit and also benefit from improved year-round availability of fresh fruits. Between 1990-92 and 2010-12, U.S. per capita use of fresh fruit increased more than 12 percent to 104.7 pounds, while the share of fresh fruit use that is imported grew from 36.3 percent to 49 percent. The mix of fresh fruit imports changed substantially during this period—many traditional imports (such as bananas and apples) now account for a smaller share of total fruit imports, while the share for some other items (such as berries and avocados) is rising. Analysis of seasonal patterns indicates that the availability of imports and domestic products are generally complementary, with imports often making up for seasonal shortfalls in domestic fruit production. This chart can be found in Imports Contribute to Year-Round Fresh Fruit Availability, FTS-356-01, released December 30, 2013.
Tuesday, December 17, 2013
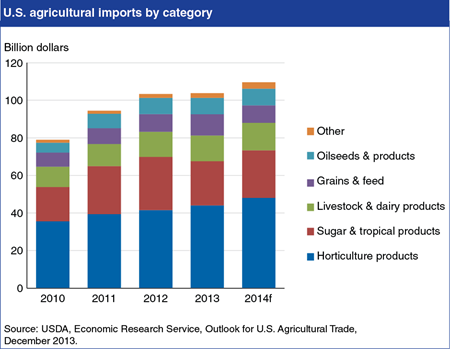
U.S. agricultural imports are forecast at a record $109.5 billion in fiscal year 2014 (October/September), up $5.7 billion from fiscal 2013, with horticultural products continuing to be the primary driver of import growth. The outlook is for relatively stable prices for major imports in fiscal 2014, while stronger U.S. income growth is expected to boost import volumes. Imports of horticultural products are projected to increase by $4 billion in fiscal 2014 as U.S. demand for fresh fruits and vegetables, processed fruit, wine, essential oils, and most other horticultural product categories continues to expand. Horticultural products have accounted for more than 40 percent of U.S. import growth since 2010. Imports from most supplying countries are expected to be higher in fiscal 2014 with Canada, Mexico, and the European Union—which together account for more than 59 percent of U.S. imports—contributing most of the gains. This chart is based on data provided in the Outlook for U.S Agricultural Trade.
Wednesday, July 3, 2013
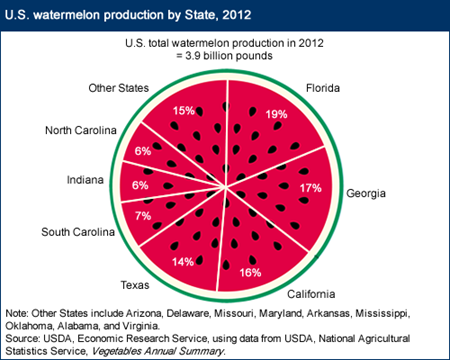
While watermelons are grown across the United States, most production occurs in 4 southern and western States that offer consistently warm temperatures of 70 to 90 degrees Fahrenheit for a growing season that requires up to 3 months. Most commercial production is limited to the South and Southwest. Florida has historically been the top producer of watermelons and accounted for 19 percent of the 3.9 billion pounds of U.S. watermelon production in 2012. Florida and three other States--Georgia, California, and Texas--accounted for two-thirds of U.S. output in 2012. Seedless varieties are in increasing demand, and the share of seedless watermelon in total watermelon shipments in the United States increased from 51 percent in 2003 to 83 percent in 2012. Seedless varieties, typically started as transplants rather than from direct seeding, require more intensive management and are more reliant on bee pollination than seeded varieties, with the cost differences generally visible at the retail level. This chart is updated from Fruit and Tree Nuts Outlook: June 2012.
Friday, February 1, 2013
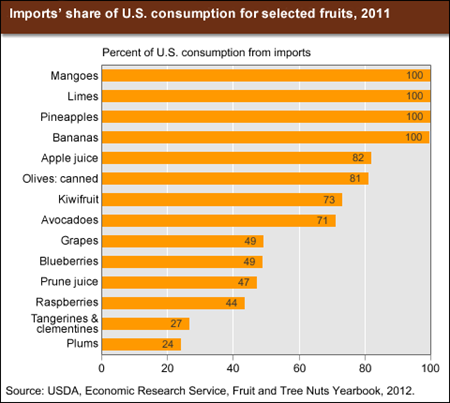
While the United States is one of the largest world producers of fruits and nuts, imports accounted for about 38 percent of the volume of U.S. consumption of fresh, processed, and frozen fruits and tree nuts in 2011. Imports account for important shares of U.S. consumption when products—primarily tropical products—cannot be produced in sufficient quantities domestically, or when imports can complement the seasonality of U.S. production. Bananas, pineapples, mangoes, and limes are examples of major tropical product imports, while grapes, plums, and blueberries are examples of important seasonal imports. Still other imports, such as clementines and raspberries, compete directly with U.S. products. Over the past decade, U.S. edible fruit and nut imports rose dramatically in value due to the growing demand for offseason fruit, an expanding ethnic population, and the interest of consumers in sampling new temperate and tropical fruits. Mexico and Chile dominate U.S. fruit imports, with a combined share of about 40 percent of the U.S. import value in 2011. This chart is updated from one that appears in Fruit and Tree Nut Outlook, December 2012.


