ERS Charts of Note
Subscribe to get highlights from our current and past research, Monday through Friday, or see our privacy policy.
Get the latest charts via email, or on our mobile app for  and
and 
Thursday, October 13, 2016
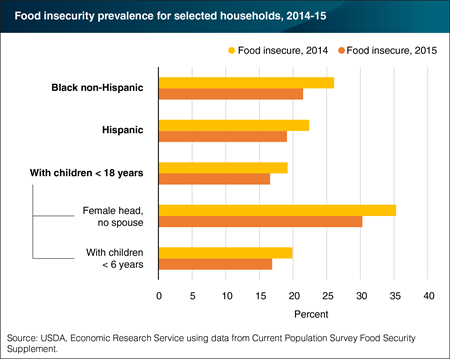
The prevalence of food insecurity in the United States declined from 14.0 percent of households in 2014 to 12.7 percent of households in 2015. Some types of households saw greater declines than others. Food insecurity for both Non-Hispanic Blacks and Hispanics dropped from 2014 to 2015: the former declined from 26.1 to 21.5 percent, while the latter from 22.4 to 19.1 percent. Households with children younger than 18 saw a significant decline in food insecurity—from 19.2 percent in 2014 to 16.6 percent in 2015. Among these households, those headed by single mothers saw their food insecurity prevalence drop from 35.3 percent to 30.3 percent. The prevalence of food insecurity for households with children under 6 years old dropped from 19.9 to 16.9 percent as well. This chart appears in the ERS report, Household Food Security in the United States in 2015, published September 2016.
Tuesday, September 27, 2016
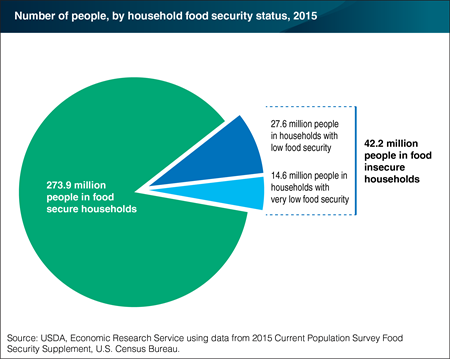
USDA measures food security status at the household level. Food-insecure households were, at times, unable to acquire adequate food for one or more household members due to insufficient money and other resources. Statistics on the number of persons residing in food-insecure households should be interpreted carefully. Within a food-insecure household, different household members may have been affected differently. Some members—particularly young children—may have experienced only mild effects of food insecurity or none at all, while adults were more severely affected. In 2015, 42.2 million people lived in food-insecure households. Out of these individuals, 14.6 million lived in households in the severe range of food insecurity, described as very low food security. Households with very low food security were food insecure to the extent that eating patterns of one or more household members were disrupted and food intake was reduced at some point during the year. The statistics for this chart are from Statistical Supplement to Household Food Security in the United States in 2015, AP-072, released on September 7, 2015.
Thursday, September 8, 2016
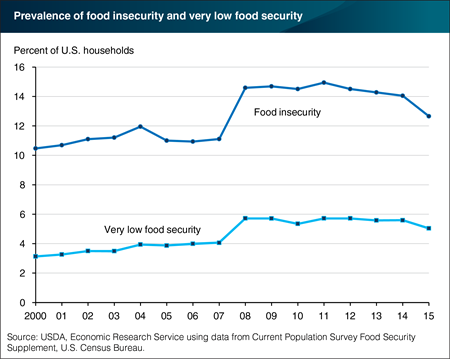
In 2015, 87.3 percent of U.S. households were food secure throughout the year. The remaining 12.7 percent (15.8 million households) were food insecure; they had difficulty at some time during the year providing enough food for all their members due to a lack of resources. The percentage of U.S. households that were food insecure declined from 14.0 percent in 2014. Additionally, in 2015, 5.0 percent of U.S. households (6.3 million households) had very low food security. In this more severe range of food insecurity, the food intake of some household members was reduced and normal eating patterns were disrupted at times during the year due to limited resources. The rate, or prevalence, of very low food security in 2015 declined significantly from that in 2014 (5.6 percent). The 2015 declines in food insecurity and very low food security prevalence were the largest year-to-year changes in these rates since the two rates rose in 2008. This chart appears in the ERS report, Household Food Security in the United States in 2015 , released September 7, 2016.
Wednesday, July 13, 2016
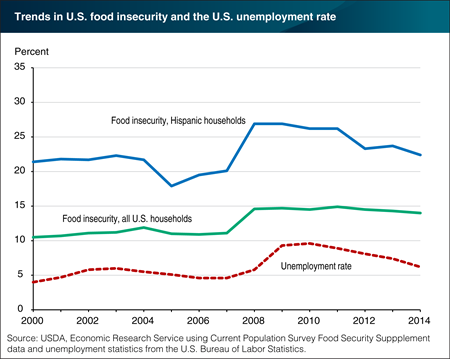
Between 2000 and 2014, food insecurity for U.S. Hispanic households followed U.S. labor market conditions—as measured by the unemployment rate—and was more responsive to employment changes than the Nation as a whole. Food-insecure households have difficulty consistently obtaining adequate food for all household members because of limited economic resources for food. The prevalence of food insecurity among U.S. Hispanic households dropped more sharply than the national prevalence rate in 2005, when unemployment declined after the 2001 recession, and increased more sharply than the national prevalence rate with the onset of the 2007-09 recession. In 2008, food insecurity rose from 20.1 percent to 26.9 percent for Hispanic households and from 11.1 to 14.6 percent for all U.S. households. Similarly, as the economy improved, food insecurity in Hispanic households dropped more quickly than in all U.S. households. Food insecurity declined among all U.S. households from 14.9 percent in 2011 to 14.0 percent in 2014, but Hispanic households had a larger decline—from 26.2 percent to 22.4 percent over the three years. This chart appears in “Food Insecurity and Hispanic Diversity” in the July 2016 issue of ERS’s Amber Waves magazine.
Tuesday, May 17, 2016
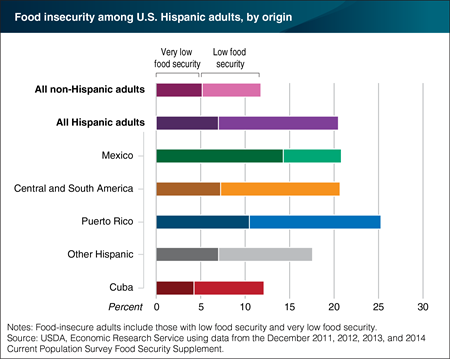
In 2014, 20.6 percent of U.S. Hispanic adults lived in food-insecure households compared to 11.8 percent of non-Hispanic adults. Food-insecure households have difficulty consistently obtaining adequate food for all household members because of limited economic resources for food. The percent of adults living in households with very low food security—a more severe level of food insecurity—was also higher for Hispanics: 7.0 percent compared to 5.2 percent for all U.S. non-Hispanic adults. Food insecurity rates varied among Hispanics of different origin (the individual’s place of birth or that of their parents or ancestors). Food insecurity in 2011-14 was least prevalent among Hispanic adults identifying as having Cuban origin (12.1 percent) and most prevalent among Hispanic adults identifying as Puerto Rican, followed by those with Mexican origins and other Central and South American origins. In 2011-14, 14.3 percent of Hispanic adults identifying as having Mexican origin reported very low food security, compared to 4.2 percent of Hispanic adults of Cuban descent. This chart appears in the ERS report, Food Security Among Hispanic Adults in the United States 2011-2014, released on May 11, 2016.
Monday, February 29, 2016
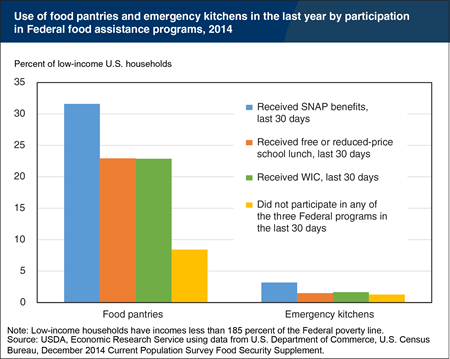
Both Federal and community food and nutrition assistance programs are important resources for low-income households and together make up the Nation’s nutrition safety net. In addition to receiving Federal food and nutrition assistance, some low-income households access community programs such as food pantries and emergency soup kitchens to cope with food hardships. In 2014, nearly one-third of low-income households (with incomes less than 185 percent of the poverty line) that reported receiving Supplemental Nutrition Assistance Program (SNAP) benefits also used a food pantry. About 23 percent of low-income households that received free or reduced-price school lunches or Special Supplemental Nutrition Assistance Program for Women, Infants, and Children (WIC) food packages also used a food pantry. Among low-income households that did not receive SNAP, free or reduced-price school lunch, or WIC, 8 percent used a food pantry. Fewer low-income households ate meals at less commonly available emergency kitchens. In 2014, 3.2 percent of SNAP recipient households also ate a meal at an emergency kitchen. Emergency kitchen use is likely understated because the survey underlying these statistics does not include people who are homeless. The statistics for this chart are from Statistical Supplement to Household Food Security in the United States in 2014, AP-069, September 2015.
Thursday, January 14, 2016
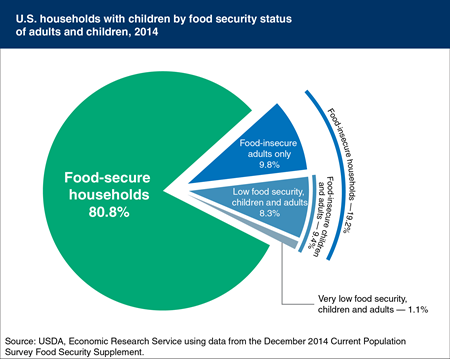
In 2014, 19.2 percent of households with children were food insecure at some time during the year. Parents often are able to maintain normal or near-normal diets and meal patterns for their children, even when the parents themselves are food insecure. In about half of food-insecure households with children in 2014, only adults were food insecure (9.8 percent of households with children); in the rest, children were also food insecure. Thus, both children and adults were food insecure in 9.4 percent of households with children (3.7 million households). In 1.1 percent of households with children (422,000 households), food insecurity among children was so severe that caregivers reported that children were hungry, skipped a meal, or did not eat for a whole day because there was not enough money for food. In some households with very low food security among children, only older children may have experienced the more severe effects of food insecurity while younger children were protected from those effects. This chart appears in the ERS report, Household Food Security in the United States in 2014.
Tuesday, December 29, 2015
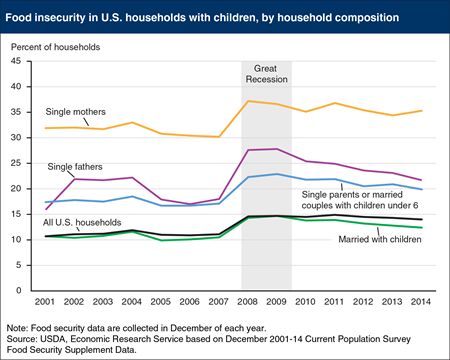
In 2014, 14.0 percent of U.S. households were food insecure. These food-insecure households had difficulty at some time during the year providing enough food for all their members due to a lack of resources. During the Great Recession and its aftermath, the prevalence of food insecurity rose from 11.1 percent in 2007 to 14.9 percent in 2011, before falling as the economy improved and unemployment declined. Food insecurity rates for single-parent households are substantially higher than the national average, especially for single-mother households. In 2014, 35.3 percent of single-mother households and 21.7 percent of single-father households in the United States were food insecure. While food insecurity rates for single-father households and married couples with children have fallen over the last few years, the rate for single-mother households remains high. This chart appears in ERS’s Interactive Chart: Food Security Characteristics, released September 9, 2015.
Thursday, December 17, 2015
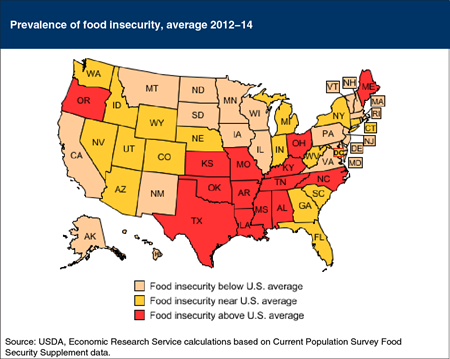
USDA monitors the extent and severity of food insecurity in U.S. households at the national and State levels. Food-insecure households are defined as those that had difficulty at some time during the year providing enough food for all their members due to a lack of resources. Food insecurity rates differ across States due to characteristics of the population, State-level policies, and economic conditions. Estimated prevalence rates of food insecurity during 2012-14 ranged from 8.4 percent in North Dakota to 22.0 percent in Mississippi. Data for 2012-14 were combined to provide more reliable State statistics. The prevalence of food insecurity was higher than the national average of 14.0 percent in 14 States and lower than the national average in 20 States. In the remaining 16 States and the District of Columbia, differences from the national average were not statistically significant. This map appears in ERS’s Ag and Food Statistics: Charting the Essentials.
Tuesday, November 17, 2015
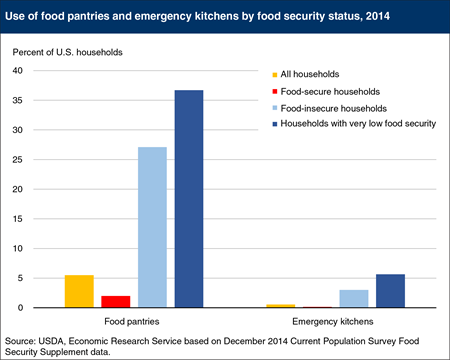
Fourteen percent of U.S. households (17.4 million households) were food insecure in 2014, meaning that at some time during the year, these households were unable to acquire adequate food for one or more household members due to a lack of resources. For a subset of food-insecure households—households with very low food security—food intake of one or more members was reduced and normal eating patterns were disrupted. Households having trouble putting food on the table may rely on emergency food providers, such as food pantries and emergency kitchens. Food pantries distribute unprepared foods for offsite use. Emergency kitchens (sometimes referred to as soup kitchens) provide individuals with prepared food to eat at the site. In 2014, 5.5 percent of all U.S. households acquired emergency food from a food pantry, and less than 1.0 percent obtained meals from emergency kitchens. Food-insecure households were more likely to use these assistance options; more than one in four food-insecure households (27.1 percent) used food pantries in 2014, while 3.0 percent used emergency kitchens. An estimated 36.7 percent of households with very low food security visited food pantries, and 5.7 percent visited an emergency kitchen. The statistics for this chart are from Statistical Supplement to Household Food Security in the United States in 2014, September 2015.
Wednesday, October 21, 2015
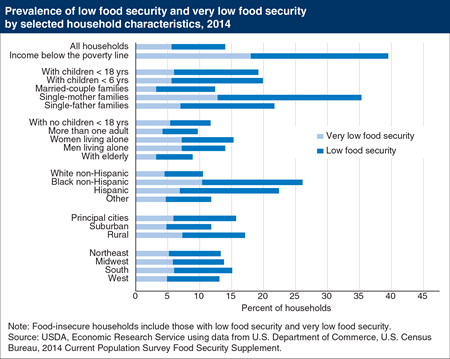
While the majority of U.S. households are food secure, a minority experience food insecurity at times during the year, meaning their access to adequate food for active, healthy living is limited by a lack of money or other resources. Some households experience very low food security, a more severe range of food insecurity, where food intake of one or more household members is reduced and normal eating patterns are disrupted. Food insecurity includes both very low food security and low food security. In 2014, 14.0 percent of all U.S households were food insecure. The prevalence of food insecurity was substantially higher for low-income households; 39.6 percent of households with incomes below the Federal poverty line were food insecure. Among all U.S. households, food insecurity rates were the highest for single-mother households (35.3 percent), and lowest for households with elderly members (8.9 percent). This chart appears in “Commemorating 20 years of U.S. Food Security Measurement” in the October 2015 issue of ERS’s Amber Waves magazine.
Wednesday, September 30, 2015
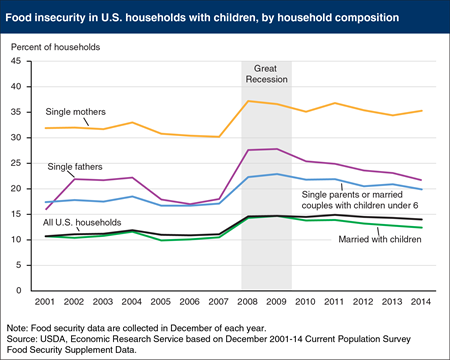
In 2014, 14.0 percent of U.S. households were food insecure. These food-insecure households had difficulty at some time during the year providing enough food for all their members due to a lack of resources. During the Great Recession and its aftermath, the prevalence of food insecurity rose from 11.1 percent in 2007 to 14.9 percent in 2011, before falling as the economy improved and unemployment declined. Food insecurity rates for single-parent households are substantially higher than the national average, especially for single-mother households. In 2014, 35.3 percent of single-mother households and 21.7 percent of single-father households in the United States were food insecure. While food insecurity rates for single-father households and married couples with children have fallen over the last few years, the rate for single-mother households remains high. This chart appears in ERS’s Interactive Chart: Food Security Characteristics, released September 9, 2015.
Wednesday, September 9, 2015
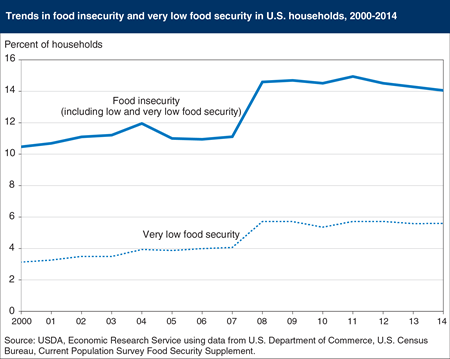
In 2014, 86.0 percent of U.S. households were food secure throughout the year. The remaining 14.0 percent (17.4 million households) were food insecure. Food-insecure households had difficulty at some time during the year providing enough food for all their members due to a lack of resources. While food insecurity has declined from 14.9 percent in 2011, the percent of U.S. households that were food insecure remained essentially unchanged in 2013 and 2014, despite a falling unemployment rate in those years. Higher inflation, especially higher food prices, and the end of increased food assistance benefits from the 2009 American Recovery and Reinvestment Act, strained low-income households’ food budgets and offset the effect of lower unemployment. In 2014, 5.6 percent of U.S. households (6.9 million households) had very low food security, essentially unchanged from 2012 and 2013. In this more severe range of food insecurity, the food intake of some household members was reduced and normal eating patterns were disrupted at times during the year due to limited resources. This chart appears in Household Food Security in the United States in 2014, ERR-194, released September 9, 2015.
Wednesday, October 22, 2014
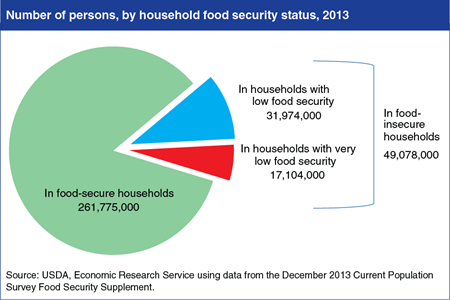
USDA measures food security status at the household level. Food-insecure households were, at times, unable to acquire adequate food for one or more household members because they had insufficient money and other resources for food. Statistics on the number of persons residing in food-insecure households should be interpreted carefully. Within a food-insecure household, different household members may have been affected differently by the household’s food insecurity. Some members—particularly young children—may have experienced only mild effects of food insecurity or none at all, while adults were more severely affected. In 2013, 49.1 million people lived in food-insecure households and 17.1 million of these individuals lived in households in the severe range of food insecurity, described as very low food security. Households with very low food security are those that were food insecure to the extent that eating patterns of one or more household members were disrupted and their food intake reduced at some during the year. The statistics for this chart are from Household Food Security in the United States in 2013: Statistical Supplement, AP-066, released on September 3, 2014.
Tuesday, September 9, 2014
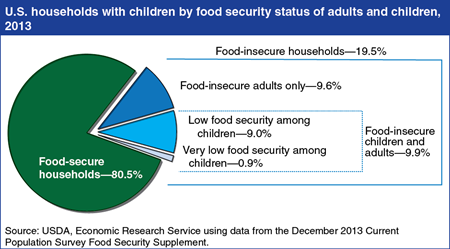
In 2013, 19.5 percent of U.S. households with children were food insecure at some time during the year. Parents often are able to maintain normal or near-normal diets and meal patterns for their children, even when the parents themselves are food insecure. In about half of food-insecure households with children in 2013, only adults were food insecure. But in 9.9 percent of households with children (3.8 million households) both children and adults experienced food insecurity. In 0.9 percent of households with children (360,000 households), food insecurity among children was so severe that caregivers reported that children were hungry, skipped a meal, or did not eat for a whole day because there was not enough money for food. The subset of households with children experiencing these difficult conditions was down from 1.2 percent in 2012. This chart appears in Household Food Security in the United States in 2013, ERR-173, released September 3, 2014.
Thursday, September 4, 2014
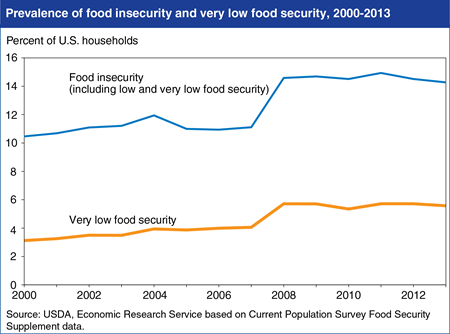
In 2013, 14.3 percent (17.5 million) of U.S. households were food insecure. Households that are food insecure had difficulty at some time during the year providing enough food for all their members due to a lack of resources. The percentage of U.S. households that were food insecure remained essentially unchanged from 2012 to 2013; however, the cumulative decline from 14.9 percent in 2011 was statistically significant. In 2013, 5.6 percent of U.S. households (6.8 million households) had very low food security, essentially unchanged from 2011 and 2012. In this more severe range of food insecurity, the food intake of some household members was reduced and normal eating patterns were disrupted at times during the year due to limited resources. This chart appears in Household Food Security in the United States in 2013, ERR-173, released September 3, 2014.
_450px.png?v=4372.8)
Tuesday, July 8, 2014
USDA monitors the food security of the Nation’s households—their consistent access to adequate food for active healthy lives—through an annual survey. During the 2007-09 recession, food insecurity increased from 11.1 percent of U.S. households in 2007 to 14.6 percent in 2008, and remained near that level through 2012. Since the end of the recession, unemployment rates have fallen, leading researchers to question why food security has not improved with employment. A recent ERS study of the associations of food insecurity with household characteristics and national economic conditions over 2001-12 estimated that declines in the highest monthly unemployment rate, from 10.0 percent in 2009-10 to 8.3 percent in 2012, would have reduced food insecurity by 0.9 percentage point. However, higher annual inflation and larger increases in food prices relative to other goods and services are estimated to have increased the prevalence of food insecurity by 1.1 percentage points. Most of the year-to-year variation in the national prevalence of household food insecurity was associated with changes in these three national economic indicators. The predicted prevalence of food insecurity in 2012 was 14.7 percent, nearly the same as the observed prevalence of 14.5 percent. The statistics in this chart are from the ERS report, Prevalence of U.S. Food Insecurity Is Related to Changes in Unemployment, Inflation, and the Price of Food, released on June 20, 2014.
Monday, May 12, 2014
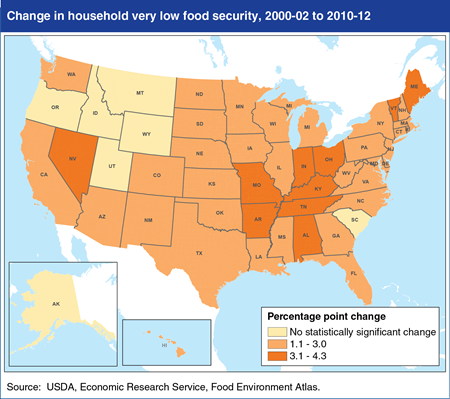
From 2000-02 to 2010-12, the percentage of households with very low food security increased in all but seven States, reflecting the tough economic times of the 2007-09 recession and its lingering effects. Food security is defined as “very low” when the food intake of some household members is reduced and normal eating patterns are disrupted at times during the year because of limited resources. The prevalence of very low food security in 2010-12 (data for 3 years were combined to provide more reliable State-level statistics) ranged from 3.2 percent in Virginia to 8.1 percent in Arkansas, with an average of 5.6 percent across all States. From 2000-02 to 2010-12, increases in very low food security exceeded 4 percentage points in only Maine and Missouri, raising the prevalence of very low food security in those States to 7.1 percent and 7.6 percent, respectively. The magnitude of change does not necessarily indicate the extent of very low food security in 2010-12, because levels were not uniform across States at the beginning of the decade. The data for this map come from ERS’s Food Environment Atlas.
Wednesday, April 23, 2014
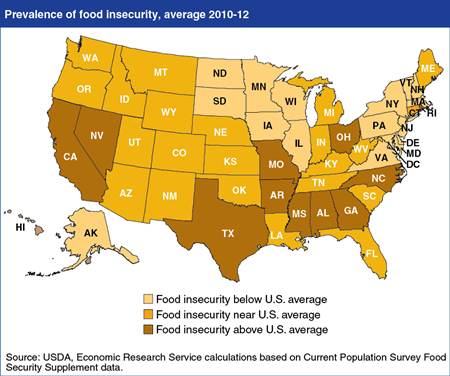
USDA monitors the extent and severity of food insecurity in U.S. households for the Nation and for States. Food-insecure households had difficulty at some time during the year providing enough food for all their members due to a lack of resources. Prevalence rates of food insecurity varied considerably from State to State. Data for 3 years, 2010-12, were combined to provide more reliable statistics at the State level. Estimated prevalence rates of food insecurity during this 3-year period ranged from 8.7 percent in North Dakota to 20.9 percent in Mississippi. Taking into account margins of error of the State and U.S. estimates, the prevalence of food insecurity was higher than the national average of 14.7 percent in 10 States and lower than the national average in 16 States and the District of Columbia. In the remaining 24 States, differences from the national average were not statistically significant. This map is from the Food Security in the U.S. topic page on the ERS website.
Thursday, March 6, 2014
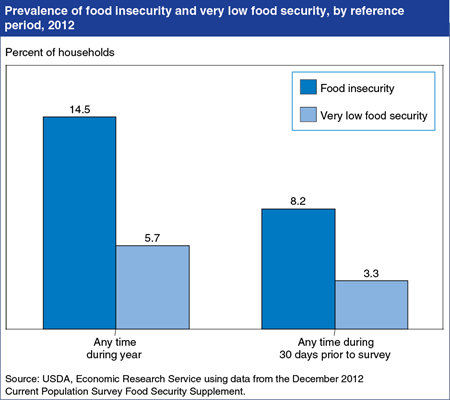
In 2012, 14.5 percent of U.S. households were food insecure some time during the year and 5.7 percent experienced very low food security. Food-insecure households had trouble putting adequate food on the table due to a lack of money and other resources for food. Households in the severe range of food insecurity, described as very low food security, reported reduced food intake and disrupted eating patterns. Questions used to assess households’ food security status ask whether a condition, experience, or behavior occurred at any time in the past 12 months, and households can be classified as having very low food security based on a single, severe episode during the year. Households with very low food security at some time during the year experienced the conditions, on average, in 7 months during the year. An estimated 3.3 percent of U.S. households had very low food security during the 30-day period ending in mid-December 2012. Most households that had very low food security at some time during a month experienced the associated conditions in 1 to 7 days of the month. A version of this chart appears in Household Food security in the United States in 2012, September 2013.


