ERS Charts of Note
Subscribe to get highlights from our current and past research, Monday through Friday, or see our privacy policy.
Get the latest charts via email, or on our mobile app for  and
and 
Wednesday, December 3, 2014
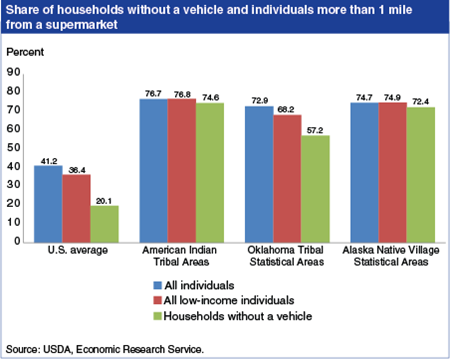
Native Americans living in tribal areas experience high rates of obesity, diabetes, and heart disease that may be due to poor diets. Prior studies cite limited access to supermarkets and other sources of affordable and nutritious foods as contributing factors to less healthful food choices by U.S. consumers. Low population density and limited incomes create disincentives for supermarkets to locate in many tribal areas. In 2010, 74.4 percent of the people in the 545 U.S. tribal areas examined in a recent ERS study lived more than 1 mile from a supermarket, compared with 41.2 percent of the U.S. population. Similarly, among low-income individuals, shares were higher for tribal populations than the national average. Regular access to a car can make traveling to supermarkets easier. However, the share of tribal households without access to a vehicle who lived more than 1 mile from a supermarket ranged from 57.2 to 74.6 percent, versus the 20.1-percent U.S. average. This chart appears in the ERS report, Measuring Access to Healthful, Affordable Food in American Indian and Alaska Native Tribal Areas, released on December 1, 2014.
Monday, November 10, 2014
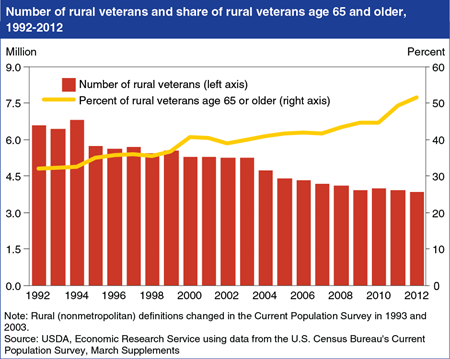
Nearly 4 million veterans resided in rural (nonmetropolitan) America in 2012. They are a rapidly aging and increasingly diverse group of men and women who comprise over 10 percent of the rural adult population despite their persistently declining numbers; the number of veterans living in rural areas declined from 6.6 million in 1992 to 3.8 million in 2012. A drop in the size of the active military population since 1990, from 3 million to roughly 1.4 million, and natural decrease due to aging (over half of rural veterans were age 65 or older in 2012, compared to 18 percent of the nonveteran rural population) means the downward trend in the number of rural veterans will likely continue for many years. Whether due to their military service or because of their age profile, over 20 percent of rural, working-age veterans report disability status compared with 11 percent of nonveterans. Taken together, their older age and higher incidence of disabilities make the well-being of rural veterans, as a group, increasingly dependent on access to medical care in rural areas. This chart comes from Rural Veterans at a Glance, EB-25, November 2013.
Thursday, October 23, 2014
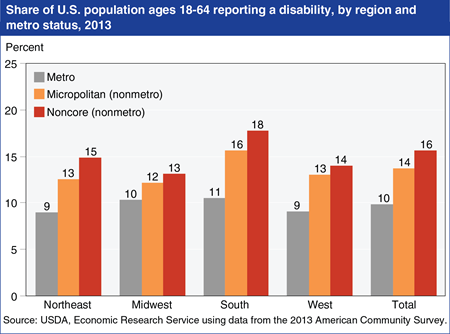
Data from the 2013 American Community Survey show that the more rural an area (micropolitan counties with an urban core population of 10,000 to 49,999 and nonmetropolitan noncore counties with an urban population less than 10,000), the higher its share of residents with self-reported disabilities. Survey respondents ages 18 to 64 in the civilian nonistitutionalzed population were asked if they had serious difficulty with hearing, vision, cognitive ability, walking or climbing stairs, self-care, and independent living. Those who responded that they had difficulty with one or more of these conditions were reported to have a disability. Urban areas (metropolitan counties with an urban core population of 50,000 or more) had the lowest disability rates. The highest disability rates were found in the micropolitan and noncore South, while the Midwest had the lowest rural disability rates. Contributing negatively to the health conditions of rural residents are their lower average socioeconomic status, higher incidence of both smoking and obesity, lower levels of physical activity, older average age, and higher risks of workplace hazards. And in areas losing population, as is true of many rural areas, if the disabled are less likely to migrate, disability rates will increase over time. This chart updates one found in the ERS report, Health Status and Health Care Access of Farm and Rural Populations, EIB-57, August 2009.
Friday, May 23, 2014
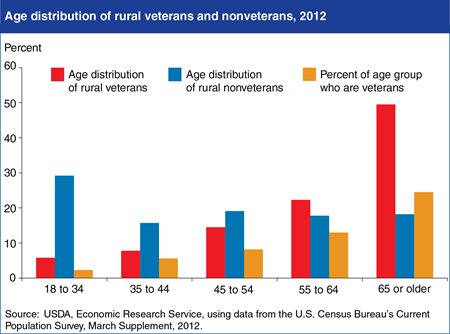
Nearly 4 million veterans reside in rural America (defined here as residents of nonmetropolitan counties). Rural veterans are an aging and increasingly diverse group of men and women who comprise nearly 11 percent of the rural adult population, although their numbers are consistently declining. The share of rural veterans differs by age, ranging from less than 3 percent of 18- to 34-year-olds up to 25 percent of those aged 65 and older. The age distribution of rural veterans tends to be older than nonveterans; nearly half of rural veterans were age 65 or older in 2012, compared with only 18 percent of rural nonveterans. The aging of the rural veteran population is largely due to the fact that a smaller share of the population now serves in the military than in the past. For instance, nearly 20 percent of American men served in the military during World War II, compared to less than 1 percent today. This chart comes from Rural Veterans at a Glance, EB-25, November 2013.
Friday, March 14, 2014
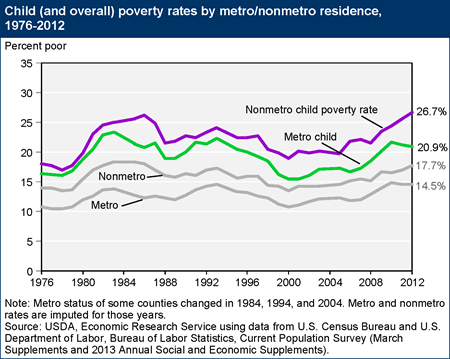
Like the overall poverty rate, child poverty in nonmetro (rural) areas of the country has historically been higher than in metro (urban) areas. In 2012, nonmetro child poverty increased to 26.7 percent—its highest level in nearly 3 decades—while the metro rate declined slightly to 20.9 percent. Poverty among children is an important indicator of the nation’s long-term well-being since child poverty often has an impact that carries throughout a lifetime, particularly if the child lived in poverty at an early age. As with the early 1980s recession, rural children have been disproportionately affected by the recent economic downturn. Child poverty is more sensitive to labor market conditions than overall poverty. Older members of the labor force, including empty nesters and retirees, are less affected by job downturns, and families with children need higher incomes to stay above the poverty line than singles or married couples without children. This chart is found in the ERS topic on Rural Poverty & Well-being.
Thursday, January 30, 2014
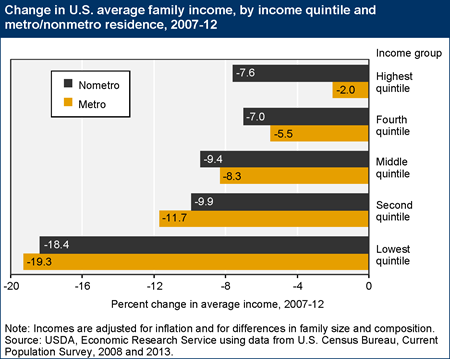
According to U.S. Census data, income inequality has been growing in the U.S. since 1968. Income changes since the onset of the 2007-09 recession demonstrate a continuation of this trend. Average family income fell for all income quintiles between 2007 and 2012, but it fell at a higher rate among lower-income families. In 2012, the average income of the 20 percent of families with the lowest incomes was nearly 20 percent below its 2007 level, reflecting persistently high unemployment rates and declining wages in many lower-income occupations. Income declines were generally smaller at higher income levels, particularly among metro residents, where average income for the highest income quintile increased since 2010 (not shown in graph). By contrast, average incomes among high-income nonmetro families continued to fall during 2010-12. The net effect of these changes was an increase in income inequality over the period, most noticeably in metro areas. This chart is an update of one found in Rural America At A Glance, 2012 Edition, EB-21, December 2012.
Wednesday, January 22, 2014
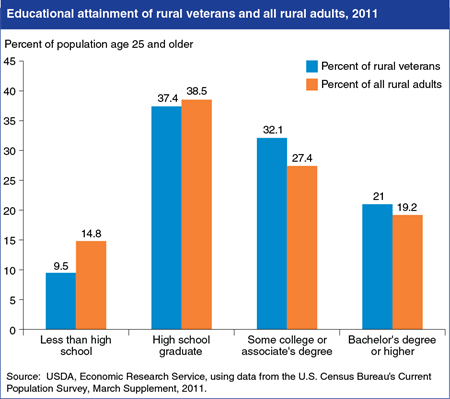
The current military recruitment standard requiring a high school diploma or equivalent (in most cases) explains the much lower percentage of high school dropouts among rural veterans—9.5 percent compared with nearly 15 percent among all rural adults. In addition, about 53 percent of veterans living in rural counties in 2011 had completed at least some formal education beyond high school, including 21 percent who earned a bachelor’s degree or higher (compared with 19 percent for all rural adults). Higher educational attainment may help explain some of the economic advantage enjoyed by rural veterans—in 2011, 6 percent of rural veterans were living at or below the poverty line, compared to 15 percent of all rural adults. This chart is found in the ERS report, Rural Veterans At A Glance, EB-25, November 2013.
Thursday, December 19, 2013
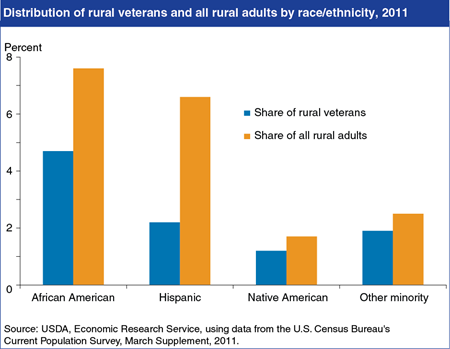
Between 1992 and 2011, the share of rural veterans representing racial-ethnic minorities increased from 6 to 10 percent. Despite this increase, rural minorities remain under-represented relative to their 18.4-percent share of the adult rural population. For example, while Hispanic men and women accounted for 7 percent of the rural population in 2011, they represented only about 2 percent of rural veterans that year. Rapid population growth in the 1980s and 1990s among rural Hispanics was led by young-adult job seekers, mostly foreign-born—these newcomers were typically less inclined to volunteer for military service and were less likely to meet the military’s enlistment requirements. Rural Hispanic immigrants have been aging into family formation, settling into permanent residence, and raising children who may be more inclined to consider and qualify for military service. African Americans and Native Americans also account for a lower share of rural veterans relative to their share of the rural population, although the gap is less pronounced. This chart is found in the ERS report, Rural Veterans At A Glance, EB-25, November 2013.
Wednesday, December 11, 2013
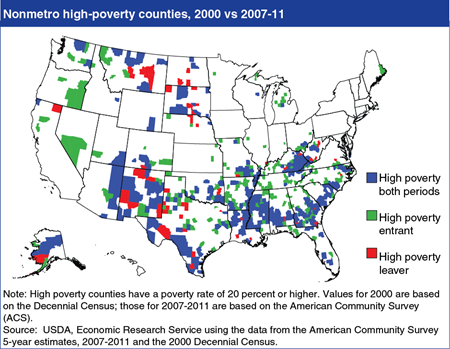
The national poverty rate (based on pre-tax income of less than $23,492 for an average family of four) was 15.0 percent in 2012; the rate was 17.7 percent in nonmetro areas and 14.5 percent in metro areas. High-poverty counties—those with a poverty rate of 20 percent or higher—are often geographically clustered. During 2007-11, there were 703 high-poverty counties in the United States; 571 were nonmetro, mostly in the South and Southwest. Most newly-classified rural high-poverty counties are located adjacent to clusters of historically high-poverty counties, but some were outside these clusters, mainly in areas with substantial losses in the real estate market and manufacturing employment between 2006 and 2009. This map is found in Rural America at a Glance, 2013 edition, released November 2013.
Wednesday, November 20, 2013
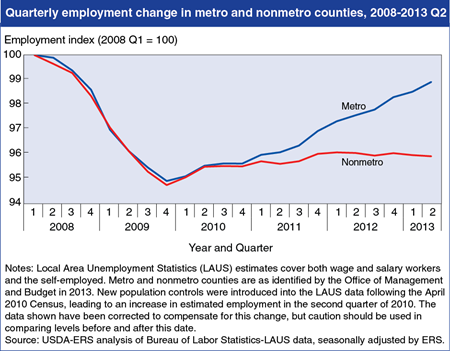
Employment fell by roughly 5 percent in both rural and urban areas during the Great Recession of 2007-09. In 2010, the first year of the economic recovery, metro and nonmetro employment levels grew at comparable rates. Since the start of 2011, however, net job growth in nonmetro areas has been near zero while employment in metro counties has grown at an annual rate of 1.4 percent. The stagnation in nonmetro job growth overlaps with the first recorded period of nonmetro population loss, between 2010 and 2012, which was driven by a decrease in net migration to rural areas. This lack of population growth, combined with a falling labor force participation rate, has permitted the nonmetro unemployment rate to fall slowly but steadily despite the lack of employment growth. This chart is found in Rural America at a Glance, 2013 Edition, released November 2013.
Friday, November 8, 2013
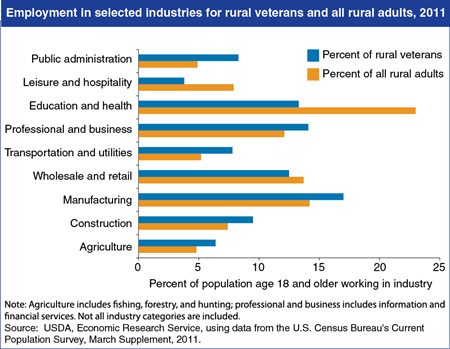
Employment challenges facing recent military veterans are similar to those faced by all new civilian labor force entrants. In addition to these challenges, veterans also face higher rates of disability. The practical skills recent veterans have acquired are often superior to those of their nonveteran peers. As a result, the positive economic impacts veterans are likely making in rural America once they find work and start their careers can be seen in employment differences by industry. Rural veterans were more likely than rural nonveterans to be employed in higher-skilled, higher-paying industries in 2011, including manufacturing and professional and business services. While lower-paying industries such as education and health services, and leisure and hospitality (hotels, restaurants, etc.) employed over 30 percent of rural nonveteran workers in 2011, only 17 percent of rural veterans worked in these service industries. Just over 6 percent of rural veterans worked in agriculture (including fishing, forestry, and hunting). This chart is found in the ERS report Rural Veterans At A Glance, EB-25, November 2013.
Tuesday, November 5, 2013
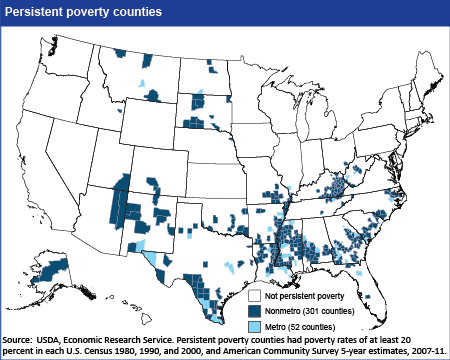
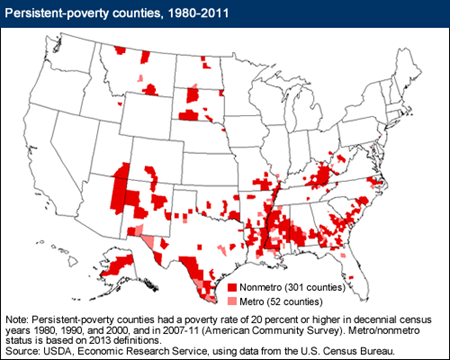
An important dimension of poverty is time—an area that has a high level of poverty this year, but not next year, is likely better off than an area that has a high level of poverty in both years. To shed light on this aspect of poverty, ERS has defined counties as being persistently poor if 20 percent or more of their populations were living in poverty over the last 30 years (measured by the 1980, 1990 and 2000 decennial censuses and 2007-2011 American Community Survey 5-year estimates). Using this definition, there are currently 353 persistently poor counties in the United States, comprising 11.2 percent of all U.S. counties. The large majority (301, or 85.3 percent) of the persistent-poverty counties are nonmetro, accounting for 15.2 percent of all nonmetro counties. Persistent poverty also demonstrates a strong regional pattern, with nearly 84 percent of persistent-poverty counties in the South, comprising more than 20 percent of all counties in the region. This map is found in Geography of Poverty, in the Rural Poverty and Well-being topic page on the ERS website, updated September 2013.
Wednesday, October 23, 2013
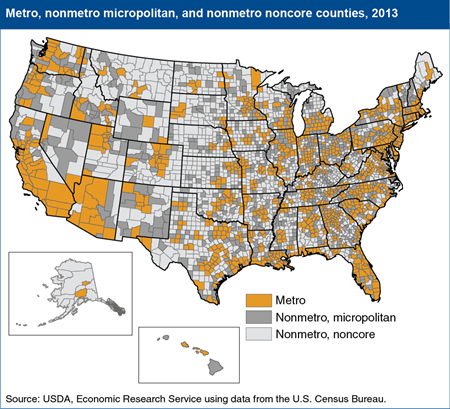
Metropolitan (metro) counties have fared better than both micropolitan and noncore counties (shown in the map) following the 2007-09 recession. ERS researchers generally define “rural” as micropolitan and noncore counties (together referred to as nonmetropolitan or nonmetro counties), and “urban” as metropolitan or metro counties. During the National economic recovery period between 2010 and 2012, employment increased by 2.5 percent in metro counties, compared with 1.1 percent in micropolitan, and 0.5 percent in noncore counties. Metro counties are densely settled counties with an urban core population of 50,000 or more, and outlying counties tied to the central core by labor force commuting. Micropolitan counties are similar to metro counties, but include an urban core with a population between 10,000 to 49,999, and outlying counties tied to the core by commuting. Noncore areas are the remaining counties that are neither metro nor micropolitan. As of February 2013, the Office of Management and Budget identified 1,167 metro counties, 641 micropolitan counties, and 1,335 noncore counties. This map is found in the ERS topic page on Rural Classifications, updated in May 2013.
Thursday, September 19, 2013
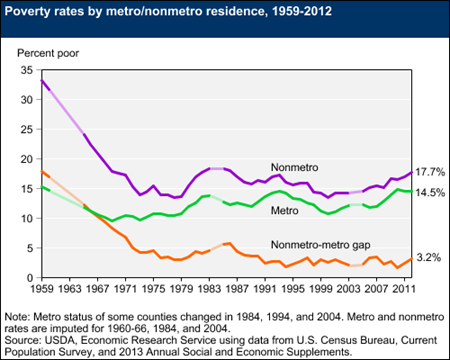
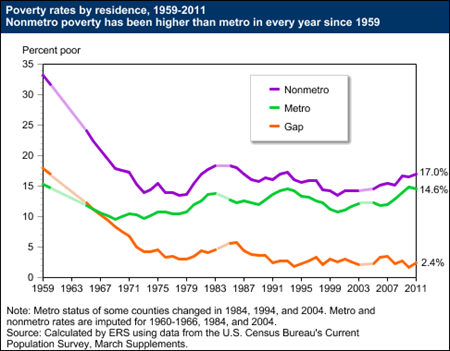
Nonmetro areas have had a higher rate of poverty than metro areas since the 1960s, when poverty rates were first officially recorded. Over time, the difference between nonmetro and metro poverty rates has fluctuated, falling from an average difference of 4.5 percentage points in the 1980s to a record low of 1.6 percentage points in 2010, as the metro poverty rate rose faster than the nonmetro rate over 2006-10. Because of the uneven economic recovery following the 2007-09 economic recession, nonmetro poverty rose slightly in 2011 (to 17.0 percent) and again in 2012 (to 17.7 percent), while the poverty rate fell slightly in metro areas. As a result, the nonmetro poverty rate is at its highest level since 1986 and is now 3.2 percentage points higher than the metro poverty rate. This chart is an updated version of one found in the Rural Poverty and Well-Being topic page on the ERS website.
Monday, July 29, 2013
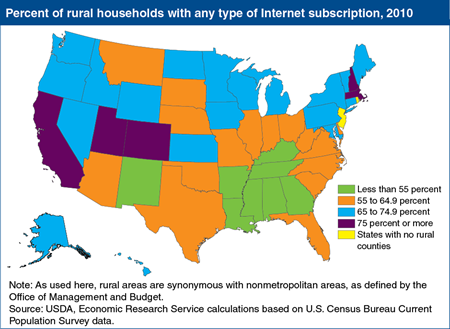
By 2010, 73 percent of U.S. urban households had home subscriptions to the Internet, compared with only 62 percent of rural households and farms, according to Current Population Survey (CPS) data. Rural Internet usage, however, is not uniform across the country. On average, rural households in the Northeast and West are more likely to have some form of inhome access to the Internet, while households in the rural South are the least likely to subscribe. The regional disparity in subscriber rates reflects, to some degree, demographic differences such as income, education, and age. Among rural households that use the Internet, broadband adoption rates (not shown here) are lowest in Appalachia and in several areas—such as Michigan and South Carolina—that experienced the highest unemployment rates during the Great Recession of 2007-09. Rural broadband adoption rates are uniformly below corresponding statewide urban rates. This map is found in the ERS report, Rural Broadband At A Glance, 2013 Edition, June 2013.
Thursday, July 25, 2013
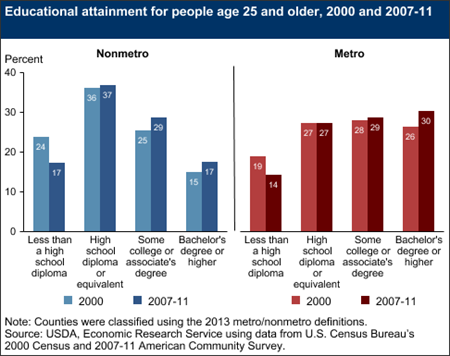
Historically, rural (nonmetro) areas in the United States have lagged metro areas in educational attainment, but nonmetro areas are catching up over time. In the decade following the 2000 Census, the percentage of the rural population with less than a high school education dropped significantly, and is now only slightly higher than in urban areas. Meanwhile, high school completion, college attendance, and college completion rates in nonmetro areas all rose during the 2000s. However, nonmetro areas still face a large gap compared with metro areas in the share of adults with a bachelor’s degree or higher—17.4 percent versus 30.2 percent in 2007-11. At least part of this gap reflects the higher pay that highly educated workers often can earn in metropolitan labor markets. This chart updates one found in the Rural Employment and Education topic page.
Friday, July 19, 2013
An important dimension of poverty is time. An area that has a high level of poverty this year, but not next year, is likely better off than an area that has a high level of poverty in both years. To shed light on this aspect of poverty, ERS has defined counties as being persistently poor if 20 percent or more of their populations were living in poverty over the last 30 years (measured by the 1980, 1990, and 2000 decennial censuses and the 2007-11 American Community Survey). Using this definition, there were 353 persistently poor counties in the United States. The large majority (301) of the persistent-poverty counties were nonmetropolitan (nonmetro) and exhibited a strong regional pattern. There are no nonmetro persistent-poverty counties in the Northeast, 29 nonmetro persistent-poverty counties in the Midwest, and 20 in the West. The remaining 252 nonmetro persistent-poverty counties are in the South, comprising just over 26 percent of the total Southern nonmetro population. This map is one of the county classifications found in the Atlas of Rural and Small Town America on the ERS website.
Friday, May 24, 2013
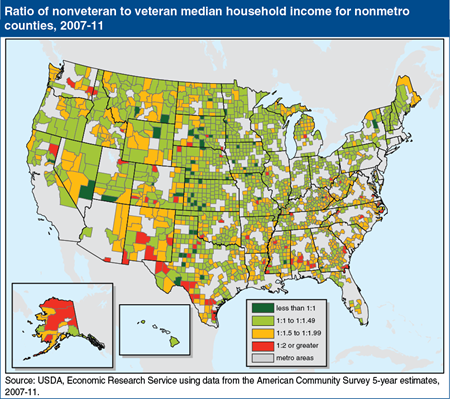
Perhaps because veterans tend to be older males, or because of the skills, experiences, and contacts acquired during military service, rural veterans had median incomes that were nearly 50 percent higher than rural nonveterans, based on 2007-11 data. Median incomes of veterans were at least twice those of nonveterans (income ratio of 1:2 or greater) in 79 rural counties, predominantly in the South and in high-poverty areas. Rural veteran income premiums tended to be high in counties dependent on public sector employment, whereas the incomes of rural veterans tended to be about average in manufacturing-dependent counties. There were also a handful of counties (54 or 2.7 percent of nonmetro counties) where rural veterans tended to earn less than nonveterans (income ratio less than 1:1). They were primarily farming-dependent counties where poverty rates tend to be low. This map is based on data found in the Atlas of Rural and Small Town America, on the ERS website.
Friday, May 10, 2013
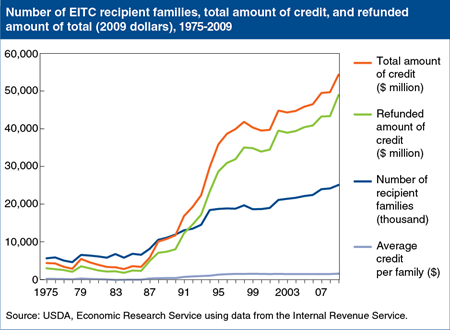
The earned income tax credit (EITC) was enacted in 1975 to reduce the burden of Social Security taxes on low-income workers and to encourage them to seek employment rather than welfare benefits. The amount of the credit depends upon the number of qualifying children in the household and the level of earned and adjusted gross income. As a refundable tax credit, the EITC results in lower tax liabilities for qualifying low-income households that owe Federal income taxes and cash payments to those owing no taxes. The EITC has expanded over the past two decades and represents an increasing share of total Federal support to low-income households. In 2009, the credit provided roughly $55 billion to over 25 million low-income workers and their families. Rural households have historically had lower incomes and higher poverty rates than urban households. As a result, a disproportionately large share of rural taxpayers benefit from the EITC. In 2008, 21.6 percent of rural taxpayers received EITC benefits, compared with 16.9 percent of urban taxpayers. This chart comes from the ERS report, The Potential Impact of Tax Reform on Farm Businesses and Rural Households, EIB-107, February 2013.
Tuesday, March 26, 2013
Nonmetro areas have had a higher rate of poverty than metro areas since the 1960s when poverty rates were first officially recorded. Over time, however, the difference between nonmetro and metro poverty rates has generally narrowed, falling from an average difference of 4.5 percentage points in the 1980s to a record low of 1.6 percentage points in 2010, as the metro poverty rate rose faster than the nonmetro rate over 2006-10. Because of the uneven economic recovery following the 2007-09 economic recession, nonmetro poverty rose slightly in 2011, to 17 percent, while the poverty rate fell slightly in metro areas. As a result, the nonmetro poverty rate is now 2.4 percentage points higher than the metro poverty rate. This chart is found in the Rural Poverty and Well-Being topic page on the ERS website, updated March 2013.


