ERS Charts of Note
Subscribe to get highlights from our current and past research, Monday through Friday, or see our privacy policy.
Get the latest charts via email, or on our mobile app for  and
and 
Monday, November 10, 2014
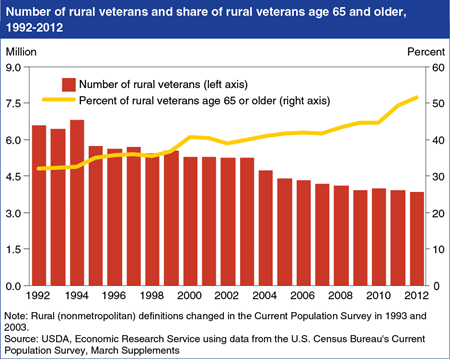
Nearly 4 million veterans resided in rural (nonmetropolitan) America in 2012. They are a rapidly aging and increasingly diverse group of men and women who comprise over 10 percent of the rural adult population despite their persistently declining numbers; the number of veterans living in rural areas declined from 6.6 million in 1992 to 3.8 million in 2012. A drop in the size of the active military population since 1990, from 3 million to roughly 1.4 million, and natural decrease due to aging (over half of rural veterans were age 65 or older in 2012, compared to 18 percent of the nonveteran rural population) means the downward trend in the number of rural veterans will likely continue for many years. Whether due to their military service or because of their age profile, over 20 percent of rural, working-age veterans report disability status compared with 11 percent of nonveterans. Taken together, their older age and higher incidence of disabilities make the well-being of rural veterans, as a group, increasingly dependent on access to medical care in rural areas. This chart comes from Rural Veterans at a Glance, EB-25, November 2013.
Thursday, October 2, 2014
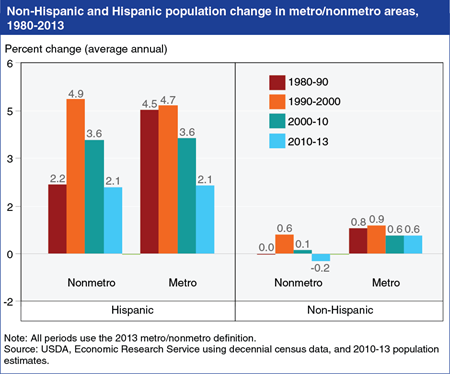
Between 1990 and 2013, the Hispanic population in the United States (including both foreign and U.S. born) increased from 22.4 million to 54.1 million, growing 142 percent compared with 16 percent for the non-Hispanic population for the same period. Prior to 1990, growth of the Hispanic population was concentrated in larger cities and in relatively few States, mostly in the Southwest. The rural (nonmetro) Hispanic population grew at less than half the rate seen in urban (metro) areas during the 1980s—2.2 percent per year compared with 4.5 percent. Since 1990, however, growth in the Hispanic population has been widespread, occurring in metropolitan and rural communities in every region of the country; average annual population growth rates have been identical for metro and nonmetro Hispanic populations since 2000. However, both rural and urban areas have experienced lower rates of growth among Hispanics since the recession, due in part to a decline in immigration. Rural population growth remains above 2 percent per year for Hispanics, in marked contrast to population decline among non-Hispanic populations, averaging -0.2 percent per year since 2010. This chart updates one found in the ERS newsroom feature, Immigration and the Rural Workforce.
Wednesday, August 27, 2014
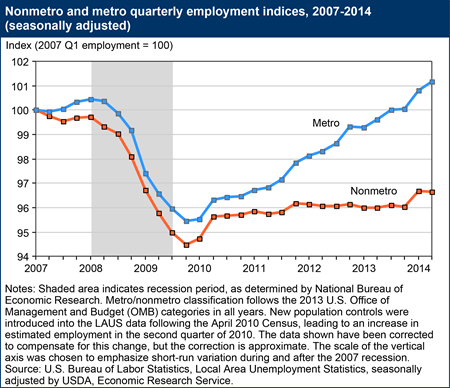
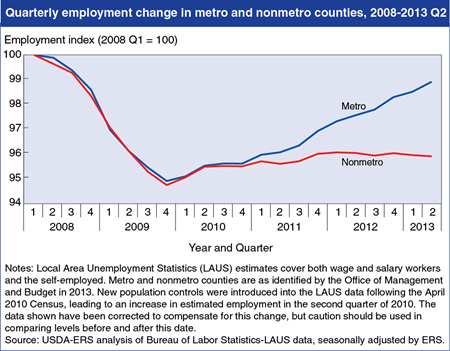
In December 2007, six years of economic growth ended as the U.S. economy entered the most severe recession since the Great Depression. Despite starting earlier and falling slightly more, employment trends in rural (nonmetro) areas followed much the same pattern as urban (metro) areas during the recession and the beginning of the economic recovery. Beginning in 2011, nonmetro employment grew much more slowly than urban employment, and growth fell to zero or slightly below throughout 2012 and 2013. Preliminary data for 2014 show an uptick in nonmetro employment; however, at the end of the second quarter of 2014, nonmetro employment remained 3.5 percent below its pre-recession peak while metro employment exceeded pre-recession levels. A lower (often negative) rate of population growth, and an older, less-educated work force have all contributed to sluggish employment growth in nonmetro counties since the end of the 2007/09 recession. This chart updates data presented in the ERS report, Rural Employment Trends in Recession and Recovery, ERR-172, August 25, 2014.
Friday, May 23, 2014
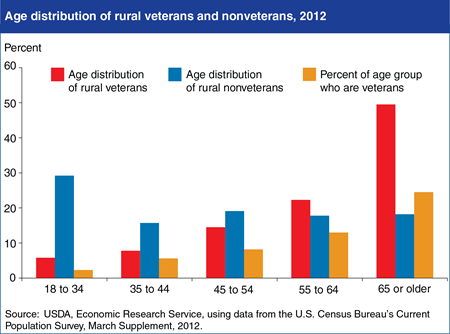
Nearly 4 million veterans reside in rural America (defined here as residents of nonmetropolitan counties). Rural veterans are an aging and increasingly diverse group of men and women who comprise nearly 11 percent of the rural adult population, although their numbers are consistently declining. The share of rural veterans differs by age, ranging from less than 3 percent of 18- to 34-year-olds up to 25 percent of those aged 65 and older. The age distribution of rural veterans tends to be older than nonveterans; nearly half of rural veterans were age 65 or older in 2012, compared with only 18 percent of rural nonveterans. The aging of the rural veteran population is largely due to the fact that a smaller share of the population now serves in the military than in the past. For instance, nearly 20 percent of American men served in the military during World War II, compared to less than 1 percent today. This chart comes from Rural Veterans at a Glance, EB-25, November 2013.
Wednesday, May 14, 2014
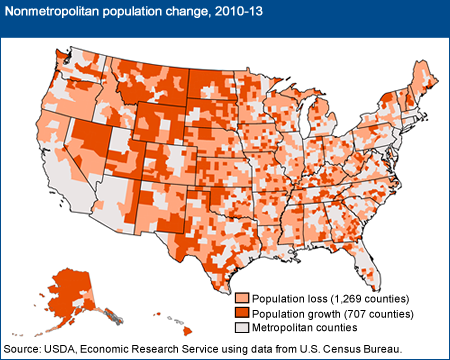
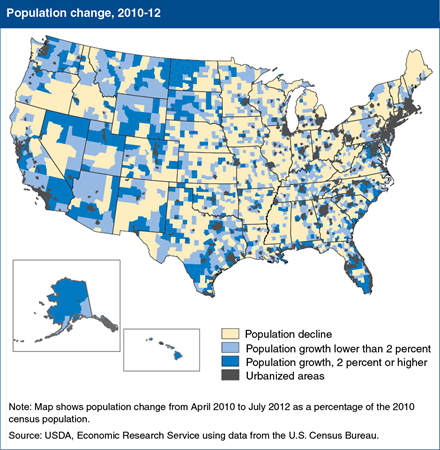
Population change is varied across rural and small-town America. Since 2010, over 1,200 rural (nonmetropolitan) counties have lost population, with declines totaling nearly 400,000 people. At the same time, the population of just over 700 rural counties grew, together adding just over 300,000 residents. New regional patterns of growth and decline emerged in recent years. Areas of population decline appeared for the first time in the eastern United States, including New England, the North Carolina-Virginia border, and southern Ohio. Falling birth rates, an aging rural population, and a declining manufacturing base contributed to population downturns in these regions. In the Mountain West, population growth also slowed considerably, and in some cases turned negative, for the first time in decades, affecting numerous counties in western Colorado and Wyoming, central Oregon, and northern Idaho. In contrast, an energy boom has spurred population growth in sections of the northern Great Plains that had previously experienced long-term population declines. This map is found in the ERS topic page on Rural Population and Migration, updated April 2014.
Monday, April 7, 2014
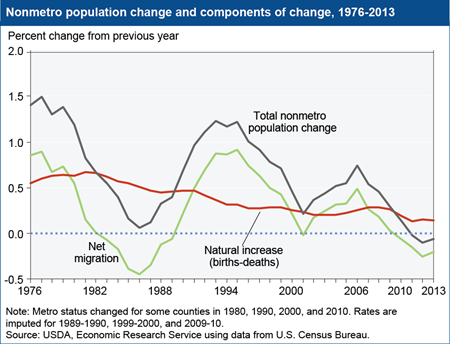
Rural population (determined by nonmetropolitan status) declined for the third year in a row according to population estimates released last week by the U.S. Census Bureau. While hundreds of individual counties have lost population over the years, especially in remote or sparsely-settled regions, this marks the first period of population decline for rural (nonmetro) areas as a whole. Population declines stem from a combination of fewer births, more deaths, and changing migration patterns. Since 2010, the increase in rural population that came from natural change (193,000 more births than deaths) has not matched the decrease in population from net migration (276,000 more people moved out than moved in). While natural change has gradually trended downward over time, net migration rates tend to fluctuate in response to economic conditions. Thus, this period of rural population loss may be short-lived depending on the course of the economic recovery. This chart is found in the ERS topic page on Population and Migration, updated April 2014.
Monday, December 30, 2013
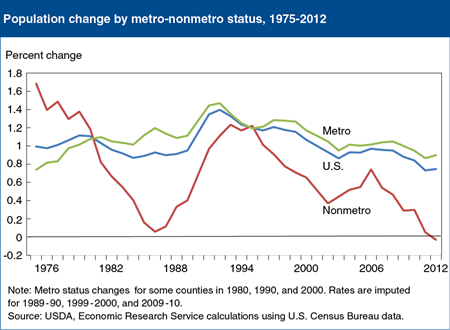
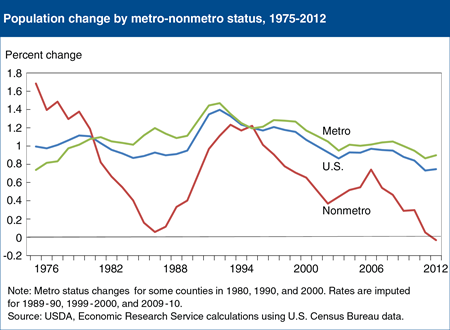
Nonmetro population has grown more slowly than metro population since the mid-1990s and the gap has widened considerably in recent years. Between July 2011 and July 2012, nonmetro population declined for the first time since annual county population estimates were first recorded in the 1960s. Historically, nonmetro population grew because natural increase (more births than deaths) always offset net migration loss (more people moving out than moving in). But falling birth rates and an aging population have steadily dampened the natural increase in nonmetro population over time. Nonmetro net migration rates, which tend to fluctuate in response to economic conditions, last peaked in 2006 just prior to the housing mortgage crisis before falling dramatically. New population estimates are subject to revision, the rate of population decline for this single year is quite small, and the trend may be short-lived. Nonetheless, 2011-12 marks the first year with estimated net migration losses exceeding natural increase in nonmetro areas. This chart is based on County-level Data Sets. Originally published on Tuesday, April 9, 2013.
Wednesday, December 11, 2013
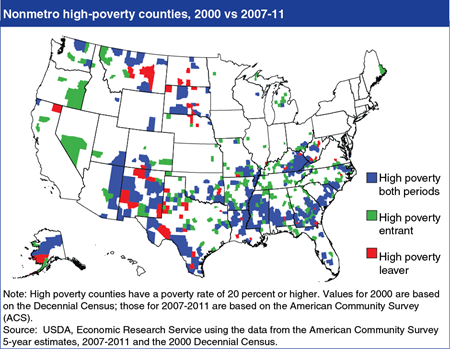
The national poverty rate (based on pre-tax income of less than $23,492 for an average family of four) was 15.0 percent in 2012; the rate was 17.7 percent in nonmetro areas and 14.5 percent in metro areas. High-poverty counties—those with a poverty rate of 20 percent or higher—are often geographically clustered. During 2007-11, there were 703 high-poverty counties in the United States; 571 were nonmetro, mostly in the South and Southwest. Most newly-classified rural high-poverty counties are located adjacent to clusters of historically high-poverty counties, but some were outside these clusters, mainly in areas with substantial losses in the real estate market and manufacturing employment between 2006 and 2009. This map is found in Rural America at a Glance, 2013 edition, released November 2013.
Wednesday, November 20, 2013
Employment fell by roughly 5 percent in both rural and urban areas during the Great Recession of 2007-09. In 2010, the first year of the economic recovery, metro and nonmetro employment levels grew at comparable rates. Since the start of 2011, however, net job growth in nonmetro areas has been near zero while employment in metro counties has grown at an annual rate of 1.4 percent. The stagnation in nonmetro job growth overlaps with the first recorded period of nonmetro population loss, between 2010 and 2012, which was driven by a decrease in net migration to rural areas. This lack of population growth, combined with a falling labor force participation rate, has permitted the nonmetro unemployment rate to fall slowly but steadily despite the lack of employment growth. This chart is found in Rural America at a Glance, 2013 Edition, released November 2013.
Thursday, July 11, 2013
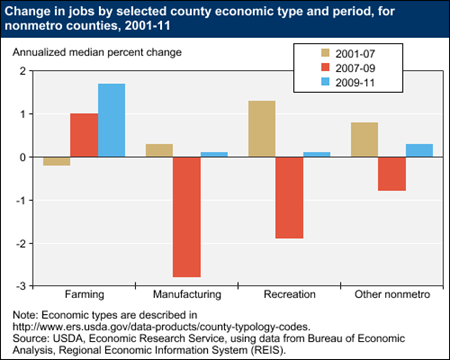
All sectors of the economy were not equally affected by the 2007-09 economic recession and the subsequent recovery. Specialization within local economies has shaped county-to-county differences in recent rural (nonmetro) growth in jobs. Boosted by high farm income and, in some areas, booming gas-extraction activities, farming-dependent counties have seen job growth for the first time in many years, growing during and after the recession. Manufacturing counties, affected by global competition, showed weak job growth in the early 2000s, followed by substantial losses during the recession. Recreation counties, which experienced above-average job growth in 2001-07, lost jobs in 2007-09 as their housing markets collapsed and the recession reduced tourism. Weak postrecession job growth did not bring jobs back to prerecession levels in most nonmetro counties by 2011. County economic types were defined by ERS in 2004 and are scheduled to be updated next year. This chart combines the ERS county typology codes with employment data from U.S. Department of Commerce, Bureau of Economic Analysis.
Tuesday, June 18, 2013
Opportunities for population growth and economic expansion vary widely from one nonmetro county to another, and new regional patterns of growth and decline have emerged in recent years. Spurred by an energy boom, large sections of the northern Great Plains turned around decades of population decline. Population growth slowed considerably in the Mountain West for the first time in decades, affecting numerous counties in western Colorado and Wyoming, central Oregon, northern Idaho, and elsewhere. At the same time, nonmetro population growth switched to decline in 21 Eastern States between 2004-06 and 2010-12. For example, most metro counties in Florida maintained above-average population growth through the recent housing crisis and recession, but nonmetro areas there went from 3-percent growth during 2004-06 to a -0.44-percent decline in the past 2 years. This map is found in the May 2013 issue of Amber Waves magazine.
Wednesday, May 15, 2013
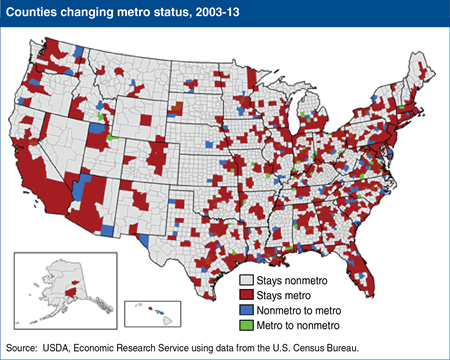
As it has done with every decennial census since 1950, in late February 2013, the Office of Management and Budget announced the latest delineation of metropolitan areas in the United States. ERS uses this delineation as the foundation for its Rural-Urban Continuum Codes and Urban Influence Codes, which further identify each county by size of metro core (for metro counties), or degree of urbanization and proximity to metro areas (for nonmetro counties). Generally, nonmetro counties that grew rapidly over the previous decade are reclassified as metro. In the latest update, 113 nonmetro counties (with just under 5.9 million people) switched to metro status while 36 counties (with just over 1 million people) no longer qualified as metro, resulting in a net nonmetro population "loss" of 4.8 million from reclassification. The 1,976 counties now classified as nonmetro include 15 percent of the U.S. population (46 million people) and 72 percent of the Nation’s land area. This map is found on the ERS topic page, Population & Migration, updated May 2013.
Tuesday, April 9, 2013
Nonmetro population has grown more slowly than metro population since the mid-1990s and the gap has widened considerably in recent years. Between July 2011 and July 2012, nonmetro population declined for the first time since annual county population estimates were first recorded in the 1960s. Historically, nonmetro population grew because natural increase (more births than deaths) always offset net migration loss (more people moving out than moving in). But falling birth rates and an aging population have steadily dampened the natural increase in nonmetro population over time. Nonmetro net migration rates, which tend to fluctuate in response to economic conditions, last peaked in 2006 just prior to the housing mortgage crisis before falling dramatically. New population estimates are subject to revision, the rate of population decline for this single year is quite small, and the trend may be short-lived. Nonetheless, 2011-12 marks the first year with estimated net migration losses exceeding natural increase in nonmetro areas. This chart is based on County-level Data Sets, updated March 2013.
Tuesday, January 8, 2013
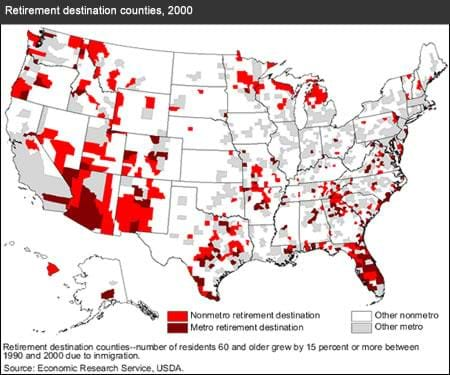
Different types of amenities can attract people to various regions of the United States. Retirees may be attracted to places that have manmade amenities and services such as golf courses, adult education opportunities, and health care facilities, even where natural amenities are limited. The attraction of a low crime rate, low housing costs, social cohesion, and a simpler lifestyle can bring migrants to even remote rural areas. Arizona, New Mexico, and Florida are common destinations for retirees, but other counties throughout the country with a variety of amenities are also popular. A version of this map appeared in "Creating Rural Wealth: A New Lens for Rural Development Efforts" in the September 2012 issue of ERS's Amber Waves magazine.
Friday, December 21, 2012
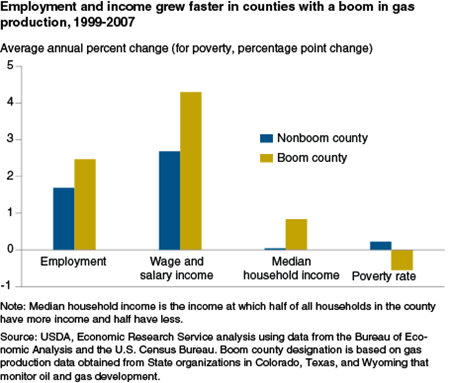
Using hydraulic fracturing—a method of cracking rock by injecting water, sand, and chemicals under high pressure—drilling companies have increased extraction of natural gas from rock formations like shale. The three Western States of Colorado, Texas, and Wyoming saw large increases in gas production in the 2000s, most of which came from such unconventional sources. Not all counties in each State were close enough to the activity to benefit economically from the boom. On average, counties participating in the gas production boom saw a larger percent increase in employment, wage and salary income, and median household income and a larger decrease in the poverty between 1999 and 2007 than counties not participating. Still, for the scale of extraction that occurred in the three States, the number of jobs added to local economies is multiple times below what has been projected for the development of shale gas formations in Texas, Arkansas, Louisiana, and Pennsylvania. This chart appears in the December 2012 edition of Amber Waves magazine.
Monday, December 17, 2012
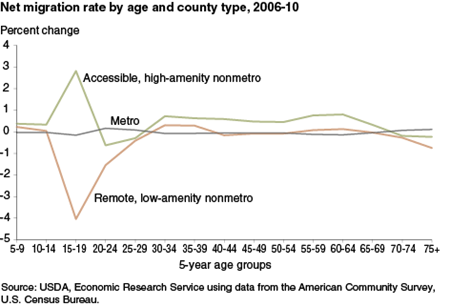
For many decades, most U.S. nonmetro counties experienced significant population loss among young adults, especially in the years immediately following high school graduation. Some of that population loss was offset by net gains among individuals in their late 20s and 30s. While this population pattern does not hold in amenity-rich areas with easy access to urban areas, it continues in remote, low-amenity nonmetro counties (identified based on urban accessibility measures and the ERS Natural Amenities Index). A large share of those moving into these remote areas during their late 20s and 30s are childhood residents returning with spouses and children to their home communities. This chart is found in the December 2012 issue of Amber Waves magazine.
Friday, November 16, 2012
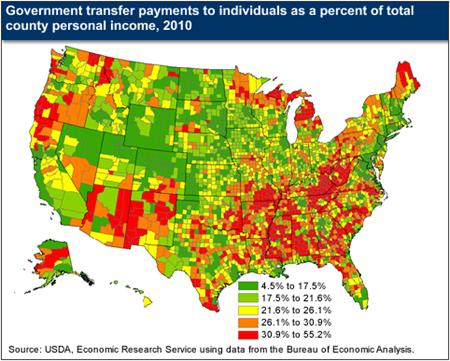
Government transfer payments (such as medical benefits, retirement and disability insurance, and nutrition assistance programs) comprise a large share of personal income for both nonmetro and metro residents. Transfer payments to individuals accounted for 25.6 percent of total nonmetro personal income and 16.8 percent of metro personal income, in 2010. Of the $2.2 trillion in Federal, State, and local government personal transfer payments to individuals in 2010, $415 billion went to nonmetro residents and $1.8 trillion went to metro residents. The counties with the highest percentage of total income from government transfer payments in 2010 were concentrated in Appalachia and the Mississippi Delta. The top three nonmetro counties with the highest percentage of total income from government transfer payments were located in eastern coal fields of Kentucky. These counties have high levels of disability payments along with very high unemployment and poverty rates. This chart is from the Rural Poverty & Well-Being topic page on the ERS website.
Tuesday, September 11, 2012
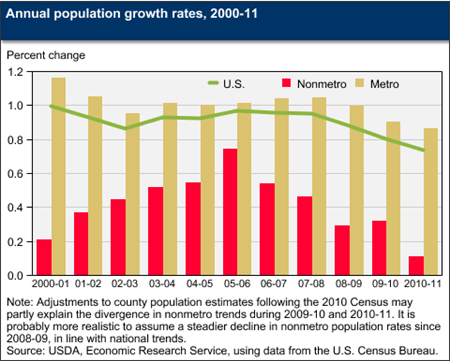
Nonmetro America had just over 51 million residents in July 2011, a 4.5 percent increase in population over the past decade. The rate of population growth in nonmetro America slowed dramatically after the onset of the housing mortgage crisis in 2006 and the recession a year later. Over 250,000 people were added to the nonmetro population between July 2005 and July 2006, compared with an average below 150,000 per year since then. This partially reflects a decline in the rate of growth for the U.S. population as a whole, as a result of lower immigration rates since 2007. However, nonmetro counties have also been affected by lower rates of natural increase and fewer in-migrants from metro areas. This chart is from the Population and Migration topic page on the ERS website.
Tuesday, July 31, 2012
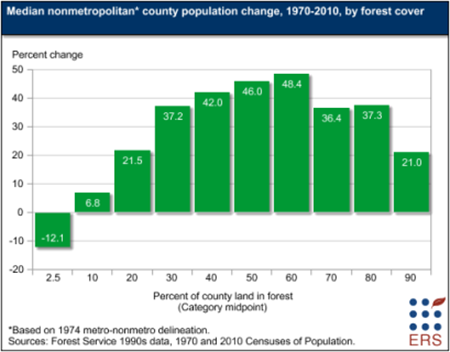
The attractiveness of an area as a place to live and work depends partly on how land is used. Landscape preferences research confirms that water and varied terrain are attractive features, but also shows that scenery with a mix of forest and open country is attractive to people, much more so than scenery that is either largely treeless or extensively forested. Rural migration patterns suggest that people have followed these preferences in choosing where to live. The population of the typical nonmetro county with between 60 and 70 percent of its land are covered by trees grew more than other nonmetro counties over the 1970-2010 period--increasing by nearly 50 percent. This chart is from the Natural Amenities topic page on the ERS website, updated May 26, 2012.
Wednesday, July 11, 2012
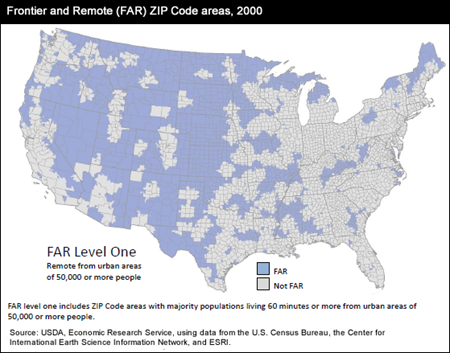
Population retention, job creation, and acquisition of goods and services often require increased effort in very rural, remote U.S. communities. ERS has developed a set of frontier and remote (FAR) area codes to aid research and policymaking on such communities. The initial version classifies ZIP code areas and includes four FAR level codes, based on different population and travel-time thresholds. The levels are meant to reflect likely access to various levels of public and private services. Level one-shown on the map-identifies areas lacking easy access to services commonly provided in large urban centers, such as advanced medical procedures, major household appliances, regional airport hubs, or professional sports franchises. Other levels identify increasingly remote areas of the country that may lack easy access to even basic services, such as grocery stores, gas stations, and basic health-care. The map is from the Frontier and Remote Area Codes data product on the ERS website, updated June 1, 2012.


