ERS Charts of Note
Subscribe to get highlights from our current and past research, Monday through Friday, or see our privacy policy.
Get the latest charts via email, or on our mobile app for  and
and 
Thursday, August 23, 2018
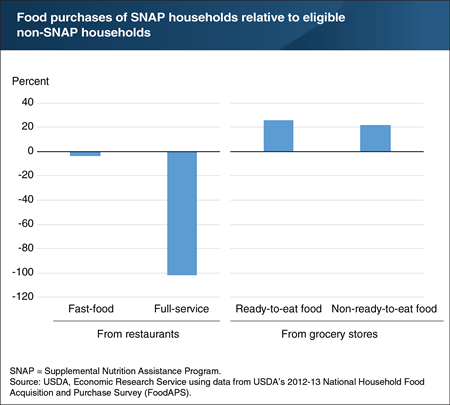
In a recent study, ERS researchers used data from USDA’s 2012-13 National Household Food Acquisition and Purchase Survey (FoodAPS) to look at the factors that affect demand for convenience foods, including participation in USDA’s Supplemental Nutrition Assistance Program (SNAP). SNAP provides low-income households with monthly benefits to purchase food at authorized food stores. Estimates from the ERS study show that SNAP participants spend less on restaurant foods and more on foods from grocery stores relative to non-SNAP households that qualify for the program. SNAP participation was associated with a 26-percent higher level of ready-to-eat grocery store food purchases and a 21-percent higher level of purchases of non-ready-to-eat grocery store food, such as raw meats, seafood, dry beans, pasta, and other foods requiring cooking and preparation time. In addition, eligible non-SNAP households purchased almost twice as much full-service restaurant foods as SNAP households. The statistics for this chart are from the ERS report, Consumers Balance Time and Money in Purchasing Convenience Foods, June 2018.
Friday, August 17, 2018
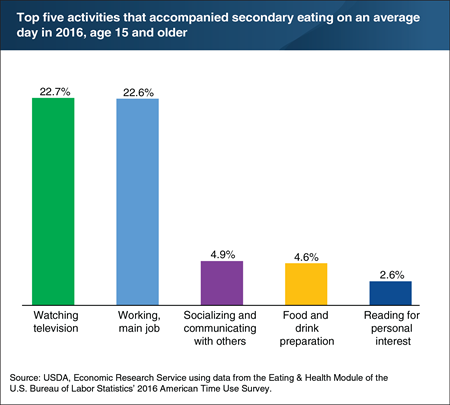
On an average day in 2016, Americans age 15 and older spent 63.6 minutes eating and drinking as a primary—or main—activity, according to data from the U.S. Bureau of Labor Statistics’ American Time Use Survey (ATUS). In addition, they spent 17.2 minutes eating as a secondary activity—that is, eating while engaged in another activity considered primary by the individual, such as watching television, driving, preparing meals, or working. Five activities accounted for 57.4 percent of all the activities that Americans reported engaging in while eating as a secondary activity. Of these top five activities, watching television (22.7 percent of all accompanying activities) and working one’s main job (22.6 percent) just about tied for the most common activity. The remaining three activities each accounted for less than 5 percent of responses: socializing and communicating with others (4.9 percent), food and drink preparation (4.6 percent), and reading for personal interest (2.6 percent). The data for this chart and other time-use information can be found in ERS’s Eating and Health Module (ATUS) data product.
Thursday, July 26, 2018
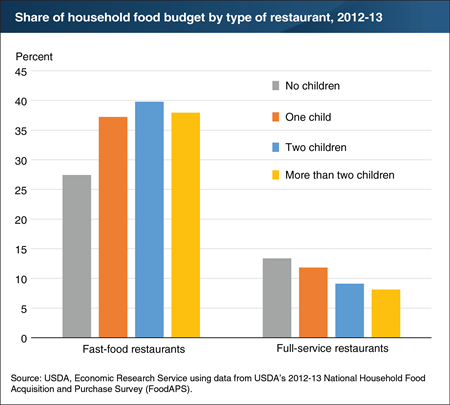
Childcare requires a lot of time, and some households respond to this constraint by cutting back on time spent shopping for food, cooking, and cleaning up afterwards. ERS researchers used data from USDA’s 2012-13 National Household Food Acquisition and Purchase Survey (FoodAPS) to look at the factors that affect demand for convenience and found that households with two children spent 48 percent of their food budgets on restaurant food, while households without children spent only 41 percent. Longer waiting times for food and less child-friendly settings and menu offerings may be among the reasons that households with children spent less on full-service restaurant meals than those without children, regardless of the number of children. As the number of children increases, the monetary cost of eating out seems to outweigh the time savings, especially for households with more than two children. Households with one child spent 37 percent of their food budget on fast food, while households with two children spent 40 percent. The share spent on fast food did not increase after two children. A version of this chart appears in the June 2018 Amber Waves article “Higher Incomes and Greater Time Constraints Lead to Purchasing More Convenience Foods."
Thursday, June 28, 2018
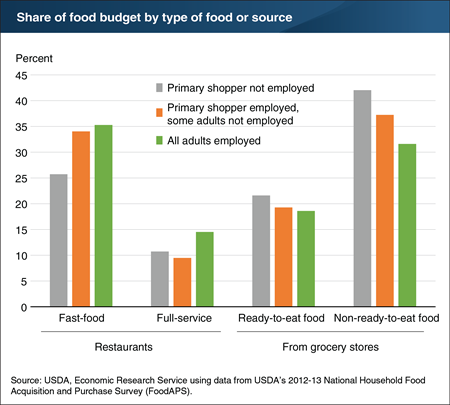
When consumers are pressed for time because of employment demands, many respond by spending less time on food shopping, preparation, and clean up. In a recent study, ERS researchers used data from USDA’s 2012-13 National Household Food Acquisition and Purchase Survey (FoodAPS) to look at the factors that affect demand for convenience food. The researchers found that households that are time constrained by employment spent more on restaurant food and less on grocery store food. Households where all adults were employed spent about half of their food budgets at restaurants, whereas households where a primary shopper was unemployed spend only 36 percent. The share of the food budget spent on non-ready-to-eat foods, such as raw meats, seafood, dry beans, pasta, and other foods requiring cooking and preparation time, also presents a picture of households making a tradeoff between time and money. Households where all adults were employed spent 10 percentage points less of their food budgets on non-ready-to-eat foods compared to households where a primary shopper was not employed. The statistics for this chart are from the ERS report Consumers Balance Time and Money in Purchasing Convenience Foods, released on June 27, 2018.
Tuesday, June 5, 2018
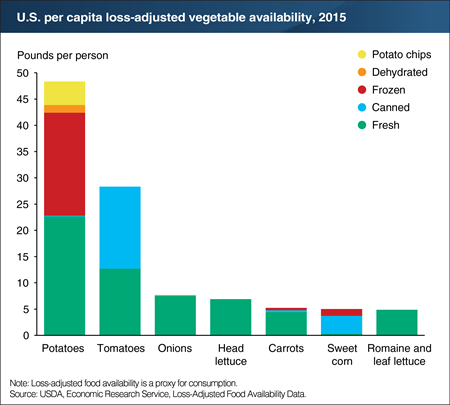
According to ERS’s loss-adjusted food availability data, Americans consumed an average of 156.3 pounds of fresh and processed vegetables per person in 2015. The loss-adjusted food availability data series takes per capita supplies of food available for human consumption and adjusts for some of the spoilage, plate waste, and other losses in restaurants, grocery stores, and the home to more closely approximate consumption. Potatoes claimed the #1 spot at 48.3 pounds per person, including both fresh potatoes and processed products (frozen, canned, and dehydrated potatoes and potato chips and shoestrings). Canned tomatoes are the leading canned vegetable, and total tomato consumption—fresh and canned—came in second at 28.3 pounds per person. Americans consumed 7.7 pounds of fresh and dehydrated onions per person in 2015, almost a pound more than head lettuce consumption. Consumption of carrots, sweet corn, and romaine and leaf lettuce finished the list of America’s top seven vegetable choices. This chart appears in ERS’s Ag and Food Statistics: Charting the Essentials data product.
Tuesday, February 6, 2018
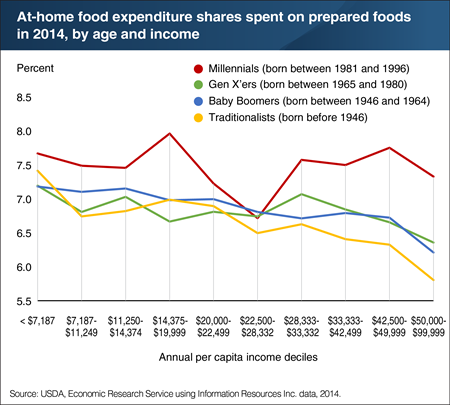
Millennials are now the largest living generation—surpassing Baby Boomers—in the United States. Their large collective buying power is only expected to expand as their earnings increase as they age. Food retailers, for example, increasingly respond to preferences for grocery store foods that are ready-to-eat or just need to be heated before consuming—preferences that Millennials clearly display. A recent ERS study found that across almost all income ranges, Millennials assigned more of their food-at-home budgets to prepared foods, such as canned soup or deli rotisserie chicken, when compared to older generations. With the exception of households with incomes of $20,000 to $28,332 per household member, the share of food-at-home expenditures devoted to prepared foods stayed relatively constant for Millennial-headed households at 7.5 to 8 percent. In contrast, Traditionalists, the oldest generation represented, generally allocated the least amount of their food budgets to prepared foods, with a small decline in the share for households with higher per capita incomes. This chart appears in "Millennials Devote Larger Shares of Their Grocery Spending to Prepared Foods, Pasta, and Sugar and Sweets Than Other Generations," in the December 2017 issue of ERS’s Amber Waves magazine.
Friday, January 19, 2018
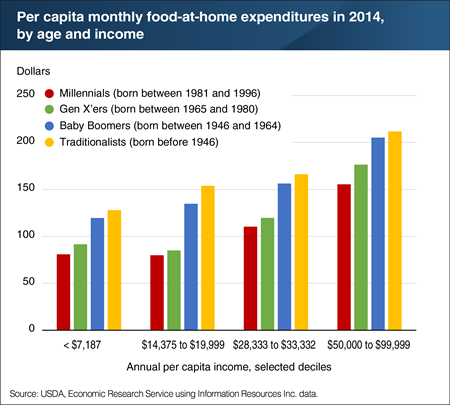
A recent ERS analysis of 2014 grocery store data found that compared to older generations, Millennial-headed households spent the least per person on food at home. However, like the other generations analyzed, Millennial households with higher incomes tended to spend more on grocery store foods than Millennial households with lower incomes. This is likely because poorer households have less income to spend on food at home. Even with this lower spending, lower income households still spend a higher share of their total food budgets in grocery stores. Traditionalists and Baby Boomers spent more per person on food at home in each of 10 income groups than Millennials and Gen X’ers. For example, of households earning between $14,000 and $20,000 per household member annually, Millennials spent just under $80 per month per person on food at home and Gen X’ers spent $85, whereas Baby Boomers in that income group spent $135 and Traditionalists spent $154. Differences in food-at-home spending between the generations may reflect the younger generations’ stronger preference for eating out, which may change as they age. A version of this chart appears in the ERS report, Food Purchase Decisions of Millennial Households Compared to Other Generations, released on December 29, 2017.
Wednesday, November 22, 2017
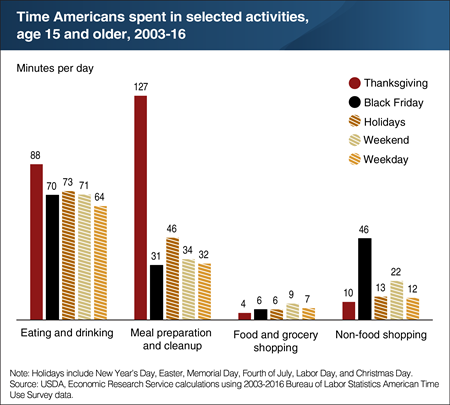
Do people really spend that much time preparing food, eating, drinking, and cleaning up the kitchen on Thanksgiving Day and on holiday shopping on Black Friday? The answer to both questions is, “Yes!” Over a survey period of 2003-16, Americans spent an average of 88 minutes eating and drinking on Thanksgiving. This was about 15 minutes greater than the time Americans spent eating and drinking on average for 6 other major holidays. Similarly, compared with the average for these non-Thanksgiving holidays, Americans spent much more time engaged in meal preparation and cleanup (127 minutes versus 46 minutes). Now, when it comes to the day after Thanksgiving, relative to other days, Americans tend to spend more of their time shopping for items other than food. Americans spent 46 minutes shopping for non-food items on an average Black Friday, which is about 250 percent higher than an average non-Thanksgiving holiday. More information on ERS’s Eating and Health Module of the American Time Use Survey can be found in ERS’s Eating and Health Module (ATUS) data product.
Thursday, October 26, 2017
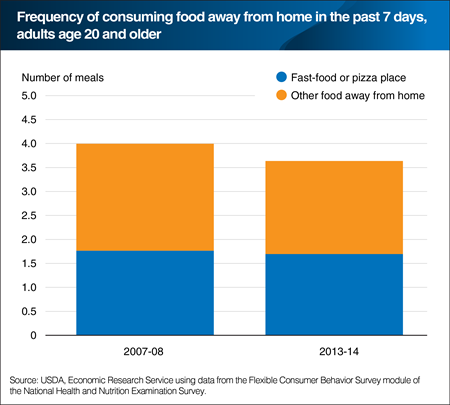
ERS developed the Flexible Consumer Behavior Survey (FCBS) module, which, starting in 2007, has been part of the National Health and Nutrition Examination Survey. The FCBS questions are designed to collect data on U.S. consumers’ dietary knowledge, attitudes, and habits, including their eating out habits. ERS researchers used FCBS data to get a sense of how often Americans purchase or acquire meals prepared away from home in places such as restaurants, fast-food places, food stands, grocery stores, and vending machines. In 2013-14, adults age 20 and older reported that they purchased or acquired an average of 3.6 away-from-home meals in the past 7 days—down from 4.0 meals in 2007-08. This decline in eating out could potentially reflect tighter food budgets due to the Great Recession (December 2007 to June 2009) and the slow economic recovery afterwards. The number and share of away-from-home meals reported as coming from a fast-food or pizza place was about the same in both periods. Data for this chart are from the Food Consumption & Demand topic page on the ERS Web site, updated on September 18, 2017.
Monday, October 23, 2017
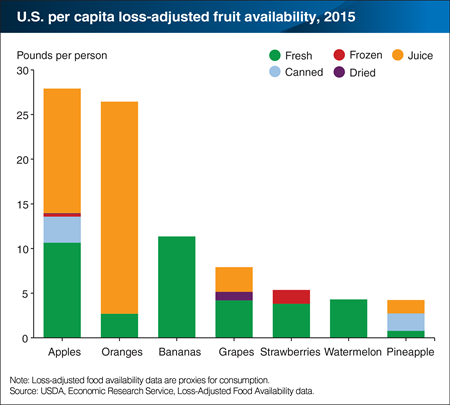
Americans consumed an average of 115.4 pounds of fresh and processed fruit per person in 2015, according to ERS’s loss-adjusted food availability data. This data series takes per capita supplies of food available for human consumption and adjusts for some of the spoilage, plate waste, and other losses in eating places, grocery stores, and the home to more closely approximate consumption. Apple juice consumption at 14 pounds (1.6 gallons) per person in 2015, combined with fresh apples at 10.7 pounds per person, and canned, dried, and frozen apples (3.3 pounds per person), puts apples in the #1 spot for total fruit consumption. While orange juice leads juice consumption at 23.7 pounds (2.7 gallons), total orange consumption—juice and fresh—came in second. Americans consumed 11.3 pounds of fresh bananas per person in 2015, almost a pound more than fresh apple consumption. Consumption of grapes reached 7.9 pounds per person, and strawberries, watermelon, and pineapple rounded out the list of America’s top fruit choices. This chart appears in ERS’s Ag and Food Statistics: Charting the Essentials data product, updated September 2017.
Friday, September 8, 2017
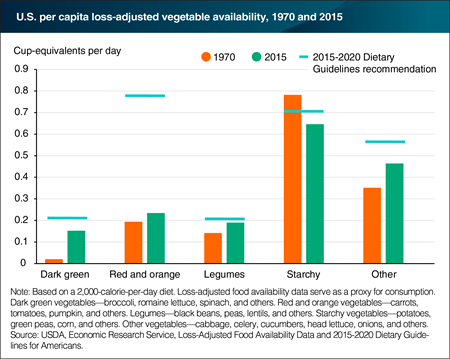
The 2015-2020 Dietary Guidelines for Americans recommend that people on a 2,000 calorie-per-day diet consume 2½ cup-equivalents (cup-eq) of vegetables per day. A cup-eq of vegetables is generally equal to 1 cup of raw or cooked vegetables or vegetable juice, or 2 cups of raw leafy greens. The Guidelines include recommended amounts of five vegetable subgroups (dark green, red and orange, legumes, starchy, and other) and advise Americans to consume a variety of vegetables from each subgroup. According to ERS’s loss-adjusted food availability data (a proxy for consumption), the average American consumed 1.72 cup-eq of vegetables and legumes per day in 2015—69 percent of the daily recommendation for a 2,000 calorie-per-day-diet—and up from 1.49 cup eq in 1970. While starchy vegetable consumption declined by 17 percent (mostly due to drops in fresh potatoes and canned corn), daily dark green vegetable consumption grew from 0.02 cup-eq in 1970 to 0.15 cup-eq in 2015. Romaine and leaf lettuce and fresh broccoli were the largest contributors, reflecting the growing demand for salads and fresh vegetables. Consumption of legumes and other vegetables increased, closing in on the Guidelines’ recommendations. Red and orange vegetable consumption grew to 0.23 cup-eq per day in 2015, but is still just 30 percent of the recommendation. The data for this chart are from ERS’s Food Availability (Per Capita) Data System, updated July 26, 2017.
Wednesday, August 9, 2017
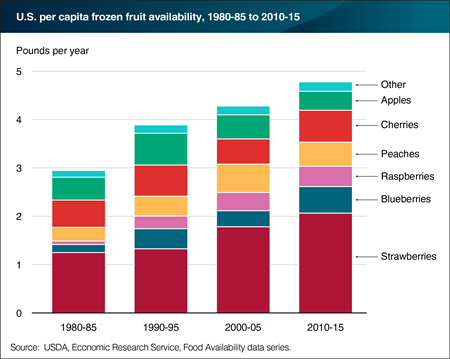
America’s love affair with frozen smoothies continues to grow and along with it consumption of its quintessential ingredient, frozen fruit. Between the early 1980s and 2015, the annual supply of frozen fruit available for consumption, led by a doubling in demand for frozen berries, grew by 61 percent to 4.8 pounds per person—about 5 percent of 2015’s total U.S. fruit availability. While strawberries remain consumers’ favorite frozen fruit—accounting for 40 percent of availability in 2015—blueberries and raspberries increased their share from 8 percent in 1980-85 to 20 percent in 2010-15. Peaches led the growth in availability of non-berry frozen fruits, followed by cherries. Frozen apples, used mainly in commercial and foodservice baking, lost market share, dropping from 17 to 8 percent of frozen fruit availability over 1980-2015. Consumer demand for healthy, convenient foods and manufacturers’ use of improved freezing technologies to improve product quality, along with colorful packaging and smoothie-ready fruit combinations and add-ins, underlie the growth in frozen fruit consumption. The data for this chart are from ERS’s Food Availability (Per Capita) Data System, updated July 26, 2017.
Monday, July 10, 2017
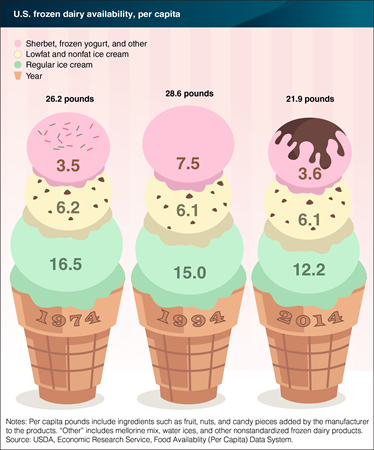
In honor of National Ice Cream Day, July 16, many Americans might celebrate with a scoop or two of their preferred frozen dairy treat. According to ERS’s Food Availability data, the food supply provided 21.9 pounds of frozen dairy products per person in 2014—a decline from 26.2 pounds per person 40 years ago. Ice cream (regular, low fat, and nonfat) is still America’s favorite frozen dairy treat, accounting for 84 percent of total frozen dairy product availability. Supplies of traditionally lower-fat options like low and nonfat fat ice cream and sherbet have either remained steady or declined over the course of the past 40 years, despite increased consumer interest in cutting calories and fat. After growing in popularity in the early 1990s, frozen yogurt availability has dropped from 3.5 pounds per capita in 1991 to 1.2 pounds in 2014. Competition from non-dairy frozen treats made from soy and nut milks, increased popularity of substitute products like refrigerated yogurt, and preferences for products without lactose may have contributed to declining frozen dairy product consumption. The data for this chart are from ERS’s Food Availability (Per Capita) Data System.
Thursday, July 6, 2017
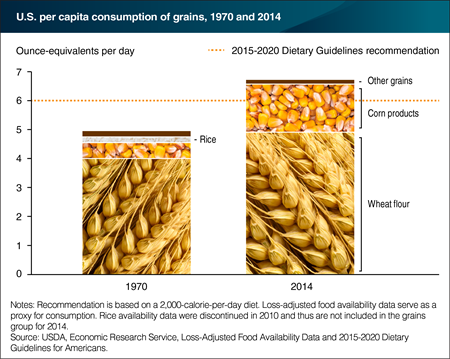
The 2015-2020 Dietary Guidelines for Americans recommend that people requiring 2,000 calories per day consume 6 ounce-equivalents of grains, half of which should be whole grains. An ounce equivalent of grains is generally equal to 1 slice of bread, 1 cup of ready-to-eat cereal, ½ cup of cooked rice, pasta, or cereal, 1 tortilla (6 inch diameter), or 1 pancake (5 inch diameter). According to ERS’s loss-adjusted food availability, Americans consumed an average of 6.7 ounce-equivalents of wheat flour, corn products, and other grains (rye flour, oat products, and barley products) per day in 2014. This is a 35-percent increase from 5.0 ounce-equivalents per person per day consumed in 1970. While wheat flour consumption grew by 23 percent, consumption of corn products grew by 202 percent, reflecting the growing popularity of corn-based foods, such as tortillas and chips, and the use of cornstarch in processed foods. Consumption of rye flour, oat products, and barley products totaled 0.21 ounce-equivalents per person per day in 1970, and fell to 0.16 ounce-equivalents in 2014. This chart appears in "U.S. Diets Still Out of Balance with Dietary Recommendations" in the July 2017 issue of ERS’s Amber Waves magazine.
Tuesday, February 21, 2017
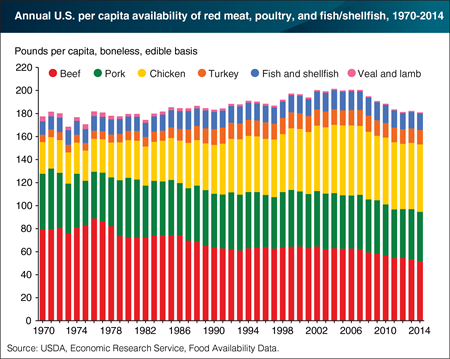
According to ERS’s food availability data, the total per capita supply of red meat, poultry, and fish available for consumption in the United States—which reached 200 pounds on a boneless, edible basis in 2007—fell to 181 pounds in 2014. Beef availability declined from its peak of 88.8 pounds per person in 1976 to 51.5 pounds per person in 2014, and availability of other red meats—pork, veal, and lamb—dropped as well. Per person fish and shellfish availability, up from 12 pounds in 1970, has fluctuated between 14.5 and 16.5 pounds since 1984 and was 14.5 pounds per person in 2014. Turkey availability grew in most years between 1970 and 1996, reaching 14.3 pounds per person before declining to 12.4 pounds per person in 2014. Availability of chicken has steadily increased since 1970, reaching 58.7 pounds per person in 2014. High crop prices, which led to high feed costs and subsequently higher beef prices over 2006-15, are partly responsible for reduced beef production. Lower bird mortality rates and a higher average live weight per broiler have increased chicken availability. This chart appears in “U.S. Per Capita Availability of Red Meat, Poultry, and Fish Lowest Since 1983” in the February 2017 issue of ERS’s Amber Waves magazine.
Thursday, February 9, 2017
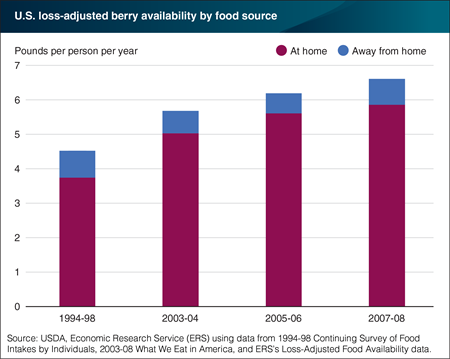
Flavor, healthfulness, convenience, and year-round availability have contributed to increasing consumer demand for strawberries, blueberries, raspberries, and other berries, with per capita loss-adjusted availability growing from an average of 4.5 pounds per person per year during 1994-98 to 6.6 pounds during 2007-08 and to 9.9 pounds in 2014. Linking ERS’s loss-adjusted food availability data with food intake surveys from 1994-2008 reveals that berries, like other fruit, are mainly consumed at home rather than away from home at eating out places. The increase in berry consumption comes exclusively from purchases at grocery stores (the food-at-home market). The at-home share of berry consumption rose from 83 percent during 1994-98 to 89-91 percent during 2003-08. The loss-adjusted availability of berries consumed at home rose from 3.7 pounds per person per year during 1994-98 to 5.9 pounds during 2007-08, while away-from-home consumption stayed just shy of 0.8 pounds per person. This chart appears in the ERS report U.S. Food Commodity Availability by Food Source, 1994-2008, December 2016.
Tuesday, January 31, 2017
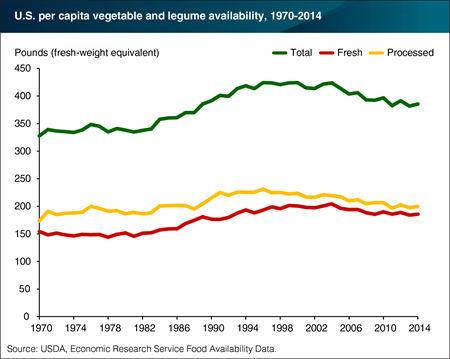
Vegetables and legumes are widely recognized as a good source of many vitamins, minerals, and dietary fiber. According to ERS’s food availability data, the supply of vegetables and legumes available to eat on a per person basis grew from 328 pounds in 1970 to 424 pounds in 2004. Between 2004 and 2014, per person vegetable and legume (pulses and beans) availability fell by 39 pounds to 385 pounds. Fresh and processed potatoes—frozen, canned, dehydrated, and chips—accounted for 59 percent of the 2004-14 decline. Over the longer period of 1970 to 2014, fresh vegetable availability rose by 20 percent; fresh bell peppers, tomatoes, onions, broccoli, and cucumbers combined grew by 36 pounds during that time. Per person availability of canned, frozen, and other processed vegetables and legumes increased from 174 pounds in 1970 to 225 pounds in 1998, then began a decline to 200 pounds in 2014. A version of this chart appears in the ERS report, U.S. Trends in Food Availability and a Dietary Assessment of Loss-Adjusted Food Availability, 1970-2014, released on January 27, 2017.
Thursday, January 19, 2017
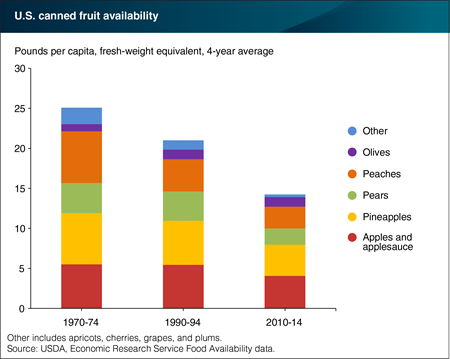
According to ERS’s food availability data, 14.2 pounds per capita of canned fruit were available for consumption by U.S. consumers in 2010-14, down after averaging 21 pounds per person in 1990-94 and 25.1 pounds per person in 1970-74. Canned apple and applesauce availability was 4.1 pounds per person in 2010-14, while canned pineapple availability—the second highest—was 3.9 pounds per person. With the exception of olives, per person availability fell for all canned fruit between 1970-74 and 2010-14. For example, in 1970-74 canned peaches led canned fruit availability at 6.5 pounds per person, but dropped to 2.7 pounds per person in 2010-14—a 58-percent decline. The availability of canned pears fell from 3.8 pounds per person in 1970-74 to 2 pounds per person in 2010-14. One reason for declines in canned fruit availability is that some consumers switched to fresh fruit. Canned fruit’s share of total U.S. fruit availability decreased from 10.6 percent in 1970-74 to 5.6 percent in 2010-14, while fresh fruit availability grew by 34.5 pounds per person and boosted fresh fruit’s share from 41 percent to 52 percent. The data for this chart are from ERS’s Food Availability (Per Capita) Data System.
Thursday, January 12, 2017
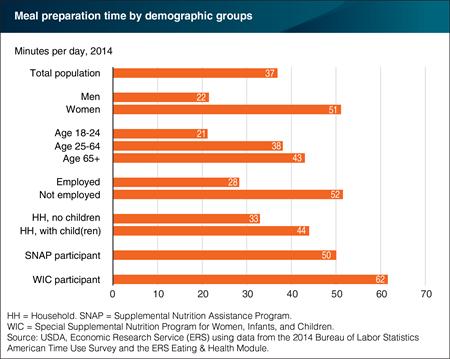
On an average day in 2014, Americans age 18 and over spent 37 minutes in food preparation and cleanup. However, the average time spent in “meal prep”—defined as preparing food and beverages, serving them, and cleaning up afterwards—varied considerably among different groups. Men spent an average of 22 minutes, whereas women spent an average of 51 minutes. Younger adults (age 18-24) spent an average of 21 minutes, while working-age adults (age 25-64) spent 38 minutes. Those age 65 or older spent an average of 43 minutes. Employed individuals spent less time in meal prep than those not employed, and those in households without children spent less time than those in households with children. Participants in USDA’s Special Supplemental Nutrition Program for Women, Infants, and Children (WIC) had the longest average duration in meal prep time—62 minutes. Time spent preparing infant formula, breastfeeding, and pumping breast milk is included in meal prep time in the American Time Use Survey (ATUS). These time use data are from the ERS-developed 2014 Eating & Health Module—a supplement to the Bureau of Labor Statistics’ ATUS. This chart appears in “Americans Spend an Average of 37 Minutes a Day Preparing and Serving Food and Cleaning Up” in ERS’s November 2016 Amber Waves magazine.
Monday, January 9, 2017
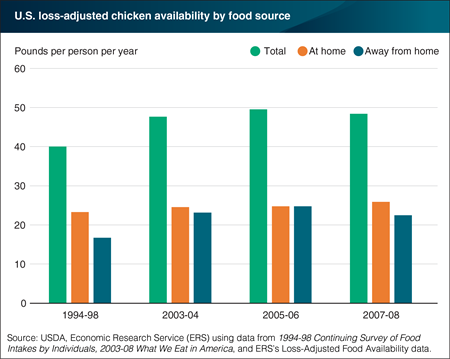
Per person chicken consumption in the United States more than doubled over the past four decades. Linking ERS’s loss-adjusted food availability data with food intake surveys from 1994-2008 reveals that the away-from-home market, which includes restaurants with wait staff, fast food places, school cafeterias, and other eating out places, drove much of the growth in U.S. chicken consumption over the 1994-2008 period. The share of total chicken consumption prepared by away-from-home eating out places rose from 41.9 percent during 1994-98 to 46.4 percent during 2007-08. Loss-adjusted chicken availability per person in the away-from-home market was 16.8 pounds in 1994-98 and rose to the range of 22.5 to 24.8 pounds during 2005-08. In contrast, chicken obtained at grocery stores (the food-at-home market) grew by just 2.6 pounds per person from 23.3 to 25.9 pounds. The greater growth in chicken consumption away from home is consistent with the introduction of chicken nuggets, chicken strips, and grilled chicken sandwiches and their rising popularity in fast food and other eating out places. This chart appears in the ERS report U.S. Food Commodity Availability by Food Source, 1994-2008, released on December 28, 2016.


