ERS Charts of Note
Subscribe to get highlights from our current and past research, Monday through Friday, or see our privacy policy.
Get the latest charts via email, or on our mobile app for  and
and 
Wednesday, January 3, 2024
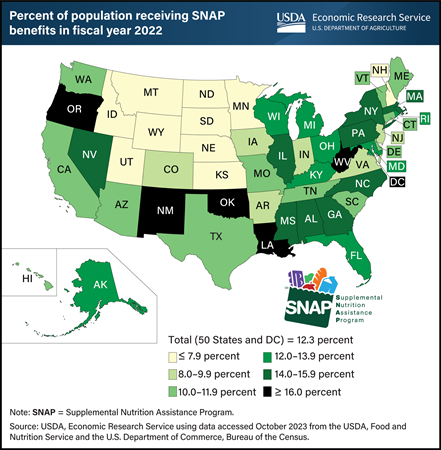
In fiscal year (FY) 2022, USDA’s Supplemental Nutrition Assistance Program (SNAP) served an average of 41.1 million people per month in the 50 States and Washington, DC. SNAP is the largest domestic nutrition assistance program, accounting for about two-thirds of USDA spending on food and nutrition assistance in recent years. The SNAP participation rate increased nationwide during the Coronavirus (COVID-19) pandemic, to a high of 12.5 percent of the resident population of the 50 States and DC in FY 2021. The FY 2022 rate fell slightly to 12.3 percent. SNAP participation varies across States because of differences in program administration and economic conditions. In FY 2022, the share of residents receiving SNAP benefits in each State ranged from as high as 24.5 percent in New Mexico to as low as 4.6 percent in Utah. In 35 States, the share was somewhere between 8 and 16 percent. This map appears in USDA, Economic Research Service’s Charting the Essentials, last updated November 2023.
Tuesday, January 2, 2024
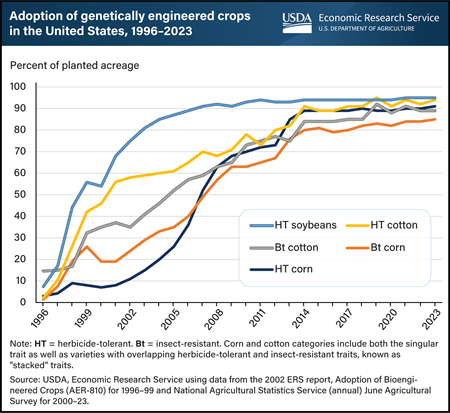
Genetically engineered (GE) seeds were commercially introduced in the United States for major field crops in 1996, with adoption rates increasing rapidly in the years that followed. The two main GE trait types are herbicide-tolerant (HT) and insect-resistant (Bt). These traits can be added individually to seeds as well as combined into a single seed, called stacked seed traits. USDA, Economic Research Service (ERS) reports information on GE crops in the data product Adoption of Genetically Engineered Crops in the U.S. These data show that by 2008, more than 50 percent of corn, cotton, and soybean acres were planted with at least one GE seed trait. Today, more than 90 percent of corn, cotton, and soybean acres are planted using at least one GE trait. Traits other than HT and Bt have been developed, such as resistance to viruses, fungi, and drought or enhanced protein, oil, or vitamin content. However, HT and Bt traits are the most used in U.S. crop production. While HT seeds also are widely used in alfalfa, canola, and sugar beet production, most GE acres are occupied by three major field crops: corn, cotton, and soybeans. This chart appears in the ERS topic page Biotechnology, published in October 2023.
Thursday, December 14, 2023
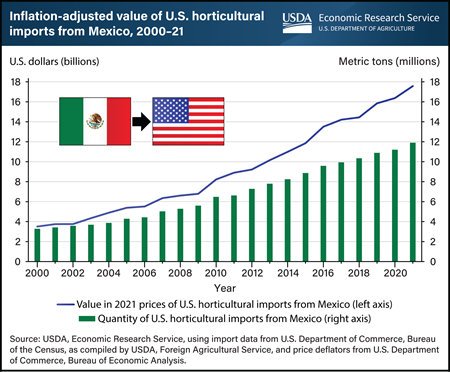
More than 88 percent of Mexico’s horticultural exports are destined for the United States. The strength of Mexico’s access to the U.S. market is, in part, due to efforts by Mexico’s horticultural growers to adapt to new U.S. food safety standards. In 2011, the United States passed the Food Safety Modernization Act (FSMA), which covers the safety of the entire U.S. food supply chain regardless of whether a company operates on U.S. soil or in a foreign country. In response to FSMA’s new requirements for food safety, Mexico’s horticultural companies made changes to equipment, invested in new infrastructure, and implemented new techniques for food testing. U.S. horticultural imports from Mexico have doubled in volume since FSMA’s implementation in 2011. From 2000 to 2021, these imports grew at a compound annual rate of 8 percent. Adjusting for inflation, the value of imports increased from about $3.5 billion in 2000 to about $17.6 billion in 2021, as expressed in 2021 dollars. By 2021, Mexico supplied almost two-thirds of U.S. vegetable imports and about half of U.S. fruit and tree nut imports. Although mandatory compliance with FSMA’s horticultural growing standards began at the start of 2018, many companies had initiated food safety programs before the laws were enacted in 2011. This chart is drawn from the USDA, Economic Research Service report, How Mexico’s Horticultural Export Sector Responded to the Food Safety Modernization Act, published in August 2023.
Wednesday, December 13, 2023
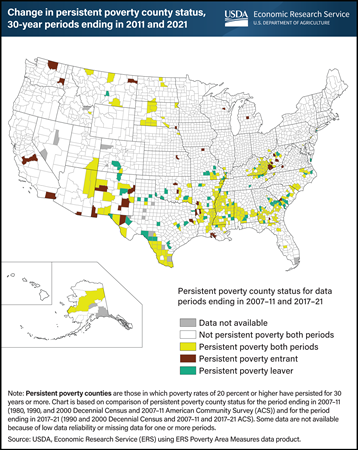
The number of counties classified as persistently poor has fallen over the last 10 years. Persistent poverty counties are those in which poverty rates of 20 percent or higher have persisted for 30 years or more. The USDA, Economic Research Service (ERS) has published poverty county classifications since the 1980s (using data from as early as the 1950s), which allow for the evaluation of changes in county poverty status over time. The most current persistent poverty classification covers the period from 1990 to 2021. ERS researchers examined changes between this classification and one from a decade earlier (data from 1980 to 2011). There were 318 persistent poverty counties in the 30-year period ending in 2021 compared with 353 for the period ending in 2011, a drop of 10 percent. Overall, 282 counties remained persistently poor from one period to the next, 36 counties entered persistent poverty status, and 70 left that category. The entrants are largely characterized by poverty among the resident Hispanic population, as well as re-entrants within historically poor areas such as central Appalachia. The counties that left persistent poverty status were predominantly in the Southern Coastal Plains, which includes much of the historically poor region known as the Black Belt. This chart uses data found in the ERS Poverty Area Measures data product, updated in December 2023.
Tuesday, December 12, 2023
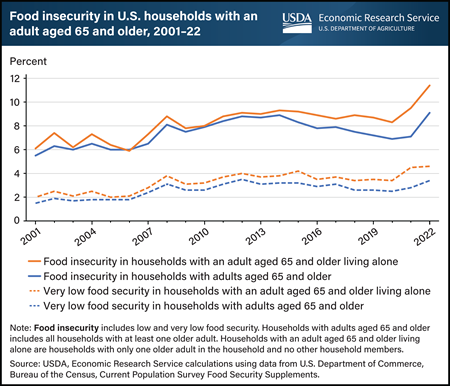
In 2022, 9.1 percent of U.S. households with adults aged 65 and older were food insecure at some time during the year, meaning they had difficulty providing enough food for all their members because of a lack of resources. The prevalence of food insecurity in households with adults aged 65 and older in 2022 was statistically significantly higher than the 7.1 percent in 2021 and the 6.9 percent in 2020. USDA, Economic Research Service monitors the food security status of households in the United States through an annual nationwide survey. The survey does not include older adults residing in assisted living facilities. In 2022, 11.4 percent of households with an adult aged 65 and older living alone were food insecure, which is statistically significantly higher than the prevalence in 2021 of 9.5 percent and in 2020 of 8.3 percent. Very low food security is a more severe form of food insecurity in which the food intake of some household members was reduced and normal eating patterns were disrupted at times during the year. The 2022 prevalence of very low food security in households with adults aged 65 and older was 3.4 percent, statistically significantly higher than the 2.8 percent in 2021 and the 2.5 percent in 2020. Household food security data by various demographic categories, such as older adults, are available in the report Household Food Security in the United States in 2022, published in October 2023.
Monday, December 11, 2023
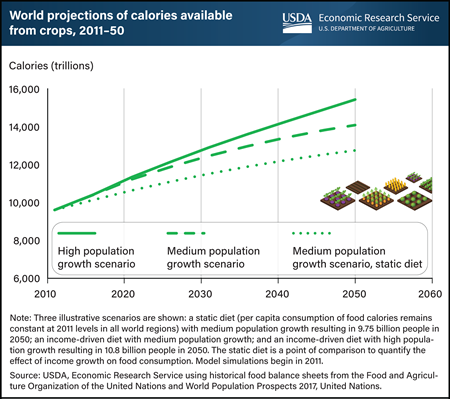
As the world’s population increases, the global agriculture system will be expected to provide more food. To better understand how the world agriculture system may grow in response by 2050, researchers at USDA, Economic Research Service (ERS) created a range of scenarios based on population growth. Under medium population growth, production around the world would have to increase to 14,060 trillion crop calories to feed 9.75 billion people in 2050. This is a 47-percent increase in crop calories from a 2011 baseline. Crop calories, the total calories available from crops, are a measure of the size of global agriculture since crops can be either consumed directly as food or fed to animals to be consumed as meat, dairy products, and eggs. In a high population growth scenario, 15,410 trillion crop calories would be needed to feed 10.8 billion people, a 61-percent increase in calories from the 2011 baseline. With both the medium and high population growth scenarios, researchers assumed that as per capita incomes rise, people would increase their overall consumption of calories as well as consume a higher proportion of animal products, such as meat and dairy. ERS researchers compared these scenarios to a static diet scenario, in which per capita food consumption remained constant over time, providing a point of comparison to quantify the effect of income growth on food consumption. An expanded version of this chart appears in the ERS report Scenarios of Global Food Consumption: Implications for Agriculture, published in September 2023.
Thursday, December 7, 2023
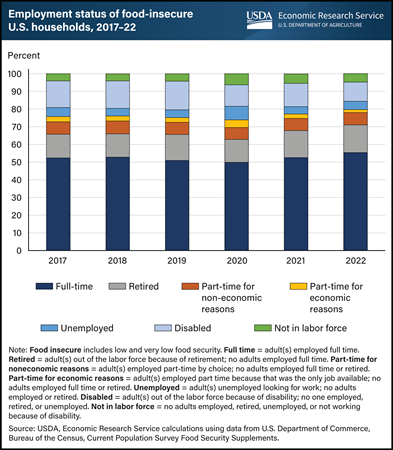
In 2022, over half of all food-insecure households in the United States had one or more adult members employed full time. USDA, Economic Research Service (ERS) monitors the prevalence of U.S. household food insecurity through an annual survey and provides information about the characteristics of food-insecure households, including their employment status. The employment status for each household is measured using the combined employment status of all adult household members. In 2022, households with adults employed full-time made up the largest share of food-insecure households at 55 percent, a share that has remained stable since 2017. Households with one or more adults employed part time because it was the only job available (called part time for economic reasons) comprised the smallest share of food-insecure households at 2 percent. The remaining food-insecure households had one or more adults who were retired, employed part time for non-economic reasons, unemployed, disabled, or not in the labor force. An interactive visualization and the underlying downloadable data for prevalence, severity (low and very low food security), and distribution of food insecurity by household employment status can be found on the ERS Interactive Charts and Highlights page.
Wednesday, December 6, 2023
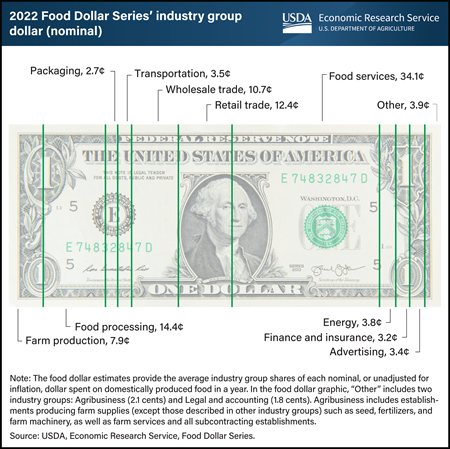
In 2022, more than a third of U.S. dollars spent on domestically produced food went to foodservice establishments, which includes restaurants and other food-away-from-home outlets. At 34.1 cents per food dollar in 2022, the foodservice share increased 1.6 cents from 2021 to reach its highest value in the USDA, Economic Research Service’s (ERS) Food Dollar Series. Industry groups add value by transforming the inputs they purchase from other industry groups and selling their output at higher prices. For instance, foodservice establishments prepare meals using food bought from distributors, such as those in the wholesale trade industry group, and utilities, such as gas and electricity bought from establishments in the energy industry group. Prices paid by customers include the value added by the restaurant itself plus the cumulative value added by all establishments before the restaurant. Annual shifts in the food dollar shares among industry groups occur for a variety of reasons, including changes in the mix of foods consumers buy, costs of materials, ingredients, and other inputs, as well as changes in the balance of food at home and away from home. The industry group shares food dollar data are available for 1993 to 2022 in the USDA, ERS Food Dollar Series data product, updated November 15, 2023.
Tuesday, December 5, 2023
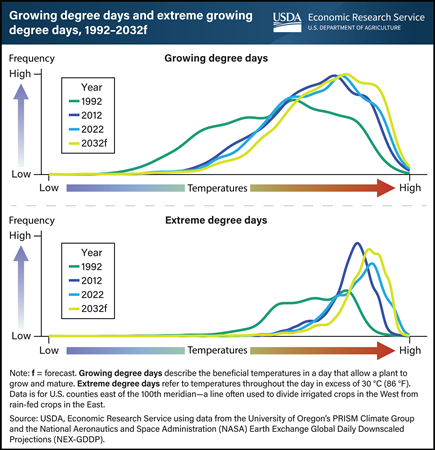
According to weather data from National Aeronautics and Space Administration (NASA), temperatures in the Corn Belt, a region spanning across Illinois, Indiana, Iowa, Michigan, Minnesota, Missouri, Ohio, and Wisconsin, have trended higher in recent years and are projected to continue to rise through the end of this century. Two measures can be used to capture how rising temperatures affect crops’ growth—growing degree days and extreme degree days. Growing degree days describe the beneficial temperatures in a day that allow a plant to grow and mature. With rising temperatures, the growing degree days for corn and soybeans increase. A crop’s exposure to added growing degree days is not necessarily harmful; after all, crops need heat and precipitation to grow. However, extreme degree days, which refer to temperatures throughout the day in excess of 30 °C (86 °F), cause heat stress that is harmful for a plant. Each decade since 1992, both growing degree days and extreme degree days have steadily increased with rising temperatures in the Corn Belt, where about 80 percent of all U.S. corn and soybeans are grown. In the decade leading to 2032, both measures are projected to continue to increase. This chart first appeared in the USDA, Economic Research Service report, Estimating Market Implications From Corn and Soybean Yields Under Climate Change in the United States, published in October 2023.
Monday, December 4, 2023
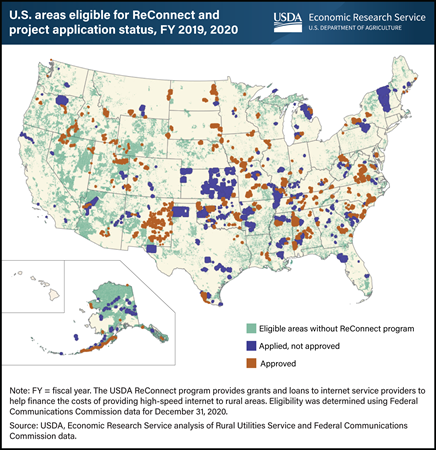
The ReConnect Program is USDA’s largest effort aimed at filling gaps in high-speed internet in unserved and underserved rural areas. The program was created on a pilot basis in 2018 and appropriated more than $5 billion between fiscal years 2018 and 2023. Its grants and loans provide funds that help the private sector provide broadband service to rural areas, which otherwise may not be profitable to reach. ReConnect reached an estimated 21 percent of the eligible rural population in its first two funding rounds, which involved applications submitted in FY 2019 and 2020. Applicants had to propose to provide a minimum broadband speed to all residences, businesses, and farms in proposed areas (25 megabits per second download and 3 megabits per second upload during the first two funding rounds). Most applicants were small telecommunications companies or cooperatives. Researchers with the USDA’s Economic Research Service examined proposed and approved projects from the applications submitted in fiscal years 2019 and 2020 to find that about 57 percent of proposed projects were funded. The most common reasons that applications were not approved were that broadband service was already available in the proposed service area, lack of financial feasibility of the proposal, and missing or insufficient information. This chart appears in the ERS report Three USDA Rural Broadband Programs: Areas and Populations Served, published in October 2023.
Thursday, November 30, 2023
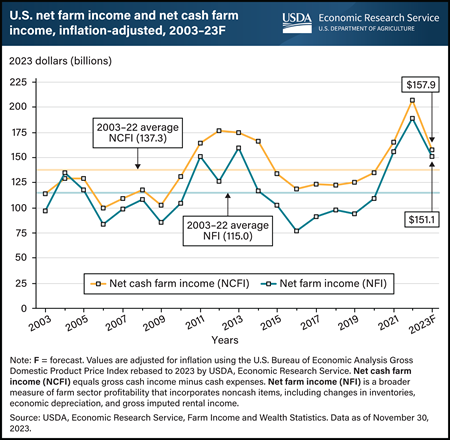
The USDA, Economic Research Service (ERS) forecasts inflation-adjusted U.S. net cash farm income (NCFI) to decrease by $49.2 billion (23.8 percent) from 2022 to $157.9 billion in 2023. Similarly, U.S. net farm income (NFI) is forecast to fall by $37.9 billion (20.0 percent) from 2022 to $151.1 billion in 2023. NCFI is calculated as gross cash income minus cash expenses. NFI is a broader measure of farm sector profitability that incorporates noncash items including changes in inventories, economic depreciation, and gross imputed rental income. The projected decreases in 2023 come after both NCFI and NFI reached all-time highs in 2022 of $207.1 billion and $188.9 billion, respectively. For 2023, cash receipts for farm commodities are projected to fall by $43.0 billion (7.8 percent) from 2022 to $509.6 billion in 2023. This includes forecasted declines in milk, corn, and broiler receipts. Total production expenses are expected to remain relatively stable in 2022, increasing by $0.6 billion (0.1 percent) to $443.4 billion in 2023. However, individual expense items are expected to vary, with interest expenses forecast to increase in 2023, while spending on fertilizer/lime/soil conditioner and feed is expected to decrease. Finally, direct Government payments to farmers are forecast to fall $4.0 billion (24.8 percent) lower in 2023 to $12.1 billion because of lower supplemental and ad hoc disaster assistance. Find additional information and analysis on the ERS topic page Highlights from the Farm Income Forecast, reflecting data released on November 30, 2023.
Wednesday, November 29, 2023
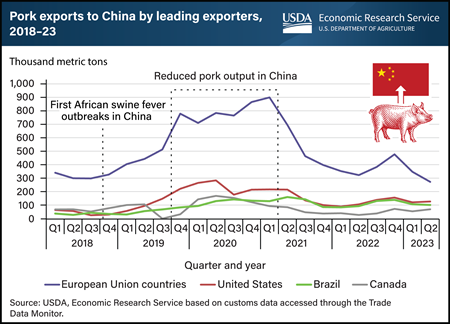
The 2018 spread of African swine fever (ASF) to China had reverberations in the global pork market. ASF—a virus often fatal to swine—caused an estimated loss of 27.9 million metric tons in China’s pork output from late 2018 to early 2021 and led to a doubling of China’s domestic pork prices. These high prices attracted a surge of pork exports from four major suppliers—the European Union (EU), United States, Brazil, and Canada. While the EU was the top supplier, U.S. pork exports were sizable and reached a record high of more than 287,000 metric tons in the second quarter of 2020. After surging, exports by all suppliers began declining during 2021 as China’s domestic production rebounded and associated prices plummeted. According to a recent report from USDA’s Economic Research Service (ERS), pork exports to China might have increased even more during the ASF outbreak if not for several factors. Specifically, China banned pork from some EU countries that also had ASF outbreaks. In addition, U.S. pork faced high retaliatory tariffs because of trade tensions, and China rejected some Canadian pork shipments. Also, during the COVID-19 pandemic, China launched stringent inspections of foreign meat suppliers and required decontamination of meat at Chinese ports. In aggregate, pork imports replaced about an estimated one-fifth of the domestic pork supplies lost in China during the ASF epidemic. Official data indicate that China’s pork production returned to its pre-ASF level in 2021. While exports to China are down from their peak, China is still one of the top 3 overseas markets for U.S. pork, with sales in the first 6 months of 2023 exceeding annual totals posted in years before ASF hit China. This chart first appeared in the ERS report How China’s African Swine Fever Outbreaks Affected Global Pork Markets, published November 2023.
Tuesday, November 28, 2023
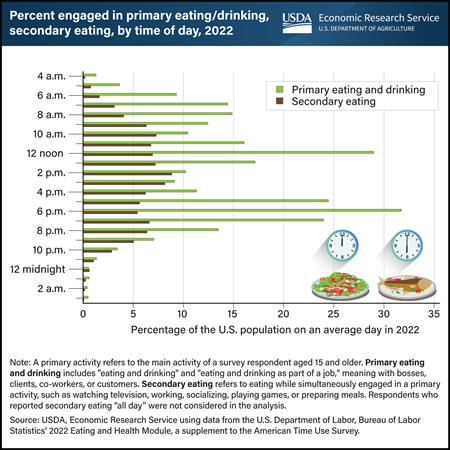
Throughout an average day in 2022, individuals aged 15 and older exhibit two distinct peak time blocks for primary eating and drinking—between 12 noon and 12:59 p.m. and from 6 to 6:59 p.m. About 3 in 10 individuals engaged in primary eating and drinking during each of these periods. While some people prefer to eat and drink while not doing anything else (primary eating and drinking), others opt for grazing while multitasking (secondary eating). Notably, between 9 a.m. and 9:59 p.m., at least 5 percent of U.S. residents participated in secondary eating each hour in 2022. The top five concurrent activities during secondary eating included watching television and movies, paid work, socializing with others, playing games, and food and drink preparation. Examining the eating patterns of the U.S. population is key to better understanding the determinants of dietary intake and diet-related health status. This data and chart come from the USDA, Economic Research Service’s Eating and Health Module (ATUS) data product, which is part of the nationally representative American Time Use Survey.
Monday, November 27, 2023
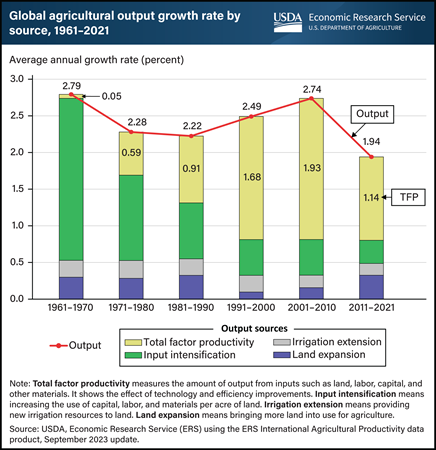
In the last decade, world agricultural output grew at an average annual rate of 1.94 percent per year, far slower than the 2.74-percent output growth rate over the previous decade and below the average annual rate of 2.3 percent over the last six decades (1961–2021). The slowdown in agricultural growth was primarily tied to a slowing rate of growth in agricultural total factor productivity (TFP), which fell to 1.14 percent per year in 2011–2021 (compared with 1.93 percent per year the previous decade). TFP measures the amount of agricultural output produced from the aggregated inputs used in the production process (land, labor, capital, and material resources). The figure shows four major sources of overall growth: bringing more land into production (holding yields fixed); extending irrigation to land; intensifying the use of capital, labor, and material inputs per unit of land; and improving TFP, which reflects the rate of technological and efficiency improvements of inputs. This data can be found in the ERS International Agricultural Productivity data product, updated in September 2023.
Wednesday, November 22, 2023
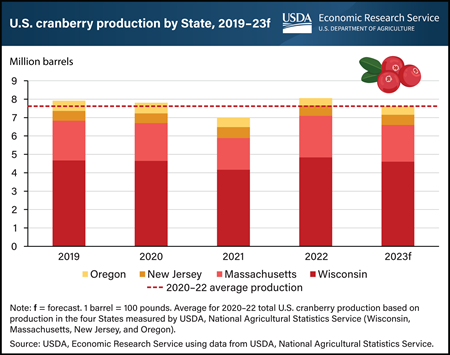
U.S. cranberries are harvested in autumn, just in time for the holiday season. The 2023 U.S. cranberry crop is forecast to be 7.62 million barrels, down 5.4 percent from the previous year, but equal to the 2020–22 average. The top-producing State, Wisconsin, typically harvests around 60 percent of the annual U.S. cranberry crop. In 2023, Wisconsin cranberry production is forecast to be 4.6 million barrels, down 5 percent from 2022. In the most recent growing season, Wisconsin experienced challenging weather, from record snowfall in April to statewide drought in July. Similarly, Massachusetts—the second-largest producing State—experienced weather-related challenges including a cold, frosty spring and excessive precipitation during the summer bloom. Consequently, production for Massachusetts, which typically accounts for around one quarter of the U.S. cranberry crop, is forecast to decline 11.5 percent from last year to 2 million barrels. Similarly, New Jersey’s 2023 cranberry forecast is expected to be about 550,000 barrels, a slight 2-percent decrease from the 2020–22 average on the basis of atypically hot summer temperatures in the State. Unlike the top three States, which are set to experience production declines in 2023, the fourth-largest cranberry producing State, Oregon, is forecast to see production rise by 17.5 percent from 2022 to 470,000 barrels. This chart is based on the USDA, Economic Research Service Fruit and Tree Nuts Outlook Report, released September 2023.
Tuesday, November 21, 2023
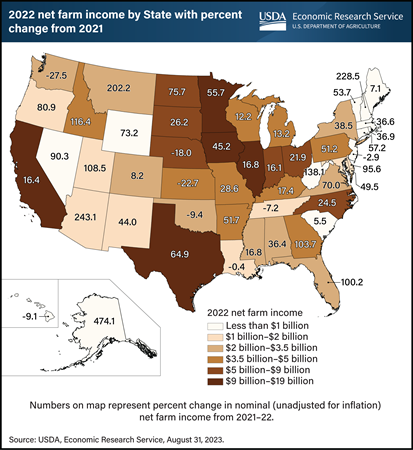
The United States saw growth of 30.7 percent in net farm income (NFI) from 2021 to 2022. NFI is a broad measure of farm sector profitability that incorporates noncash items such as depreciation and gross imputed rental income. Researchers with USDA, Economic Research Service (ERS) used data in the Farm Income and Wealth Statistics to classify States into six categories based on 2022 NFI. Among the 5 agricultural States with the highest NFI, Texas had the highest NFI growth at 64.9 percent from 2021 to 2022, followed by Minnesota with 55.7 percent. Growth in the remaining top five States (California, Iowa, and Illinois) also was strong. Other States among the top 25 for average NFI had a wide range of NFI change from 2021 to 2022. Many showed strong growth, such as Idaho (116.4 percent), Georgia (103.7 percent), Florida (100.2 percent), and North Dakota (75.7 percent). However, NFI in Kansas and Washington fell 22.7 percent and 27.5 percent, respectively. Find additional information and analysis on the ERS topic page for Farm Economy.
Monday, November 20, 2023
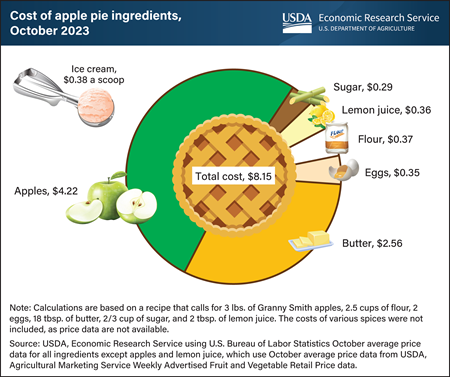
U.S. consumers baking a homemade apple pie for Thanksgiving this year can expect to pay about $8.15 for the ingredients, a decrease of 7.0 percent from last year. Price increases for flour, sugar, and lemon juice were offset by lower prices for apples, butter, and eggs, leading to a $0.61 decrease in the cost of a pie between 2022 and 2023. The price of the main ingredient, Granny Smith apples, fell 7.5 percent from $1.52 per pound in October 2022 to $1.41 per pound in October 2023. Prices decreased the most for eggs (38.6 percent), followed by butter (6.2 percent), between October 2022 and October 2023. Prices increased the most for lemons (20.0 percent) and sugar (16.0 percent), though those ingredients contribute only a small share to the total cost of a pie. If serving the apple pie à la mode, ice cream adds an additional $0.38 per scoop, an increase of $0.02 from last year. The most recent average price data are from October, meaning prices for Thanksgiving week may vary. For example, savings may occur if grocers offer holiday discounts. USDA, Economic Research Service tracks aggregate food category prices and publishes price forecasts in the monthly Food Price Outlook data product, which will next be updated on November 22, 2023.
Thursday, November 16, 2023
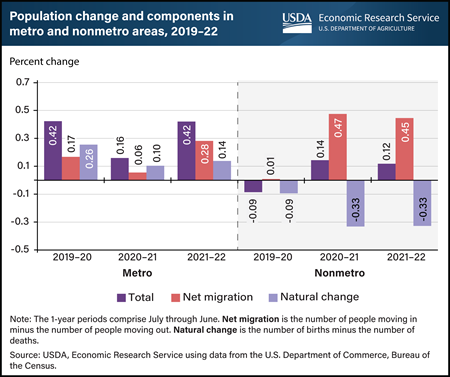
The rural (nonmetro) population growth that began with the Coronavirus (COVID-19) pandemic in 2020 continued into 2022, according to census population estimates. A sharp increase in net migration (the number of people moving in minus the number of people moving out) was the source of the growth. Migration to rural areas was 0.47 percent and 0.45 percent in 2020–21 and 2021–22, respectively, compared with 0.01 percent in the period before the pandemic. Overall, the rural population grew at 0.12 percent from mid-2021 through mid-2022 after accounting for the 0.33-percent decline caused by natural decrease (more deaths than births) in the same period. For rural areas, this recent growth is a reversal of population loss and near-zero migration in 2019–20 and comes after annual rural growth rates declined or were near zero in the previous 10 years. The population in metro areas followed a different trend in 2019–20 and 2020–21, dropping from 0.42 to 0.16 percent growth before returning to 0.42 percent in 2021–22. Roughly 46 million U.S. residents lived in rural areas in July 2022, making up 13.8 percent of the population. This chart is drawn from the ERS report Rural America at a Glance, published in November 2023.
Wednesday, November 15, 2023
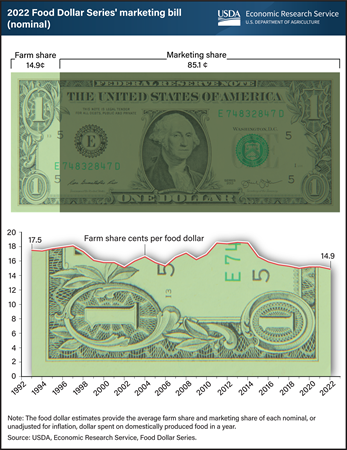
U.S. farm establishments received 14.9 cents per dollar spent on domestically produced food in 2022 as compensation for farm commodity production. This portion, called the farm share, is a decrease of 0.3 cents from a revised 15.2 cents in 2021. The farm share covers operating expenses as well as input costs from nonfarm establishments. The remaining portion of the food dollar, known as the marketing share, covers the costs of getting domestically produced food from farms to points of purchase, including costs related to transporting, processing, and selling to consumers. One of the factors behind the long-term downward trend in the farm share is an increasing proportion of food-away-from-home spending. Farm establishments receive a lower portion of dollars spent on food away from home because of the added costs of preparing and serving meals. The USDA, Economic Research Service (ERS) uses input-output analysis to calculate the farm and marketing shares of a food dollar, which is an average of all domestic expenditures on U.S. food. The data for this chart can be found in the ERS Food Dollar Series data product, updated November 15, 2023.
Tuesday, November 14, 2023
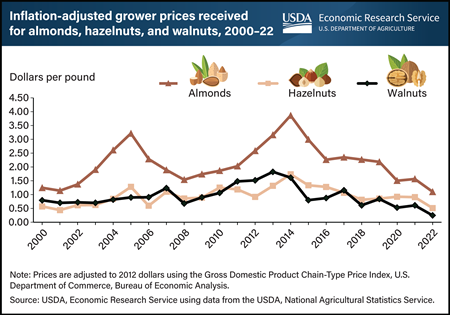
In 2022, tree nut prices fell to their lowest levels in at least two decades. Prices after adjusting for inflation, called real prices, were $1.10 per pound for almonds, $0.51 for hazelnuts, and $0.25 for walnuts. The last time real almond and hazelnut prices were this low was at the turn of the 21st century. Walnut (real) prices are at an all-time low, according to data from the USDA, Economic Research Service. Prior to 2020, the lowest real walnut price recorded was $0.58 per pound in 1999. In 2022, walnut prices were less than half of the previous record low and 14 percent of the high observed in 2013 ($1.82 per pound). Low prices have affected walnut producers’ production decisions. In September 2023, USDA’s National Agricultural Statistics Service forecast that 2023 would be the first year since 1999 that walnut-bearing acreage decreased. Acreage in California, the country’s leading walnut producer, was estimated to have dropped from 400,000 acres in 2022 to 385,000 acres in 2023 and was revised further downward to 375,000 acres in October 2023. Producers have not reduced bearing acreage for almonds or hazelnuts, but prices have decreased since 2014. The decision to reduce acreage stems not only from grower prices but also from a series of conditions growers face that include weather, prices of inputs, and competition from other exporting countries. This chart was drawn from the USDA, Economic Research Service Fruit and Tree Nuts Outlook Report, released September 2023.


