ERS Charts of Note
Subscribe to get highlights from our current and past research, Monday through Friday, or see our privacy policy.
Get the latest charts via email, or on our mobile app for  and
and 
Wednesday, September 3, 2014
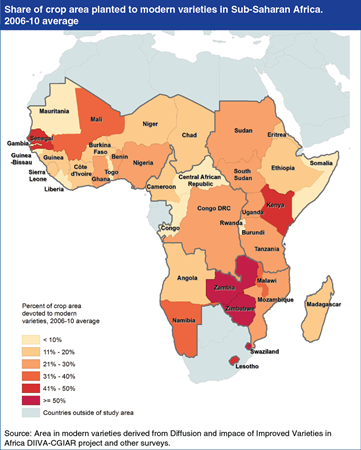
Sub-Saharan Africa (SSA) remains the most food-insecure region in the world, but gains in crop yields associated with increased cultivation of modern varieties are leading to improved food availability and food security conditions. Because domestic grain production accounts for about 80 percent of supplies across SSA and grain yields are among the lowest in the world, boosting yields is key to improving food security in the region. Policy reforms and incentives for farmers have spurred adoption of new technologies, such as modern seed varieties. In Nigeria, Benin, Ghana, Senegal, Malawi, and Zambia, 27-55 percent of crop area was devoted to modern varieties in 2006-10; in each of these countries, grain yields have increased between 4 and 16 percent per year. Scenario analysis indicates the potential for significant additional improvements in SSA food security if more countries are able to increase adoption of modern crop varieties. This chart and analysis is based on Productivity Impacts on Food Security in Sub-Saharan Africa, an article in International Food Security Assessment, 2014-2024.
Monday, July 7, 2014
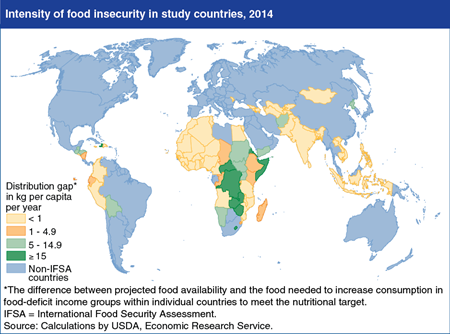
A recent ERS international food security assessment indicates that Sub-Saharan Africa remains the most food-insecure region in the world, although the region shows significant improvement over previous assessments. The share of the population that is food insecure is projected to decline to under 30 percent in 2014, compared with 50 percent or more of the population estimated to be food insecure in the late 1990s. Estimates of the distribution gap—the amount of additional food needed to increase per capita consumption in all income groups to the nutritional target of about 2,100 calories per day—show that the overall gap for the region will decline about 17 percent in 2014. However, the intensity of food insecurity in Sub-Saharan Africa—measured by the distribution gap—is expected to remain high relative to other regions studied. The overall improvement in food security in the region in 2014 is primarily due to the outlook for increased grain production. The ERS assessment also foresees improved food security conditions in 2014 in Asia and the Latin America and Caribbean region, as well as improvements in the generally food-secure conditions in North Africa. Find this chart and additional analysis in International Food Security Assessment, 2014-2024.
_450px.png?v=1782.8)
Monday, May 5, 2014
Productivity growth in agriculture enables farmers to produce a greater abundance of food at lower prices, using fewer resources. A broad measure of agricultural productivity performance is total factor productivity (TFP). Unlike other commonly used productivity indicators like yield per acre, TFP takes into account a much broader set of inputs—including land, labor, capital, and materials—used in agricultural production. ERS analysis finds that globally, agricultural TFP growth accelerated in recent decades, largely because of improving productivity in developing countries and the transition economies of the former Soviet Union and Eastern Europe. During 2001-2010, agricultural TFP growth in North America and the transition economies offset declining input use to keep agricultural output growing. By contrast, declining input use in Europe offset growing TFP, resulting in a slight decline in agricultural output over the decade. In most regions of the developing world, improvements in TFP are now more important than expansion of inputs as a source of growth in agricultural production. Sub-Saharan Africa is the only major region of the world where growth in agricultural inputs accounts for a higher share of output growth than growth in TFP. This chart is based on the table found in “Growth in Global Agricultural Productivity: An Update,” in the November 2013 Amber Waves online magazine, and the ERS data product on International Agricultural Productivity.
Thursday, February 6, 2014
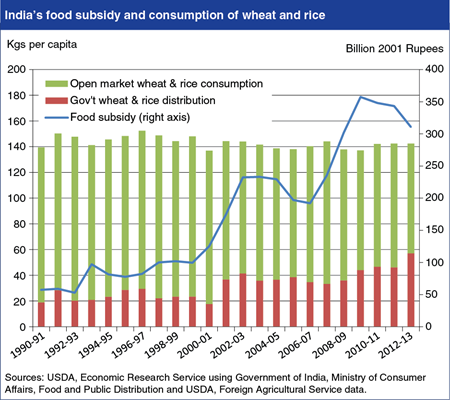
The cost of India’s food subsidy policy has increased significantly since 2000, reaching about $13.5 billion annually in 2011/12 (April/March Indian fiscal year). The rising cost has been driven by higher support prices to farmers, unchanged issue prices for subsidized wheat and rice distributed through the government’s Targeted Public Distribution System (TPDS), and the cost of storing rising stocks. Per capita wheat and rice consumption has changed little, although TPDS grain now accounts for a larger share of consumption, potentially increasing the ability of recipients to buy other foods. Assessments of the TPDS indicate substantial leakages in the delivery of grains that have prevented many households from purchasing their full ration. India’s new National Food Security Act (NFSA), signed into law in September of 2013, aims to expand the share of households eligible for the most preferential subsidized prices and also implement a number of safeguards to improve the distribution of food grains. Whether reforms under the new legislation will have a significant impact on food and nutrition security given the historically poor functioning of distribution programs in a number of Indian states remains uncertain. Find this chart and additional analysis in “India Continues to Grapple with Food Insecurity” in the February 2014 Amber Waves.
Wednesday, December 4, 2013
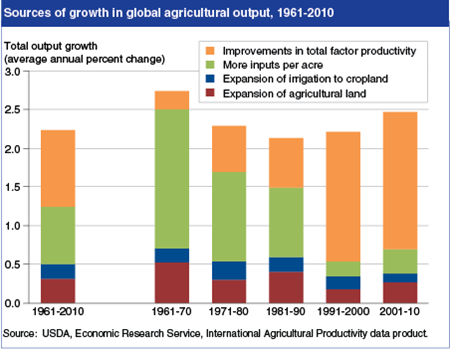
The average annual rate of global agricultural growth slowed in the 1970s and 1980s but then accelerated in the 1990s and 2000s. In the decades prior to 1990, most output growth came about from intensification of input use (i.e., using more labor, capital, and material inputs per acre of agricultural land). Bringing new land into agriculture production and extending irrigation to existing agricultural land were also important sources of growth. Over the last two decades, however, the rate of growth in agricultural resources (land, labor, capital, etc.) slowed. In 2001-10, improvements in productivity—getting more output from existing resources—accounted for more than three-quarters of the total growth in global agricultural output, reflecting the use of new technology and changes in management by agricultural producers around the world. This chart is found in the ERS data product, International Agricultural Productivity, on the ERS website, updated November 2013.
Friday, November 15, 2013
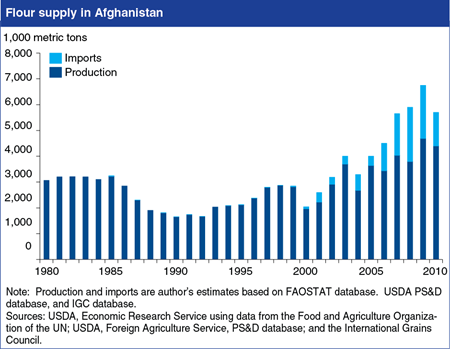
Afghanistan is among the world’s largest importers of wheat flour, with imports growing since 2000 because of a recovery in internal demand, and inadequate water supplies that continue to limit domestic wheat production. Afghan flour production—the nation’s largest official agro-industry—faces competition from imported flour, much of it from neighboring Pakistan where wheat producers and flour millers benefit from Government support. Efforts to support Afghanistan’s flour-milling sector by increasing border protections on flour and wheat—if enforceable along the country’s rugged borders—would have uncertain impact on water-constrained wheat production, and impose higher costs on consumers. Unhindered wheat and flour imports, including imports from Pakistan, may support growth in domestic flour consumption, with relatively small losses in farm output. This chart appears in Afghanistan’s Wheat Flour Market: Policies and Prospects.
Monday, July 1, 2013
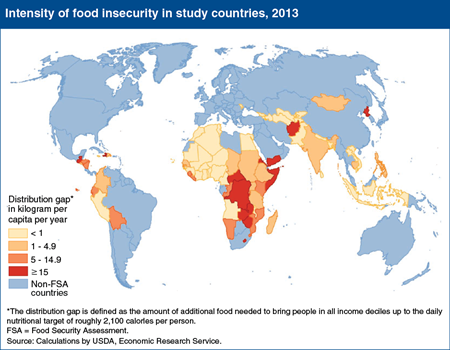
ERS analysis of global food insecurity covering 76 low- and middle-income countries estimates the food-insecure population at about 707 million in 2013, virtually unchanged from 704 million in 2012. The share of the population that is food insecure in these countries is expected to decrease from about 21 percent in 2012 to 20 percent in 2013. The intensity of food insecurity—as measured by the per capita distribution gap—is estimated to remain the highest in Sub-Saharan Africa and the lowest in North Africa and Asia. The assessment accounts for changes in production and import capacity that affect food availability, as well as the distribution of food across income groups. For the analysis, food insecurity is defined as daily per capita consumption below a target of 2,100 calories, and the per capita distribution gap estimates of the amount of food needed to raise consumption in each income group to the nutritional target. This chart appears in International Food Security Assessment, 2013-23, GFA-24.
Tuesday, June 18, 2013
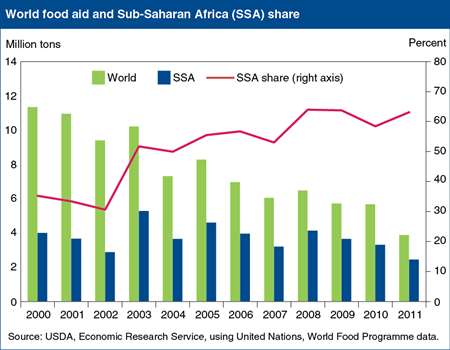
The volume of world food aid has generally declined since 2000, falling from an average of 10.6 million tons annually during 2000-02 to 5.1 million tons during 2009-11. In 2011, according to data from the United Nations’ World Food Programme, world food aid dipped below 4 million tons, the lowest since 2000. Since 2000, the share of world food aid shipped to Sub-Saharan Africa has increased, rising from about 35 percent in the early 2000s to more than 60 percent in recent years. In 2011, however, food aid to Sub-Saharan Africa reached a low of 2.5 million tons, after ranging between about 3 and 5 million tons annually during 2000-10. According to ERS’s International Food Security Assessment, 2013-2023, Sub-Saharan Africa remains the most food insecure region in the world. Key factors are inability to sustain gains in production ahead of relatively high rates of population growth and limited capacity to import food commercially. This chart is adapted from one that can be found in International Food Security Assessment, 2013-2023.
Thursday, May 9, 2013
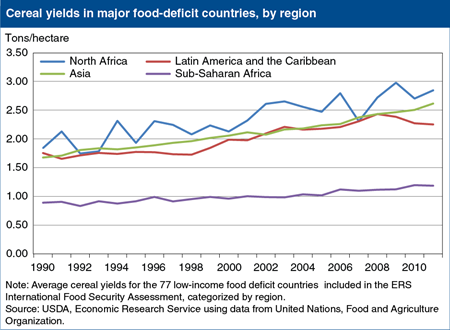
Yields, along with crop area, determine the supply of domestically produced cereals, a crucial factor in determining food insecurity. Cereal yields recently have begun to increase in Sub-Saharan Africa, although from very low levels. The region’s yields remain less than half of average yields found in other lower income regions around the world that are included in the annual ERS International Food Security Assessment. This report uses a model that projects food availability and access in 76 lower income countries in 4 regions: Sub-Saharan Africa, Asia, Latin America and the Caribbean, and North Africa. Many lower income countries have been unable to increase food production at the same rate as growth in their populations, turning to imports to fill the gap. In view of recent price spikes for grains governments and international organizations alike have renewed their focus on the importance of raising yields through increased research and support for inputs. This chart appears in "Global Food Security, A Goal, A Challenge" in the February 2013 issue of ERS's Amber Waves magazine tablet version.
Wednesday, May 1, 2013
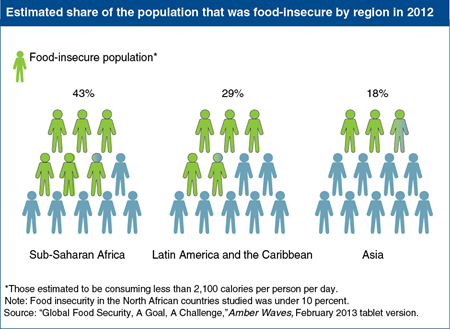
Sub-Saharan Africa continues to be the region with the largest share of food insecure people according to estimates for 2012 based on the USDA-ERS International Food Security Assessment model. The model projects food availability and access in 76 lower income countries in 4 regions: Sub-Saharan Africa, Asia, Latin America and the Caribbean, and North Africa. A person is considered food insecure if estimated consumption levels are below an average 2,100 calories per capita per day. Strong economic growth in recent years has contributed to improvements in food security across the globe, but food insecurity in Sub-Saharan Africa remains at relatively high levels, followed by the Latin America and Caribbean region and Asia. Food insecurity in North Africa was estimated at below 10 percent. This chart is based on estimates in International Food Security Assessment, 2012-22 (GFA-23) and appears in the February 2013 issue of ERS's Amber Waves tablet version.
Monday, February 25, 2013
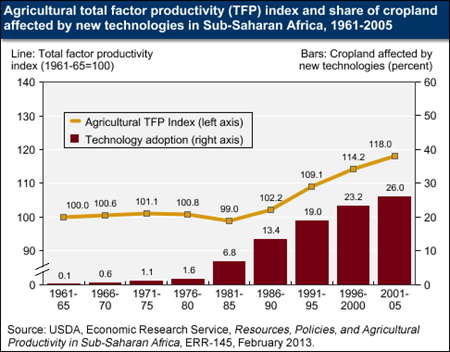
Agricultural productivity growth is a critical factor in controlling the economic and environmental costs of feeding the world’s growing population. New ERS research finds that agricultural productivity in Sub-Saharan Africa has been growing by about one percent per year since the 1980s. A major driver has been adoption of new agricultural technologies developed through agricultural research. Investment by the CGAIR Consortium of international agricultural research centers has been particularly important, providing about $6 in productivity impacts for every $1 spent by these centers on research. However, rates of new technology adoption and agricultural productivity in Sub-Saharan Africa are still low relative to other developing countries. Resource degradation, policies that reduce economic incentives to farmers, the spread of HIV/AIDS, armed conflicts, and low national research and extension capacity have hindered agricultural productivity improvement in the region. This chart is based on the ERS report, Resources, Policies and Agricultural Productivity in Sub-Saharan Africa, ERR-145, released February 2013.
Monday, October 29, 2012
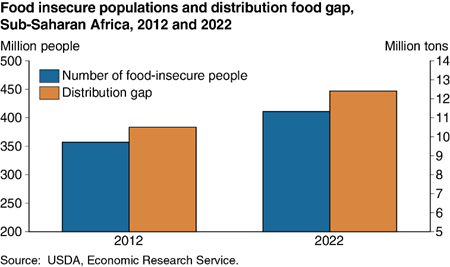
In recent years, the real gross domestic product in Sub-Saharan Africa (SSA) has grown 5 to 6 percent per year, among the highest regional growth rates in the world. In most countries in the region, even food production has grown on a per capita basis, an outcome that seemed unreachable a decade ago. However, at the aggregate level, the number of food-insecure people (those consuming less than 2,100 calories per day) in SSA is projected to rise over the next decade. The food distribution gap, which takes into account unequal purchasing power within countries by measuring the amount of food needed to raise consumption in each income decile to the nutritional target of approximately 2,100 calories per person per day, is also projected to rise. However, both of these indicators are expected to grow more slowly than the region's population, and the share of the region's population that is food insecure is projected to fall. This chart appears in "Factors Affecting Food Production Growth in Sub-Saharan Africa" in the September 2012 issue of ERS's Amber Waves magazine.
Thursday, August 23, 2012
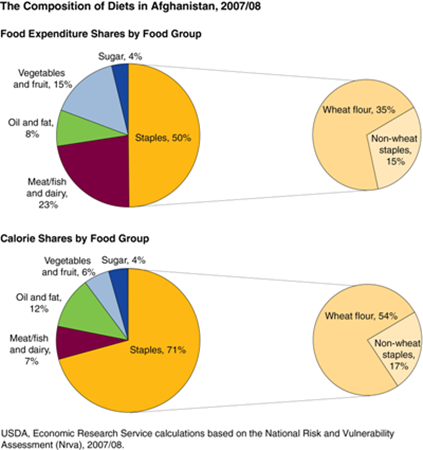
Increases in the prices of staple foods can have serious effects for households living at or near subsistence levels. Over the past few years, increases in global food prices have led to an erosion of purchasing power in many developing countries, where the poor often spend the majority of their budgets on food. Staple foods make up 50 percent of household food expenditures and 71 percent of daily calorie intake in Afghanistan. Wheat flour, which doubled in price between December 2007 and July 2008, is the primary staple food in Afghanistan; it alone accounts for 54 percent of daily calories per capita and 35 percent of household food expenditures. The differences in the calorie and expenditure shares reflect price differences between food groups. The cheapest foods--in terms of calories per Afghani (the local currency)--are grains and pulses. For 1 Afghani (approximately 2 cents), a household can purchase approximately 184 calories of wheat flour, 106 calories of lentils, or 78 calories of rice. In contrast, meat and vegetables are the most expensive; one Afghani purchases only 9 calories of beef or 10 calories of cucumber. These charts are found in the ERS report, International Food Security Assessment, 2012-22, GFA-23, July 2012. Additional information can also be found in "Rising Food Prices and Declining Food Security: Evidence From Afghanistan" in Amber Waves, September 2011.
Wednesday, July 25, 2012
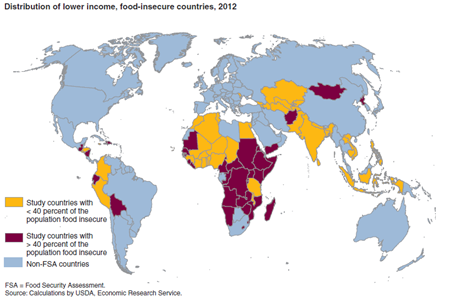
Nearly 400 million people in the 39 Sub-Saharan African countries analyzed by ERS are estimated to suffer from food insecurity in 2012. This equals 42 percent of the population of these countries. By contrast, 30 percent of the population in the 11 Latin American and Caribbean countries examined are food insecure. An estimated 18 percent of the population in the 22 Asian countries studied are food insecure. People are defined as food insecure when their estimated food availability falls below 2,100 calories per day. This map is found in the ERS report, International Food Security Assessment, 2012-22, GFA-23, July 2012.
Friday, July 20, 2012
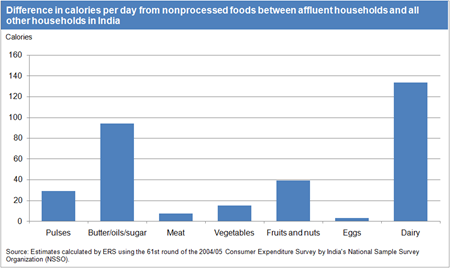
Policymakers and researchers are increasingly concerned with assessing the worldwide food-insecure population and the ways it may be changing. A common denominator in different approaches to assessing food insecurity is the measurement of calories consumed. A recent ERS analysis focuses on India, the country with the largest food-insecure population in the world. Despite India's rapid income growth over the past two decades, current estimates of the number of food-insecure people derived from aggregate production, trade, and income distribution data suggest that the country accounts for nearly 40 percent of the world's food-insecure population. For nonprocessed foods, India's affluent households (with income in the top 10th percentile) purchase an average of 315 more calories than all other households and also purchase significantly more expensive calories. Regardless of income level, the majority of nonprocessed calories purchased are derived from grain products and the amount of calories from grains is nearly identical. However, more affluent households purchased significantly more calories in every other food category. The data for this chart come from Estimating the Range of Food-Insecure Households in India, ERR-133, May 2012.
Monday, May 14, 2012
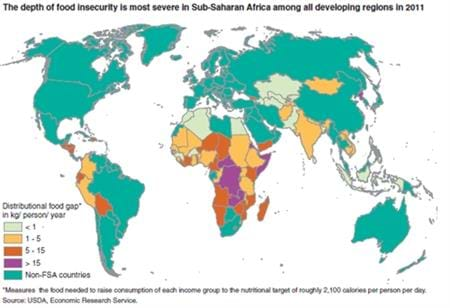
Despite recent gains in production, food insecurity remains most severe in Sub-Saharan Africa because of a combination of inadequate domestic production, population growth, uneven distribution of food, and weak import capacity. Although Asia, particularly India and Bangladesh, accounts for similar numbers of food insecure people as Sub-Saharan Africa, the size of distributional food gaps* (see definition in chart) are estimated to be smaller. Relatively severe food insecurity also persists in a few Central American and Caribbean countries, largely due to the skewed distribution of income, the impact of volatile weather on domestic production, and higher food prices. This map is found in the ERS report, International Food Security Assessment, 2011-21, GFA-22, July 2011.
Wednesday, July 27, 2011
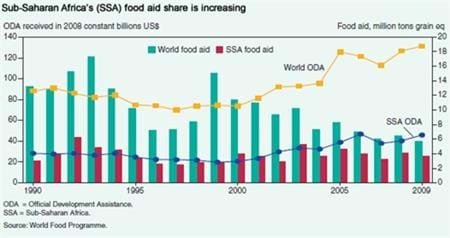
Food aid continues to be an important resource to combat food insecurity in developing economies, particularly during emergency situations. The quantity of food aid, however, continues to decline. Food aid shipments averaged about 15 million tons (in grain equivalent) in the early 1990s before declining to 5.8 million tons in 2009. Despite this declining trend, targeting of food aid to needy countries appears to have improved. The clear case in point is the increase in share of global food aid to Sub-Saharan Africa (SSA), the region most vulnerable to food insecurity. During 1990-94, SSA's share of total food aid was in the range of 23 to 40 percent. During 2006-09, this share increased to a range of 53 to 64 percent. In absolute terms, however, the quantity of food aid the region received declined, albeit not at as rapid a pace as the decline in global food aid-a decline of 17 percent versus 57 percent. This chart is from the ERS publication, International Food Security Assessment, 2011-21, GFA-22, July 2011.


