ERS Charts of Note
Subscribe to get highlights from our current and past research, Monday through Friday, or see our privacy policy.
Get the latest charts via email, or on our mobile app for  and
and 
Friday, July 18, 2014
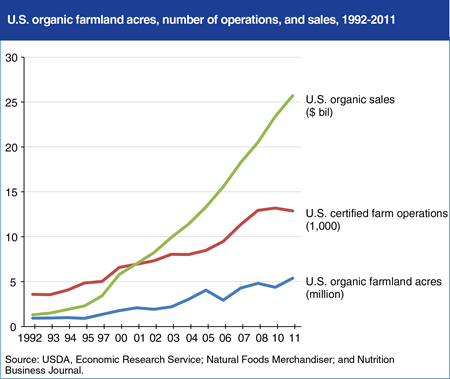
U.S. organic food sales have shown double-digit growth during most years since the 1990s and were estimated to have reached over $34 billion in 2013. According to the Nutrition Business Journal, organic food purchases now account for approximately 4 percent of total at-home U.S. food sales. Certified organic farmland has also expanded, although not as fast as organic sales, as organic production of acreage-extensive feed grains and oilseed crops has lagged growth in other organic sectors. Fresh produce is still the top organic sales category, and California and other States that grow these high-value organic crops have experienced growth in organic acreage since the 1990s. Overall, acreage used for organic agriculture accounted for 0.6 percent of all U.S. farmland in 2011 (0.5 percent of all U.S. pasture and 0.8 percent of all U.S. cropland). Major retailer initiatives to expand the number of organic products they sell could further boost demand. The 2014 Farm Act includes provisions to expand organic research, assist with organic certification costs, and provide other support for U.S. organic producers. This chart is found in “Support for the Organic Sector Expands in the 2014 Farm Act” in the July 2014 Amber Waves online magazine.
Friday, June 27, 2014
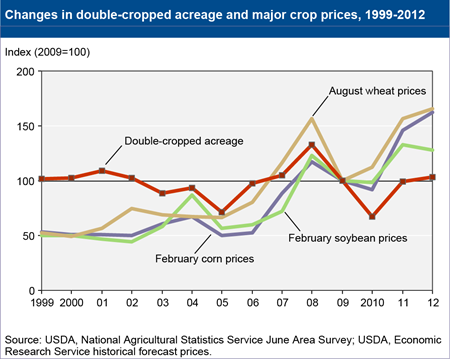
Double-cropped acreage has varied from year to year. Because decisions about double cropping are made annually, fluctuations are likely as farmers respond to changing market and weather conditions. For example, higher commodity prices give farmers more incentive to intensify production and could offset revenue shortfalls from lower potential yields when double cropping. From 2004 to 2012, total double-cropped acreage roughly paralleled soybean, winter wheat, and corn prices. When commodity prices at the time of planting decisions were increasing or relatively high, total double-cropped acreage also increased. Total double-cropped acreage peaked at 10.9 million acres in 2008, when prices for soybeans, winter wheat, and corn also peaked. In 2005 and 2010, nearly every region witnessed declines in double-cropped acreage amid commodity price declines. This chart is found in the ERS report, Multi-Cropping Practices: Recent Trends in Double-Cropping, EIB-125, May 2014.
Thursday, May 29, 2014
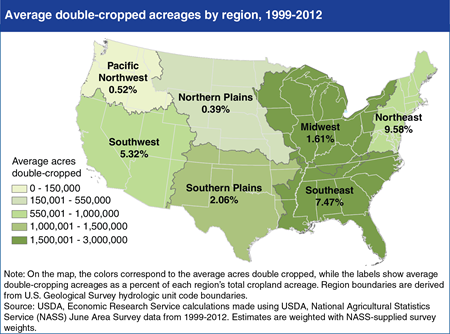
Over the last decade, growing demand for agricultural commodities—for both food and fuel—has increased the incentives for farm operators to raise production. Double cropping, the harvest of two crops from the same field in a given year, has drawn interest as a method to intensify production without expanding acreage. In the U.S., the prevalence of double cropping varies by region. The variation across regions reflects farmers’ response to local conditions such as weather, climate (particularly growing season length), policy differences, and market incentives. The Southeast, Midwest, and Southern Plains regions lead the country in total double-cropped acreage. About one-third of the total double-cropped acreage over 1999-2012 was in the Southeast (2.7 million acres on average), and slightly more than one-fifth was in the Midwest (1.8 million acres on average). However, relative to each region’s total cropland acreage, the Northeast, Southeast, and Southwest all have larger shares of cropland used in double cropping than other regions. The Northeast had the largest share of double-cropped acreage (nearly 10 percent, on average) of the region’s total cropland, and the Northern Plains had the smallest (less than 0.5 percent on average). This chart is found in the ERS report, Multi-Cropping Practices: Recent Trends in Double-Cropping, EIB-125, May 2014.
Wednesday, May 21, 2014
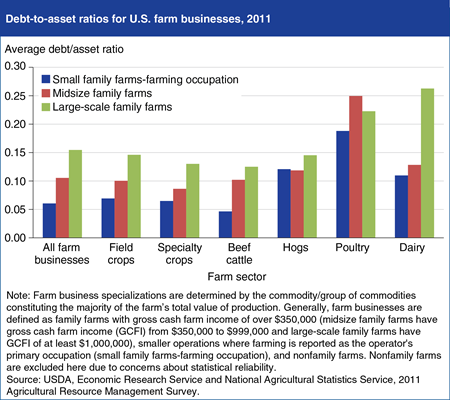
Debt use varies with a farm’s commodity specialization, as financing requirements to manage a farm business differ by commodity. Debt-to-asset ratios are a key measure of a farm’s leverage, the degree to which farm assets are financed by debt. Although several measures are necessary to evaluate the financial health of a farm operation, the debt-to-asset ratio is a widely used measure of risk of loan default. Debt-to-asset ratios tend to increase as farm size increases, and they also vary by farm specialization. Large-scale family farms specializing in dairy, and all sizes of poultry farm businesses, are generally more leveraged than farms specializing in the production of other commodities. These specializations generally face higher capital costs, which contribute to increased debt use. Farm businesses specializing in field crops, specialty crops, and beef have the lowest debt-to-asset ratios. This chart is found in “Farm Businesses Well-Positioned Financially, Despite Rising Debt” in the April 2014 Amber Waves magazine.
Wednesday, April 9, 2014
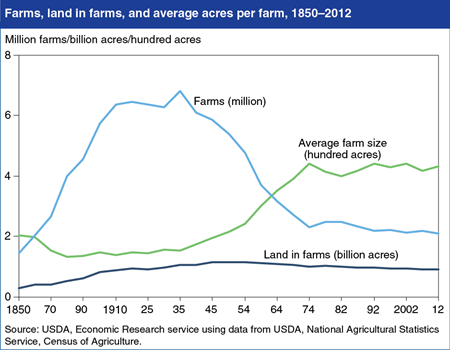
After peaking at 6.8 million farms in 1935, the number of U.S. farms fell sharply until leveling off in the early 1970s. Falling farm numbers during this period reflected growing productivity in agriculture and increased nonfarm employment opportunities. Because the amount of farmland did not decrease as much as the number of farms, the remaining farms have more acreage—on average, about 430 acres in 2012 versus 155 acres in 1935. Preliminary data from the recently released Census of Agriculture show that in 2012, the United States had 2.1 million farms–down 4.3 percent from the previous Census in 2007. Between 2007 and 2012, the amount of land in farms in the United States continued a slow downward trend, declining from 922 million acres to 915 million. This chart is found in the ERS chart collection, Ag and Food Statistics: Charting the Essentials, updated April 8, 2014.
Friday, February 28, 2014
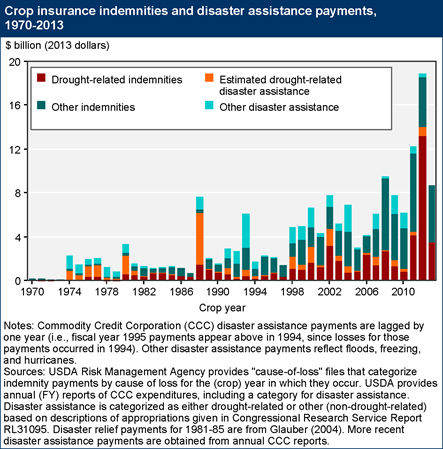
Drought is the leading single cause of production losses to crop farms, followed by excess moisture, hail, freezes, and heat. Over the past four decades, a portion of the farm losses from all these weather-related causes have been covered by a combination of crop insurance and disaster assistance payments. Over this period, crop insurance has gradually grown in significance and is now a major component of the Federal safety net for crop farmers. The rise in total insurance indemnity payments is due to a combination of expanded enrollment in crop insurance, increased liabilities due to higher yields and commodity prices, and a series of major droughts in recent decades, capped by the 2012 drought. More than 80 percent of the acres of major field crops planted in the United States are now covered by Federal crop insurance, which can help to mitigate yield or revenue losses for covered farms. Droughts also have a major impact on livestock producers, principally through their effect on feed prices. (The accompanying chart does not include livestock-related assistance or pasture/rangeland indemnity payments.) This chart updates one found in The Role of Conservation Programs in Drought Risk Adaptation, ERR-148, April 2013.
Friday, February 21, 2014
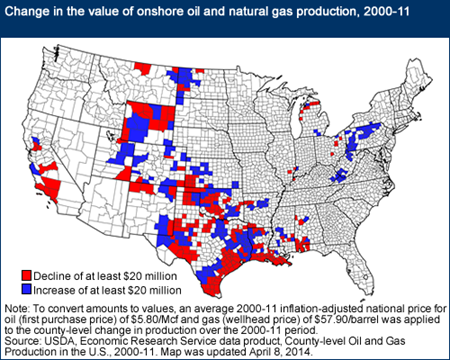
From 2000 to 2011, onshore gross withdrawals of natural gas in the lower 48 States increased by about 47 percent, reaching historic highs in every year after 2006. Over the same period, withdrawals of oil increased by 11 percent, with much of that growth occurring between 2007 and 2011. Rural counties (nonmetro noncore) accounted for almost all of the growth in oil production and a large share of the growth in gas production based on newly released data from ERS on County-level Oil and Gas Production in the U.S. While just over 35 percent of counties in the lower 48 States reported some level of oil or natural gas production during 2000-11, sizeable changes in production levels were more concentrated. Interestingly, the number of counties with an increase in oil and gas production of $20 million or more over the decade (218 counties) was nearly the same as the number (212) with a decrease of $20 million or more. This map is found in the Documentation and Maps page of the data product County-level Oil and Gas Production in the U.S., and also in the Amber Waves article, "Onshore Oil and Gas Development in the Lower 48 States: Introducing a County-Level Database of Production for 2000-2011."
Friday, August 23, 2013
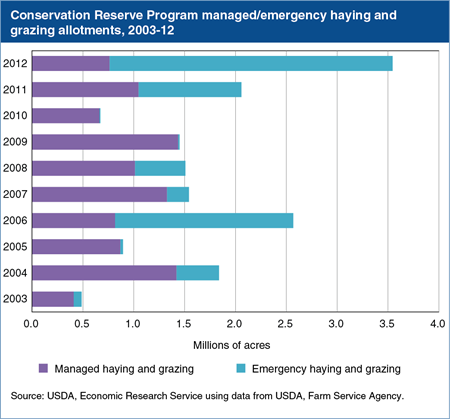
USDA’s Conservation Reserve Program (CRP) engages farmers in long-term (10- to 15-year) contracts to establish conservation covers on environmentally sensitive land. As of June 2013, about 27 million acres of farmland were enrolled in the program. An important provision within CRP is that under certain circumstances, farmers can utilize their CRP lands for managed or emergency haying and grazing. The haying and grazing of CRP land can provide important benefits to farmers, particularly during major droughts when other sources of livestock feed are scarce, and, if done correctly, can also improve the environmental value of the conservation covers. During the 2012 drought, farmers conducted emergency haying and grazing on almost 2.8 million acres and managed haying and grazing on another 700,000 acres. This chart is found in the Amber Waves article, “The Role of Conservation Program Design in Drought-Risk Adaptation,” July 2013.
Monday, May 20, 2013
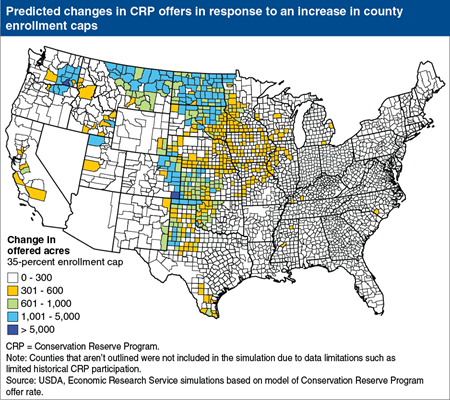
Farmers can adapt to their local climate in many ways, including through participation in USDA programs. In regions of the country that face higher levels of drought risk, farmers are more likely to offer eligible land for enrollment in the Conservation Reserve Program (CRP). As a consequence, CRP is both more competitive in these regions and drought-prone counties are more likely to face a binding CRP acreage enrollment cap. When counties are near their enrollment cap, farms are less likely to offer eligible land for CRP because those offers are less likely to be accepted for enrollment. In simulations of offer rates based on observed historical data, a national increase in the county CRP acreage enrollment cap to 35 percent of cropland in each county (from the current level of 25 percent), results in more offers from eligible farmers in drought prone regions of the Great Plains and the Intermountain West. This map is found in the ERS report, The Role of Conservation Programs in Drought Risk Adaptation, ERR-148, April 2013.
Thursday, April 4, 2013
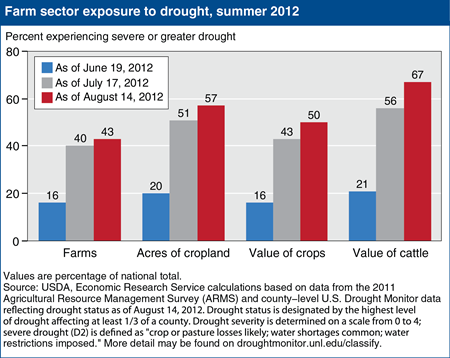
As of mid-August 2012, 43 percent of farms in the United States were experiencing severe or greater levels of drought and another 17 percent were facing moderate levels of drought (for a description of severity levels, see droughtmonitor.unl.edu/classify). A striking aspect of the 2012 drought was how the drought rapidly increased in severity in early July, during a critical time of crop development for corn and other commodities. The chart shows the progression from mid-June to mid-August of severe or greater drought within the agricultural sector. While drought conditions eased some during early September, for most crop production, exposure to drought during June-August determined the drought’s impact on agricultural production. From mid-June to mid-August, the share of farms under severe or greater drought increased from 16 to 43 percent of all farms. Total cropland under severe or greater drought increased from 20 to 57 percent, while total value of crops exposed increased from 16 to 50 percent. As of mid-July, areas with over half of the value of cattle production were already exposed to severe drought; by mid-August, almost two-thirds were exposed. This chart is based on the table found in U.S. Drought 2012: Farm and Food Impacts on the ERS website, updated March 2013.
Thursday, February 28, 2013
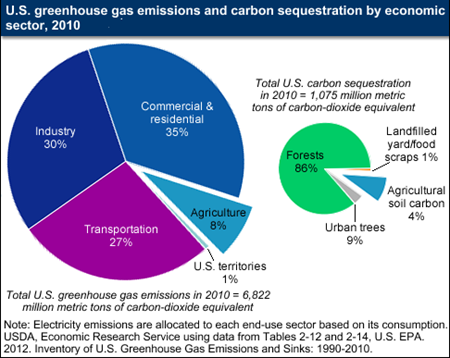
Agriculture (including on-farm energy emissions) accounted for about 8 percent of U.S. greenhouse gas (GHG) emissions in 2010. Since farm production represents about 1 percent of total U.S. gross domestic product (in real gross value-added terms), the sector is relatively GHG-intensive. In all U.S. sectors except agriculture, the largest contributor to GHG emissions is fossil fuel combustion for energy. In agriculture, crop and livestock activities are unique sources of nitrous oxide and methane emissions, notably from soil nutrient management, enteric fermentation (a normal digestive process in animals that produces methane), and manure management. These emissions dominate the contribution of energy related emissions in the sector. The land-based activities of agriculture—as well as forestry—also have the unique capacity to withdraw (“sequester”) carbon dioxide (CO2) from the atmosphere and store it in soil and biomass sinks through activities such as no-till on cropland or land use change from croplands to grasslands. EPA estimates that U.S. carbon land-sinks offset close to 15.8 percent of total U.S. emissions in 2010. Agriculture provided 4 percent of U.S. sinks in 2010. This chart updates one found in the ERS report, Economics of Sequestering Carbon in the U.S. Agricultural Sector, TB-1909, March 2004.
Monday, December 31, 2012
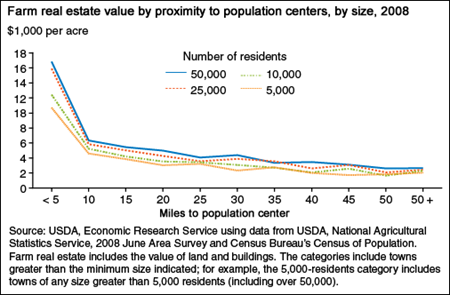
Over the last decade, most regions of the country experienced a boom-and-bust cycle in housing values. Because farmland is often the source of land used for new residential construction, changes in housing markets can affect farmland values. The value of farm real estate is typically highest for farmland located less than 10 miles from the borders of a population center, and then tapers off at greater distances. Further, farm real estate values are higher for farmland near larger cities. For example, the average value in 2008 for agricultural parcels within 5 miles of a city of at least 50,000 residents is approximately $16,801 per acre, while the average value for parcels within 5 miles of a town with at least 5,000 residents is $10,705. While the effects of the housing downturn may have the largest impacts on farmland near population centers, residential housing exists even in the most rural areas—so changes in rural housing markets have the potential to affect the values of far more farmland. This chart is found in "Farmland Values on the Rise: 2000-2010" in the September 2012 issue of ERS's Amber Waves magazine.
Monday, November 26, 2012
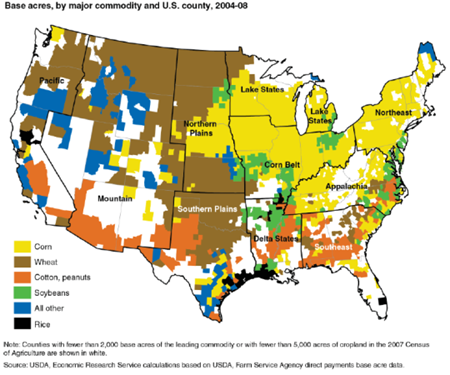
Direct payments are farm program payments that are based on historical cropping patterns of major commodities, or "base acres," with per-acre rates fixed in legislation and not linked to current production or market prices. Direct payments per acre vary significantly by commodity. In 2008, rice and peanuts received the largest direct payments per acre ($96.25 and $45.85, respectively). Rice base acres were predominant in a few counties along the Gulf Coast and in the Pacific region, while peanut base acres were concentrated in the Southeast. Corn, wheat, and soybeans accounted for more than 80 percent of total base acres in 2008, but received lower direct payments per acre ($24.39 per acre, $15.21 per acre, and $11.54 per acre, respectively). Corn base acres dominated in the Corn Belt, Lake States, the Northeast and Appalachia while wheat base acres were prevalent in the Northern and Southern Plains as well as parts of the Mountain region. This chart is found in the ERS report, Potential Farm-Level Effects of Eliminating Direct Payments, EIB-103, November 2012.
Tuesday, October 9, 2012
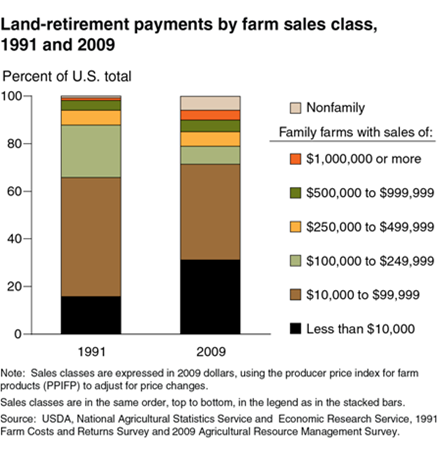
While commodity payments have shifted towards farms with more sales, the situation is different for land-retirement payments, which target environmentally sensitive land and largely come from the Conservation Reserve Program. From 1991 to 2009, family farms with sales less than $10,000 (noncommercial farms) nearly doubled their share of land-retirement payments from 16 percent to 30 percent. Over the same period, the average share of acreage enrolled--the ratio of the acres enrolled to total acres operated--increased from 36 percent to 46 percent for participating noncommercial farms. These increases could be attributed to small farms shifting into the noncommercial class following a substantial land retirement and/or older farmers with small commercial farms scaling their operations down by enrolling in the CRP. This chart comes from Changing Farm Structure and the Distribution of Farm Payments and Federal Crop Insurance, EIB-91, February 2012.
Thursday, September 20, 2012
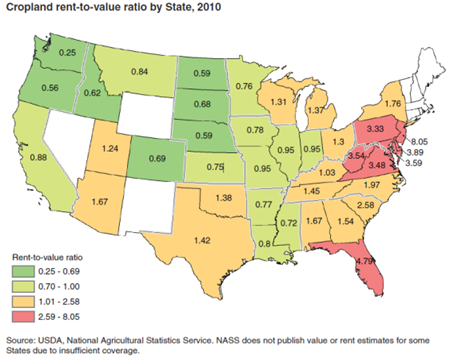
In many areas today, farmland values are influenced by factors other than agricultural productivity, such as urban influence and natural or rural amenities. The capitalized value of expected rents (rental rate divided by 10-year Treasury note) is a broad indicator of the amount of farmland value due to agricultural use. When the ratio of farmland values to capitalized rents exceeds 1.0, it suggests a deviation between the market value of farmland and its implied agricultural use value. In States such as Florida and New Jersey, cropland values greatly exceed their implied agricultural use value. In more rural States such as South Dakota, cropland values are mostly determined by agricultural use. This map can be found in the ERS report, Agricultural Resources and Environmental Indicators, 2012 Edition, EIB-98, August 2012.
Friday, June 22, 2012
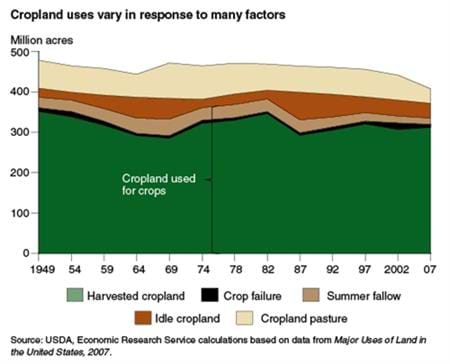
Market forces, changes in farm programs, and changes in technology affect the supply and demand for land used for crop production. Between 1949 and 1969, cropland used for crops decreased by 54 million acres and then peaked at 383 million acres in 1982, when no cropland was diverted through Government-acreage reduction programs. Since 1980, cropland used for crops has been relatively stable, despite significant variation in commodity prices. However, relatively stable patterns of changes in land use at the national level obscure larger shifts in land use at regional and State levels. For example, between 1964 and 2007, cropland used for crops increased by 11 million acres in the Corn Belt and decreased by a net 11 million acres in the remaining regions. Both the Northeast and Southeast experienced a long-term decline in cropland used for crops. Urban pressures and a comparative disadvantage in many crops resulted in the conversion of cropland to other uses in these regions. This chart is found in the March 2012 issue of Amber Waves magazine.
Monday, June 18, 2012
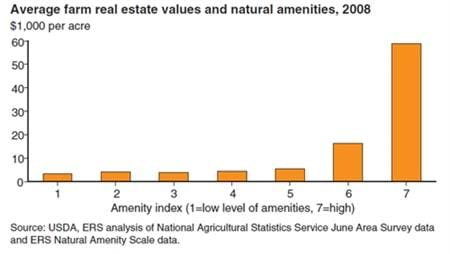
Research suggests that like other land values, farmland values are influenced by the amount and nature of natural amenities, such as scenic views and varied terrain that attract people to an area. ERS' analysis of population changes suggests that high-amenity counties next to metropolitan areas are the most desirable places to live, so high-amenity areas could increase the development value of the land. The Natural Amenities Scale offers a quantitative measure of landscape amenities at the county level for the contiguous United States. The scale, ranging from 1 (low amenity) to 7 (high amenity), is constructed based on the notion that positive natural amenities include mild climate, varied topography, and proximity to surface water, including ponds, lakes, and shoreline. Based on data from 2008, high levels of natural amenities have a large positive effect on farm real estate values, with a mean value per acre of $58,732 at the highest level of the index value. At the lowest levels of natural amenities, mean values are $3,351 per acre. This chart is found in Trends in U.S. Farmland Values and Ownership, EIB-92, February 2012.
Monday, May 7, 2012
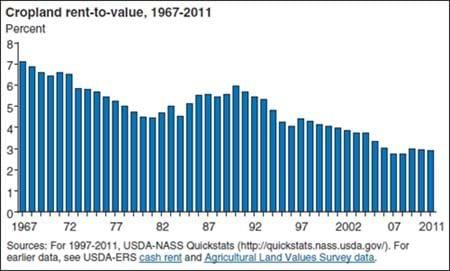
The farmland rent-to-value (RTV) ratio, calculated as the cash rent per acre divided by the land value per acre, is a proxy for how quickly an asset will pay for itself. The roughly 45-year trend reveals a decreasing RTV ratio. If agricultural rents were the sole source of returns from farmland, the farmland would have paid for itself in about 14 years in 1967, but would take more than 34 years in 2011. However, in many places, nonagricultural returns can be earned from the land, such as returns from developing the land. Decreasing RTV ratios are consistent with the growing importance of nonagricultural factors in determining land values. This chart is found in Trends in U.S. Farmland Values and Ownership, EIB-92, February 2012.
Friday, April 20, 2012
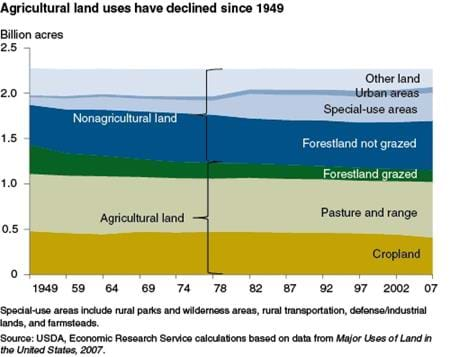
U.S. land area covers nearly 2.3 billion acres. The proportion of the land base in agricultural uses has declined from 63 percent in 1949 to 51 percent in 2007. Gradual declines have occurred in cropland and pasture and range, while grazed forestland has decreased more rapidly. In 2007, 408 million acres of agricultural land were in cropland (down 17 percent from 1949), 614 million acres were in pasture and range (down 3 percent), 127 million acres were in grazed forestland (down 52 percent), and 12 million acres were in farmsteads and farm roads (down 19 percent). Nonagricultural uses increased largely due to a fourfold increase in National Parks and National Wilderness/Wildlife areas, particularly in Alaska. This chart is found in the March 2012 issue of Amber Waves magazine.
Tuesday, April 3, 2012
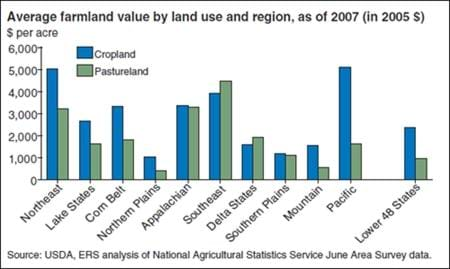
Average farmland values for the Nation mask wide regional variation. Cropland values (the land value excluding buildings) exceeded $5,000 per acre in 2007 in the Northeast and Pacific regions, where high-value crops-fruits, vegetables, and orchards-are grown and development pressures are high. Cropland values in 2007 were only about $1,000 per acre in the Northern Plains, an area dominated by wheat and other row crop farms. In the Southeast region and Delta States, pasture values exceeded cropland values. This chart is found in the ERS report, Trends in U.S. Farmland Values and Ownership, EIB-92, February 2012.


