ERS Charts of Note
Subscribe to get highlights from our current and past research, Monday through Friday, or see our privacy policy.
Get the latest charts via email, or on our mobile app for  and
and 
Friday, March 3, 2017
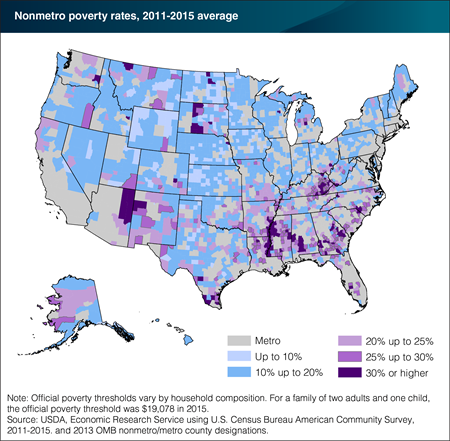
Poverty is not evenly distributed throughout the United States. Americans living in poverty tend to be clustered in certain U.S. regions and counties. Nonmetro (rural) counties with a high incidence of poverty are mainly concentrated in the South, which had an average poverty rate of nearly 22 percent between 2011 and 2015. Rural counties with the most severe poverty are located in historically poor areas of the Southeast—including the Mississippi Delta and Appalachia—as well as on Native American lands, predominantly in the Southwest and North Central Midwest. The incidence of rural poverty is relatively low elsewhere, but generally more widespread than in the past due to a number of factors. For example, declining employment in the manufacturing sector since the 1980s contributed to the spread of poverty in the Midwest and the Northeast. Another factor is rapid growth in Hispanic populations over the 1990s and 2000s—particularly in California, Nevada, Arizona, Colorado, North Carolina, and Georgia. This group tends to be poorer than non-Hispanic whites. Finally, the 2007-09 recession resulted in more widespread rural poverty. This chart appears in the ERS topic page for Rural Poverty & Well-being, updated February 2017.
Wednesday, January 18, 2017
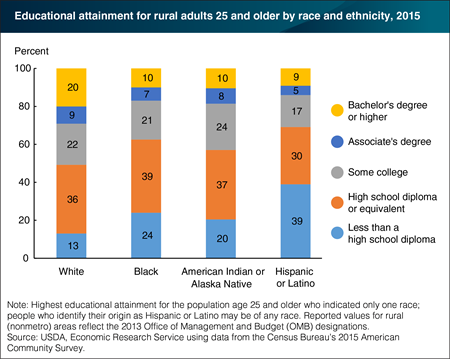
Higher educational attainment is closely tied to economic well-being—through higher earnings, lower unemployment, and lower poverty. While educational attainment in rural America has improved over time, rural areas still lag urban areas in educational attainment. Moreover, within rural areas, educational attainment varies across racial and ethnic categories. In general, minority populations within rural areas have relatively less education. About a quarter of adults age 25 and over in the rural Black population, 20 percent of Native Americans/Alaska Natives, and almost 40 percent of rural Hispanics had not completed high school or the equivalent in 2015. These shares are considerably higher than for rural Whites, with 13 percent lacking a high school diploma. Lower attainment levels for minorities may both reflect and contribute to high rates of poverty. Childhood poverty is highly correlated with lower academic success and graduation rates, while lower educational attainment is strongly associated with lower earnings in adulthood. This chart updates data found in the ERS report Rural America at a Glance, 2015 Edition, published November 2015.
Friday, August 12, 2016
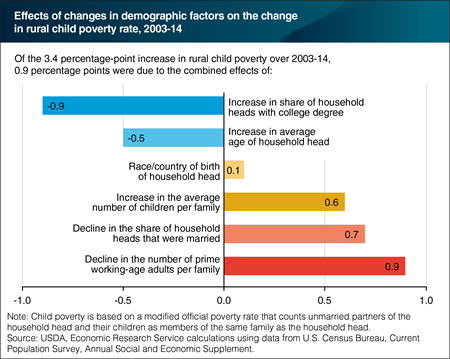
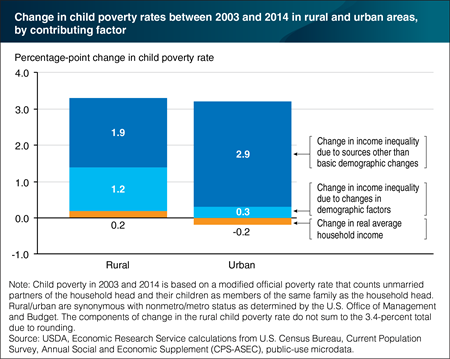
Using data from the Census Bureau’s Current Population Survey and a modified official poverty measure, ERS researchers found that rural child poverty rose from 18.7 percent in 2003 to 22.1 percent in 2014. The bulk of this 3.4-percentage point increase—3.2 percentage points—was due to rising income inequality, and not a decline in average incomes. A portion of this increase in inequality, in turn, was driven by changing rural demographics. An increase in the number of children in the average rural family raised poverty by 0.6 percentage points, while declines in the number of adults of prime working age and in the share of household heads that were married raised rural child poverty by 0.9 and 0.7 points, respectively. A slight increase in the average age of the household head helped reduce rural child poverty by 0.5 percentage points. The most beneficial demographic change was a rise in the share of rural household heads with a college degree, which rose from 15.8 to 19.5 percent, helping to reduce child poverty by 0.9 percentage points. The net impact of all these demographic changes was to contribute 0.9 percentage points towards the increase in rural child poverty. This chart is based on a data table found in the May 2016 Amber Waves feature, “Understanding Trends in Rural Child Poverty, 2003-14.”
Friday, June 17, 2016
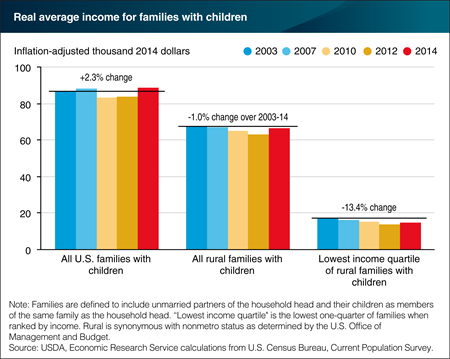
By 2014, average income (adjusted for inflation) for all U.S. families with children exceeded prerecession levels, and average income had almost completely recovered for all rural families with children as well. For the bottom 25 percent of rural families (when ranked by income), however, average income remained considerably below its prior peak. In 2003, the average income for families in this lowest income quartile was $17,200 (in 2014 dollars) and it fell by 6.0 percent between 2003 and 2007, despite the fact that the U.S. economy was growing. Not surprisingly, incomes for the bottom quartile fell by another 4.6 percent between 2007 and 2010, due to the Great Recession (December 2007-June 2009). When economic growth resumed, however, it did not immediately translate into growth for these low-income rural families: by 2012, their average income had fallen by another 10.1 percent. Average income for the bottom quartile rebounded somewhat between 2012 and 2014, but remained 13.4 percent below the 2003 level. This chart is based on the Amber Waves feature, “Understanding Trends in Rural Child Poverty, 2003-14.”
Friday, May 27, 2016
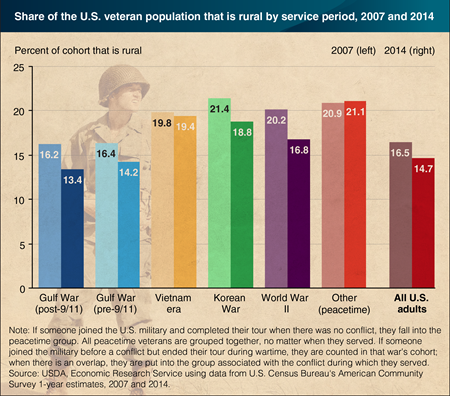
The number of veterans living in rural areas has been falling at an increasing rate, dropping from about 4.5 million in 2007 to 3.4 million in 2014, despite an influx of more than 100,000 post-9/11 veterans over the same period. This overall decline was largely due to natural decrease in the pre-Vietnam era population. The World War II rural veteran cohort alone declined by more than 400,000, with additional losses among all other service cohorts. Despite these declines, veterans continue to be overrepresented in rural America. In 2014, rural areas accounted for 17.5 percent of the total veteran population but only 14.7 percent of the U.S. civilian adult population. However, the rural share of the veteran population has been declining and is likely to decline further in the near future, as the newest veteran cohorts have overwhelmingly returned to urban areas and the current rural veteran population ages. Find county-level maps and data on the U.S. veteran population in ERS’s Atlas of Rural and Small-Town America.
Wednesday, May 18, 2016
Between 2003 and 2014, the percent of children living in poverty as measured by ERS researchers increased by 3.4 percentage points in rural areas and 3.0 percentage points in urban areas. Changes in rural and urban average household income between these two dates were small, and had little effect on child poverty rates. Instead, most of the rise in child poverty was the result of an increase in income inequality, meaning that lower income families fared worse than average. In rural areas, 1.2 percentage points of increased child poverty could be attributed to changes in family characteristics and other demographic factors, including a decline in the share of children living in married-couple families, a slight decline in the number of working-age adults per family, and a slight rise in the number of children per family. The remaining increase—accounting for 1.9 percentage points in increased child poverty—reflects rising inequality within demographic categories. For urban children, family characteristics and other demographic factors had little net effect on child poverty. This chart is based on the ERS report, Understanding the Rise in Rural Child Poverty, 2003-2014, released May 16, 2016.
Wednesday, March 30, 2016
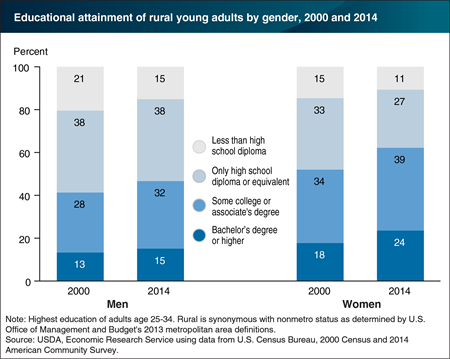
The education of workers is closely linked with economic success. Workers with educations beyond high school degrees are more likely to be employed and earning higher wages than workers with high school degrees or less education. Educational attainment of both men and women in rural areas has grown over time, and rural women are more likely to have some college experience or hold associate or bachelor’s degrees than rural men. For example, the most recent (2014) American Community Survey shows that 63 percent of rural young women (age 25-34) had schooling beyond a high school diploma, compared with less than half (47 percent) of rural young men; nearly a quarter of rural young women held a bachelor’s degree or higher. The gender-education gap beyond a high school diploma for rural young adults has widened, from 11 percentage points in 2000 to 16 percentage points in 2014. This gap is more pronounced in rural areas than in the nation as a whole. This chart is based on the ERS Rural Employment & Education topic page.
Thursday, March 3, 2016
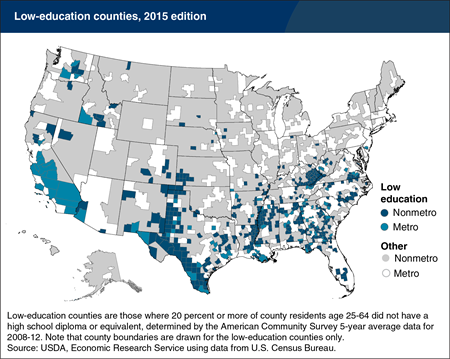
The proportion of adults lacking a high school diploma or equivalent declined in rural America (defined here as nonmetro counties), from 32 percent in 1990 to 15 percent in 2014. The proportion of rural adults with college degrees also increased from 12 to 19 percent during that time. Despite these overall gains, educational attainment varies widely across rural areas. ERS’s latest county typology classifies low-education counties as those where at least one of every five working-age adults (age 25-64) has not completed high school. In an average of data over 2008-12, ERS identified 467 low-education counties in the United States, 367 of which were rural. Eight out of 10 of all low-education counties are located in the South. Three-fourths of rural low-education counties also qualified as low-employment in the latest ERS county typology. Over 40 percent of rural low-education counties were both low-employment and persistently poor, reflecting the difficulty that adults without high school diplomas have in finding and retaining jobs that pay enough to place them above the poverty line. This map is part of the ERS data product on County Typology Codes, released December 2015.
Friday, January 22, 2016
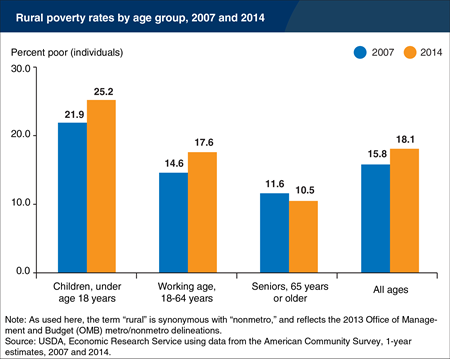
Poverty rates for rural children underwent the largest increase during the 2007-09 recession, rising from 21.9 percent in 2007 to 24.2 percent in 2009. (The poverty status of children depends on the income, size, and composition of their families.) Child poverty continued to increase at the start of the economic recovery and was 25.2 percent in 2014. Poverty for the rural working-age population also increased during the recession and climbed modestly in recovery. Conversely, the poverty rate for rural seniors declined during the recession and has changed little during the recovery. Rural children were also more likely to be deeply poor—in families with an income below half of the poverty level—than were other age groups. In 2014, 11.3 percent of rural children lived in deep poverty, compared with 7.8 percent of the rural working-age population. This chart is found in Rural America At A Glance 2015 Edition, November 2015.
Friday, January 15, 2016
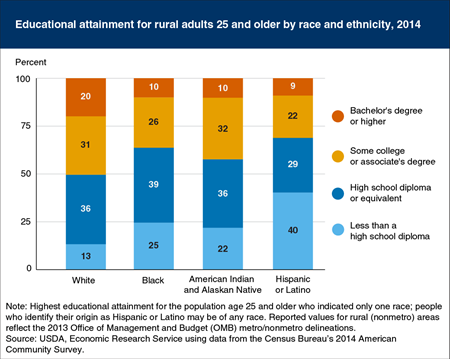
Higher educational attainment is closely tied to economic well-being—through higher earnings, lower unemployment, and lower poverty. While educational attainment in rural (nonmetro) America has improved over time, rural areas still lag urban (metro) areas in educational attainment. Moreover, within rural areas, educational attainment varies across racial and ethnic categories. In general, minority populations within rural areas have lower average levels of educational attainment. About a quarter of adults age 25 and over in the rural Black and Native American/Alaskan Native populations, and 40 percent of rural Hispanics, had not completed high school or the equivalent in 2014. These shares are considerably higher than for rural Whites, with 13 percent lacking a high school diploma. Lower attainment levels for minorities may both reflect and contribute to high rates of poverty; poverty in childhood is highly correlated with lower academic success and graduation rates, while lower educational attainment is strongly associated with lower earnings in adulthood. This chart is found in the ERS publication, Rural America At A Glance, 2015 Edition, November 2015.
Thursday, December 31, 2015
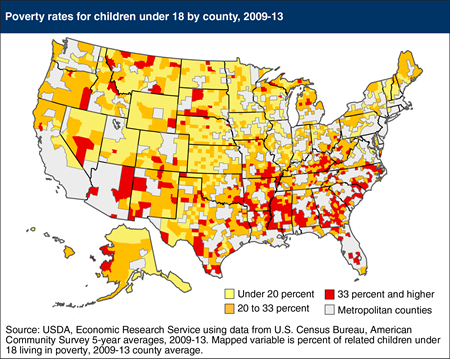
Child poverty rates varied considerably across nonmetropolitan (rural) counties according to 2009-13 county averages (data on poverty for all U.S. counties are available from the American Community Survey only for 5-year averages). According to the official poverty measure, one in five rural counties had child poverty rates over 33 percent. Child poverty has increased since the 2000 Census (which measured poverty in 1999) and the number of rural counties with child poverty rates of over 33 percent has more than doubled. Improving young adult education levels tended to lower child poverty rates over the period, but increases in single-parent households and economic recession were associated with rising child poverty. Metropolitan counties had average child poverty rates of 21 percent in 2009-13. This map appears in the July 2015 Amber Waves feature, Understanding the Geography of Growth in Rural Child Poverty.
Tuesday, December 8, 2015
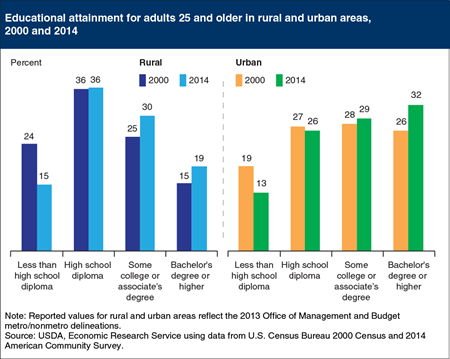
In 1960, 60 percent of the rural population ages 25 and older had not completed high school. By 2014—more than 50 years later—that proportion had dropped to 15 percent. Over the same period, the proportion of rural adults ages 25 and older with a bachelor’s degree or higher increased from 5 percent to 19 percent but remained well below the proportion in urban areas (32 percent) in 2014. The proportion of rural adults with a college degree or more increased by 4 percentage points between 2000 and 2014 and the proportion without a high school degree or equivalent, such as a GED, declined by 9 percentage points. The gap between urban-rural college completion rates has increased, even for young adults, who are more likely to have completed high school than older cohorts. Between 2000 and 2014, the share of young adults age 25-34 (not shown in this chart) with bachelor’s degrees grew in urban areas from 29 to 35 percent. In rural areas, the college-educated proportion of young adults rose from 15 to 19 percent. This chart is found in the ERS publication, Rural America At A Glance, released November 30, 2015.
Tuesday, November 10, 2015
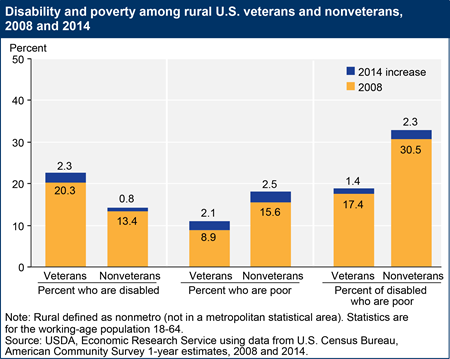
In 2008, more than 2.4 million—8.2 percent—of the rural working-age population (18 to 64 years old) were veterans. That number declined to 1.5 million (5.9 percent) in 2014. During that period, however, the share of working-age rural veterans with a disability increased (from 20.3 percent to 22.6 percent), as did their poverty rate (from 8.9 percent to 11.0 percent). The disabled are more likely to live in poverty, particularly when the disability is work limiting, and veterans are more likely to report a work-limiting disability than comparable nonveterans. Limited labor force participation and economic constraints often persist for persons with disabilities; however, vocational services and policy initiatives aim to support work among them. Disabled working-age veterans were less likely to be in poverty (18.8 percent) than their nonveteran counterparts (32.8 percent) in 2014. This chart is based on data found in the Atlas of Rural and Small Town America.
Friday, October 30, 2015
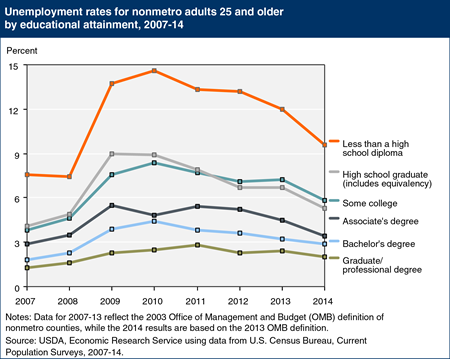
The nonmetro unemployment rate fell between 2010 and 2014 as the economy continued to recover from the national recession that began in late 2007. The likelihood of being unemployed was much higher for adults (ages 25 and older) at the lowest levels of educational attainment during the 2007-2014 period. Data from the Census Bureau’s Current Population Survey show that differences in unemployment rates between the least and most highly educated nonmetro adults nearly doubled over the 2007-2010 period. Since 2010, unemployment rates have fallen, especially for those without a high school diploma. In 2010, nearly 15 percent of adults without a high school diploma were unemployed, while in 2014, 9.6 percent of adults in this group were unemployed. Overall, unemployment rates declined across all levels of educational attainment for nonmetro adults, showing a gradual trend towards pre-recession levels. This chart is found on the ERS topic page on Rural Employment and Education, updated September 2015.
Friday, September 4, 2015
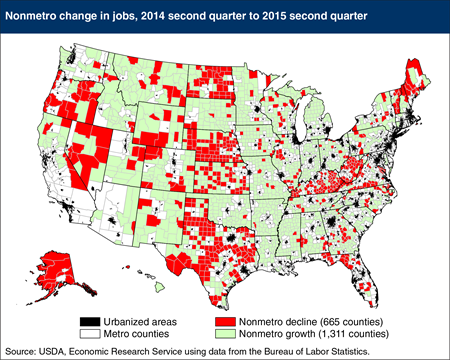
The number of rural (nonmetro) jobs rose by 239,000 (1.2 percent) between the second quarters of 2014 and 2015, more than double the rate of growth over the prior year. Rural job growth still lags behind the rate of growth in metro areas, which saw the number of jobs rise by 1.8 percent over this period. Moreover, while the number of jobs in urban areas now exceeds the peak levels recorded prior to the Great Recession in 2007, rural employment is still well below its pre-recession peak. Rural job growth was unevenly distributed; some 1311 rural counties saw no change or an increase in jobs (ranging up to 69 percent growth), but 665 experienced job declines, with the largest decline being 19 percent. Rural counties in several oil and gas-producing states, such as Texas, Kansas, and North Dakota, which had generally experienced job growth between 2013 and 2014, experienced declines in 2014-15. The vast majority (88 percent) of rural counties in the block of Southern States stretching from Arkansas to Georgia experienced job growth, whereas, in 2013-14, 71 percent of these rural counties had employment losses. This map updates one found in the ERS report, Rural America At a Glance, 2014 Edition.
Thursday, July 23, 2015
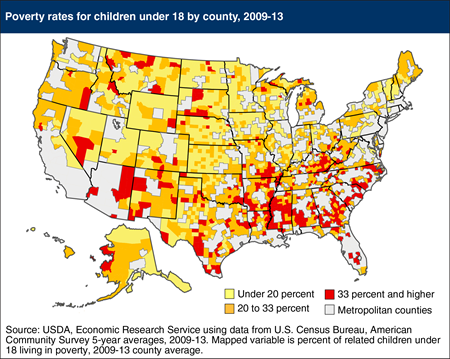
Child poverty rates varied considerably across nonmetropolitan (rural) counties according to 2009-13 county averages (data on poverty for all U.S. counties are available from the American Community Survey only for 5-year averages). According to the official poverty measure, one in five rural counties had child poverty rates over 33 percent. Child poverty has increased since the 2000 Census (which measured poverty in 1999) and the number of rural counties with child poverty rates of over 33 percent has more than doubled. Improving young adult education levels tended to lower child poverty rates over the period, but increases in single-parent households and economic recession were associated with rising child poverty. Metropolitan counties had average child poverty rates of 21 percent in 2009-13. This map appears in the July 2015 Amber Waves feature, "Understanding the Geography of Growth in Rural Child Poverty."
Friday, May 1, 2015
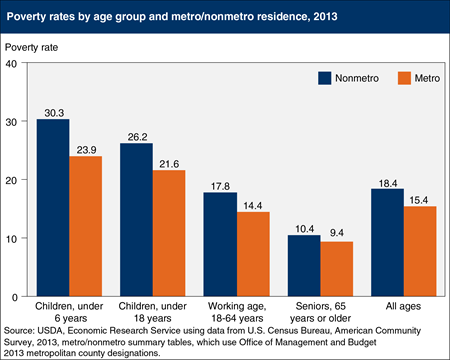
An important indicator of the Nation’s long-term well-being is poverty among children; child poverty often has an impact that carries throughout a lifetime, particularly if the child lived in poverty at an early age. Like the overall poverty rate, nonmetro (rural) child poverty has been historically higher than metro (urban) child poverty, and increased to record-high levels in 2012. According to Census estimates, the poverty rate for children under 18 living in rural areas stood at 26.2 percent in 2013, more than four percentage points higher than the metro child poverty rate of 21.6 percent. In 2013, the nonmetro/metro difference in poverty rates was greatest for children under six years old (30.3 percent nonmetro and 23.9 percent metro). Child poverty is more sensitive to labor market conditions than overall poverty, as children depend on the earnings of their parents. Older members of the labor force, including empty nesters and retirees, are less affected by job downturns, and families with children need higher incomes to stay above the poverty line than singles or married couples without children. This chart is found in the ERS topic page on Rural Poverty & Well-being, updated April 2015.
Tuesday, January 20, 2015
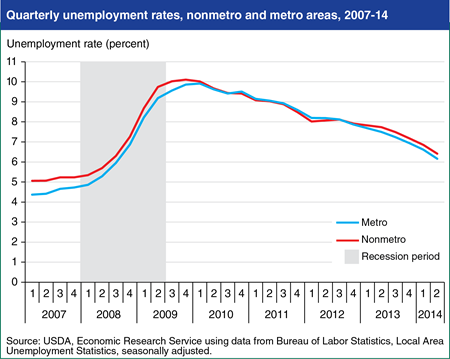
Both urban (metro) and rural (nonmetro) unemployment rates have dropped since the highs reached at the end of the most recent recession. In 2007, the rural unemployment rate averaged 5.1 percent, compared to 4.5 percent in urban areas. As the recession unfolded, metro and nonmetro unemployment rates rose rapidly and converged, peaking at 10 percent in the first quarter of 2010. Since that time, the two unemployment rates have followed similar downward trends. The seasonally adjusted rural unemployment rate stood at 6.4 percent in the second quarter of 2014, while the urban rate fell to 6.2 percent. Until recently, the bulk of the decline in the rural unemployment rate is due to a reduction in the number of people seeking work, not an increase in the number of people working. This chart is found in the October 2014 Amber Waves feature, "Rural Employment in Recession and Recovery."
Tuesday, December 23, 2014
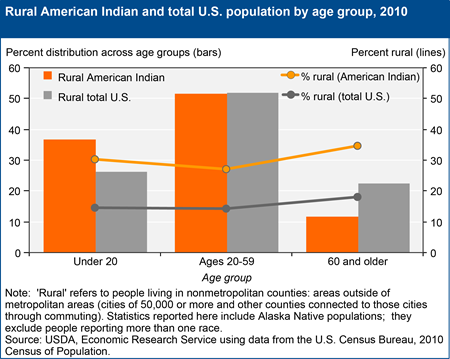
Despite rapid increases in their urban population in recent decades, American Indians (including Alaska native populations but excluding those reporting more than one race) remain disproportionately rural compared with other groups. Based on self-identified race, 29 percent of all American Indians lived in rural areas in 2010, compared with about 15 percent of the total U.S. population. Persistent out-migration of rural residents finishing high school was as pronounced among American Indians as it was for the rural population as a whole, reflected in a slight dip in the percentage of working age adults residing in rural America. In addition, 52 percent of rural American Indians and the rural U.S. population in general were age 20-59, indicating an equal level of economic dependency on rural working-age adults, whether American Indian or not. But rural American Indians are much more likely to be young (under 20) than the total rural population (which has a higher share of population age 60 and older), putting very different pressures on family finances and public support programs. Find county-level data on the American Indian and Alaska Native population in ERS’s Atlas of Rural and Small-Town America.
_450px.png?v=2672.4)
Tuesday, December 23, 2014
Nearly 4 million veterans resided in rural (nonmetropolitan) America in 2012. They are a rapidly aging and increasingly diverse group of men and women who comprise over 10 percent of the rural adult population despite their persistently declining numbers; the number of veterans living in rural areas declined from 6.6 million in 1992 to 3.8 million in 2012. A drop in the size of the active military population since 1990, from 3 million to roughly 1.4 million, and natural decrease due to aging (over half of rural veterans were age 65 or older in 2012, compared to 18 percent of the nonveteran rural population) means the downward trend in the number of rural veterans will likely continue for many years. Whether due to their military service or because of their age profile, over 20 percent of rural, working-age veterans report disability status compared with 11 percent of nonveterans. Taken together, their older age and higher incidence of disabilities make the well-being of rural veterans, as a group, increasingly dependent on access to medical care in rural areas. This chart comes from Rural Veterans at a Glance, EB-25, November 2013.


