ERS Charts of Note
Subscribe to get highlights from our current and past research, Monday through Friday, or see our privacy policy.
Get the latest charts via email, or on our mobile app for  and
and 
Wednesday, April 7, 2021
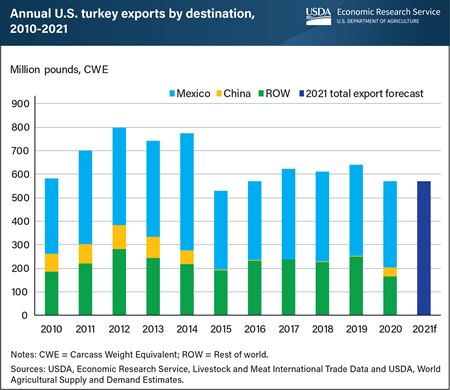
Exports accounted for about 10 percent of the 5.7 billion pounds of turkey produced in the United States in 2020. While exporters sent the majority of turkey shipments to Mexico, China re-emerged as a buyer for the first time since 2014. In January 2015, China banned all imports of poultry from the United States because of U.S. outbreaks of highly pathogenic avian influenza (HPAI). After nearly 5 years, China lifted its ban on U.S. poultry in November 2019. As China faced a protein deficit caused by African swine fever, demand for turkey products increased, causing China to quickly become the second largest foreign market for U.S. turkey, after Mexico. Despite this new growth market, turkey exports in 2020 fell from 2019 levels as global demand decreased and domestic production declined year over year as a result of the COVID-19 pandemic. Between 2010 and 2014, China's share of U.S. turkey exports averaged about 11 percent, or around 81 million pounds. China’s share of U.S. turkey exports in 2020 was around 7 percent, or 38 million pounds. The new demand from China did not make up for falling demand for turkey in Mexico and other parts of the world. Exports to Mexico were 22 million pounds below 2019. Exports to the rest of the world declined by 83 million pounds, including decreases in shipments to Benin, Hong Kong, South Africa, Peru, and Japan. In 2021, total turkey exports are forecast at 570 million pounds, which would be a slight decrease from 2020. This chart is drawn from the USDA, Economic Research Service’s Livestock, Dairy and Poultry Outlook, February 2021.
Wednesday, December 9, 2020
Errata: On December 11, 2020, text was updated to distinguish that preliminary data was used in the chart and that official November turkey weight data is forthcoming.
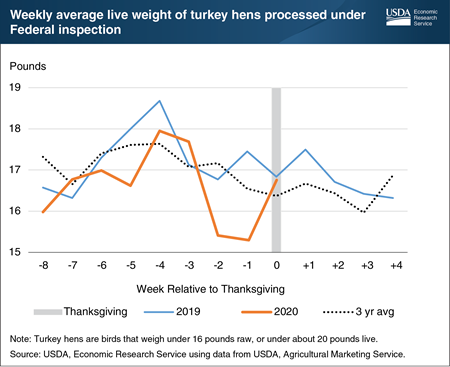
Expectations that people will gather in smaller groups for the holidays this year may have resulted in increased demand for smaller turkeys for Thanksgiving tables. However, the industry may not have been able to fulfill that change in consumer demand in time for the food-centered holiday. For turkeys to be grown in time for Thanksgiving, they must have been hatched in August or earlier. As a result, the reaction to changing demand can be delayed. Stocks of frozen turkeys build up all year long in preparation for the seasonal spike in demand, so many of the birds that were for sale in grocery stores around Thanksgiving were processed even earlier in the year. Even so, preliminary data in the weeks that led up to Thanksgiving suggested that the average live weight of turkey hens processed was below last year’s average. Birds that classify as turkey hens are those that weigh fewer than 16 pounds raw or fewer than about 20 pounds live. Official data for November turkey weights will be released by USDA’s National Agricultural Statistics Service in late December. This chart is drawn from Economic Research Service’s Livestock, Dairy, and Poultry Outlook, November 2020.
Monday, July 20, 2020
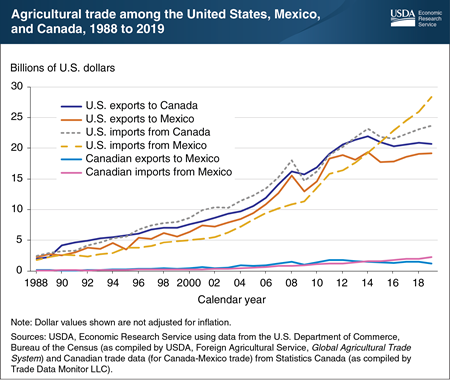
The United States-Mexico-Canada Agreement (USMCA) is a new economic and trade agreement that modifies the terms of the North American Free Trade Agreement (NAFTA), adding provisions for continued growth in agricultural trade among the three member countries. Agriculture has a large and growing stake in interregional trade in the free-trade area created by NAFTA. The total value of intraregional agricultural trade (exports and imports) among all three NAFTA countries reached about $95.3 billion in 2019, compared with $16.6 billion in 1993 (the year before NAFTA’s implementation). Even after taking the effects of inflation into account, this expansion corresponds to an increase in intraregional agricultural trade of 252 percent. Under the ratified new agreement, which took effect on July 1, 2020, all agricultural products that had zero tariffs under NAFTA will continue to have zero tariffs under USMCA. The USMCA adds provisions on biotechnology; geographical indicators; and sanitary and phytosanitary measures, which are measures to protect humans, animals, and plants from diseases, pests, or contaminants. It also provides broader market opportunities for U.S. exports to Canada of dairy, poultry, and egg products. These new provisions, coupled with the continuation of intraregional free trade in almost all agricultural products, provides the foundation for further agricultural trade growth among the United States, Mexico, and Canada. This chart appears in the Economic Research Service’s Amber Waves article, “United States-Mexico-Canada Agreement (USMCA) Approaches the Starting Block, Offers Growth Opportunities for Agriculture.”
Wednesday, May 6, 2020
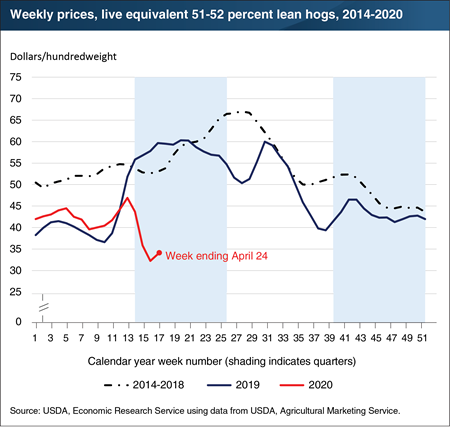
Closures and production slowdowns of several hog-processing facilities beginning in early April due to workforce absences caused by the COVID-19 virus decreased processor demand for hogs, reducing weekly hog slaughter numbers and driving April hog prices (prices paid to hog producers by processors) more than 35 percent below prices in April 2019. As of late April, the closures comprised more than a third of the industry’s processing capacity. At the time of the first plant closing, pork demand was already low, as much of the hotel, restaurant, and institutional sector had been shut down to block transmission of the virus. In 2020, between the weeks ending March 27 and April 24 (weeks 13 and 17 of the calendar year), prices fell $13 per hundredweight (cwt) as plants took measures to protect processing-plant workers from COVID-19, reducing the rates at which hogs were slaughtered. For the week ending April 24 (week 17), live hog prices averaged about $34 per cwt, the second lowest weekly price since November 2016, and significantly below most hog producers’ break-even price. Average prices for the week ending April 24 moved about 5 percent higher from the previous week, likely attributable to rapidly increasing wholesale pork prices (prices received by processors for sales of pork cuts), to which many hog sales transactions are linked. This chart is drawn from ERS’s Livestock, Dairy, and Poultry Monthly Outlook report from April 2020 and is updated using data from USDA’s Agricultural Marketing Service.
Monday, May 4, 2020
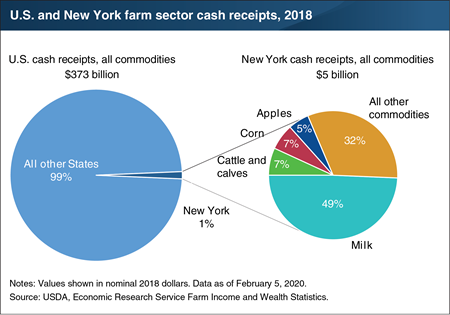
Each August, the Economic Research Service (ERS) produces and publishes estimates of the (farm sector) cash receipts—the cash income the farm sector receives from agricultural commodity sales—from the prior year. These data include State-level estimates, which can help offer background information about States subject to unexpected changes that may affect the agricultural sector, such as the current COVID-19 shelter-in-place restrictions in New York and other States. In 2018, U.S. cash receipts for all commodities totaled $373 billion. New York contributed about 1 percent ($5 billion) of that total, ranking 27th among all States. Receipts from milk accounted for the largest share of cash receipts in New York, at 49 percent ($2.5 billion). The State ranked third in milk cash receipts behind California and Wisconsin, accounting for 7 percent of milk cash receipts nationwide. New York also ranked third in apple cash receipts behind Washington and Michigan, accounting for 9 percent ($262 million) of apple cash receipts nationwide and 5 percent of New York’s total cash receipts. Receipts for corn and cattle/calves each accounted for 7 percent of the State’s total cash receipts. Although contributing a smaller amount to total cash receipts in the State, nationwide New York accounted for 18 percent ($26 million) of maple products receipts, 13 percent ($53 million) of cabbage receipts and 13 percent ($24 million) squash receipts. This chart uses State-level data from the ERS data product Farm Income and Wealth Statistics, updated February 2020.
Thursday, April 30, 2020
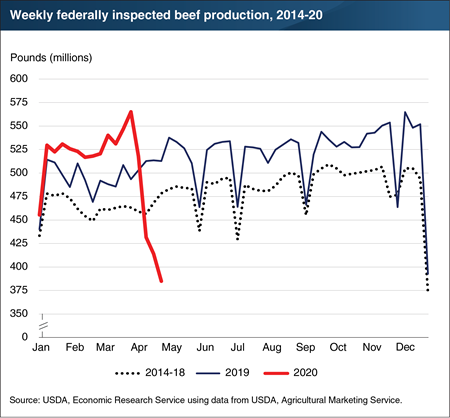
Beef production in the first quarter of 2020 set a first-quarter record. Even as retail demand for beef increased in late March as consumers prepared to shelter in place, the USDA National Agricultural Statistics Service reported that beef held in cold storage at the end of March 2020 was 11 percent above last year and 2 percent above the previous month. Since its peak in late March, federally inspected beef production fell almost 32 percent through the week ending April 25 as the rate of cattle slaughter declined at several beef packing facilities. The slowdown in cattle slaughter limited beef production at these facilities where operations temporarily closed or shifts were reduced due to labor force absences caused by the spread of COVID-19. At a time when cattle slaughter numbers increase seasonally, cattle slaughter rates for the week ending April 25 were down 28 percent year-over-year. As the impacts of COVID-19 continue to evolve quickly, the Economic Research Service continues to closely monitor the latest USDA data and industry news. Some of this information is discussed in the Economic Research Service’s Livestock, Dairy, and Poultry Monthly Outlook report from April 2020 and is updated using data from USDA’s Agricultural Marketing Service and National Agricultural Statistics Service.
Tuesday, April 28, 2020
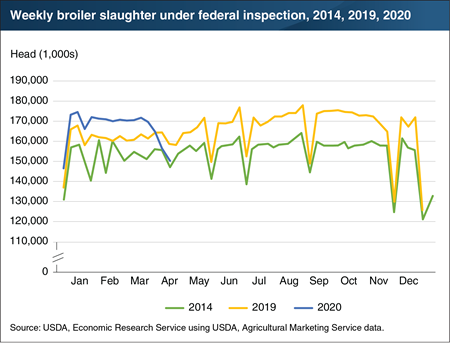
The outbreak of COVID-19 among workers in U.S. broiler processing facilities has slowed the processing volumes of broiler chicken meat, which had previously been running at a steadily high pace. Production of broiler meat in the United States in early 2020 reached a record-producing clip, significantly outperforming the same period in 2019. To support this level of production, processing rates (slaughter) had also reached an all-time high, with first-quarter 2020 volumes reaching an average of 169 million birds per week. With the spread of COVID-19, measures to increase social distancing on the production line, as well as plant closures and workforce absenteeism drove down broiler processing volumes to 155 million birds the week ending April 11 and 150 million the week ending April 18. These decreases of 8 percent and 11 percent, respectively, relative to first-quarter average volumes pushed April weekly processing volumes below levels not seen since 2014. The disruption to broiler supplies, however, was preceded by a significant shift in the demand structure for broiler meat wherein demand from food service declined sharply. While much of this demand transferred to the retail sector, it is unlikely that retail is completely making up for the lost food-service demand. Although prices of some cuts have increased from their recent lows as supplies have tightened, wholesale prices for nearly all broiler products since the beginning of April remain weak, suggesting overall broiler supplies continue to outpace demand. Some of this information is discussed in the Economic Research Service Livestock, Dairy, and Poultry Monthly Outlook for March and April 2020 and has been updated using data from the Agricultural Marketing Service.
Friday, April 10, 2020
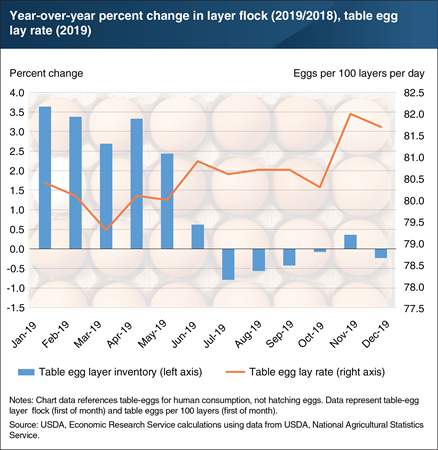
In 2019, the United States produced more than 8 billion dozen table eggs, a 2.8-percent increase over 2018. Much of this growth came in the first half of 2019, driven by a larger layer flock—a flock of egg-laying hens—as well as higher egg lay rates. However, this growth resulted in an oversupply of eggs, which put significant downward pressure on egg prices. In response, the industry took measures beginning in June 2019 to downsize the layer flock. For the remainder of 2019, the layer flock inventory fell below or hovered around previous year levels. Nonetheless, table egg production in the second half of 2019 remained 1.5 percent higher over 2018 because of record-high lay rates. On November 1, 2019, the U.S. table egg lay rate reached 82 eggs per 100 layers, the highest rate on record. Lay rates, which have increased by approximately 11 percent since 2000, have been an important driver of growth in egg production. Several factors can affect lay rates, including day length, hen age, nutrition, disease, genetics, and flock management. Egg production decreases with shorter days, particularly during fall and winter, but this can be remedied with artificial lighting. Younger hens and older hens do not produce as many eggs as those hens of peak production age (approximately 26 weeks). Finally, advancements in nutrition, disease prevention, genetic selection, and improved flock management practices have contributed to improving overall hen health, which is associated with good lay rates. In the beginning of 2020, although lay rates continued to trend higher year over year, the layer flock contracted sizably. This tightening of supply has been met with a surge in demand, causing prices to increase in March. This chart is drawn from the Economic Research Service Livestock, Dairy, and Poultry Monthly Outlook, published March 2020, and the Livestock & Meat Domestic Data: Production Indicators.
Tuesday, November 19, 2019
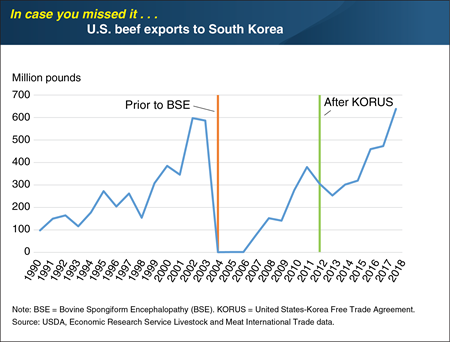
Fifteen years ago, U.S. beef was banned in South Korea after the discovery of bovine spongiform encephalopathy (BSE) in the United States at the end of 2003. U.S. beef exports gradually reentered the market after the ban was partially lifted in 2006, and then markedly accelerated in the years following implementation of the 2012 United States-South Korea free trade agreement (KORUS), which reduced tariffs and non-tariff barriers. Recently emerging as an important market for U.S. beef exports, South Korea received more than half of the increase in U.S. total beef-export volume from 2017 to 2018, with 35 percent year-over-year growth. Further, South Korea received more than 20 percent of total U.S. beef exports in 2018. Likely drivers of this growth included strong consumer demand; lower tariffs than the next largest competitor, Australia; large exportable supplies of beef in the United States relative to Australia; and a relatively weaker U.S. dollar in the first half of the year. As a result, U.S. beef exports to South Korea exceeded the pre-BSE peak level of 597 million pounds in 2002, reaching 638 million pounds in 2018, and making the United States the largest supplier of beef to South Korea. This chart appears in the May 2019 ERS Amber Waves article, “U.S. Exports for Most Major Meat Commodities Grew in 2018.” This Chart of Note was originally published May 6, 2019.
Friday, September 27, 2019
Errata: On February 11, 2020, this Chart of Note on U.S. production of ice cream and frozen yogurt, published on September 27, 2019, was corrected. Total U.S. production of ice cream and frozen yogurt was corrected from 6.2 billion pounds in 2018 to 6.4 billion pounds.
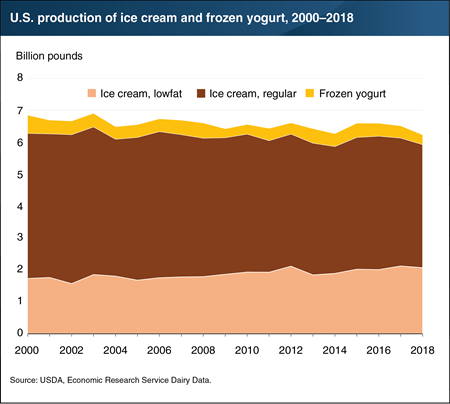
Americans continue to appreciate a cold treat every now and then, according to the latest ERS data on U.S. ice cream and frozen yogurt production. In 2018, domestic production of low-fat ice cream, regular ice cream, and frozen yogurt totaled just over 6.4 billion pounds. This marked a 4-percent decline compared to 2017, with slight contractions in all three categories. In the aggregate, production of ice cream and frozen yogurt has been stable since 2000, when total production peaked. However, movement has occurred among categories. As consumers have become more conscious of their intake of fats, the ice cream industry has shifted toward increased production of lowfat ice creams at the expense of regular fat content ice creams. Since 2000, production of lowfat ice cream has increased by 20 percent, while regular ice cream production has decreased by 9 percent. Perhaps due to increased availability of non-dairy ice cream options, frozen yogurt has also declined in prevalence. Production of frozen yogurt is down 47 percent since 2000. This chart is drawn from the ERS Dairy Data product, last updated in September 2019.
Thursday, May 16, 2019
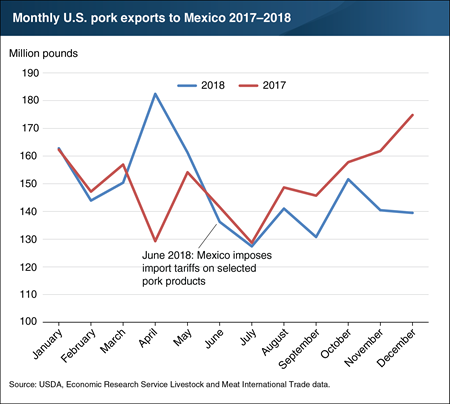
Although total U.S. pork exports grew by 4 percent from 2017 to 2018, exports to the largest U.S. pork-trading partner, Mexico, decreased over the same period. In contrast to the trend in broiler meat exports, which showed the strongest growth in the second half of 2018, U.S. pork exports to Mexico were much stronger in the first half of the year. After Mexico imposed tariffs on most U.S. pork products in June 2018, monthly pork exports to Mexico fell below 2017 levels for the remainder of 2018. Given that the Mexican tariff rate for most pork products was 20 percent, an even larger year-over-year decline could have been expected. However, average U.S. pork export unit costs fell, compensating for the increased cost to importers from the tariffs. In the first half of 2018, U.S. pork exports to Mexico in 2018 had risen over 2017 levels, possibly because demand from Mexican importers had increased in anticipation of the impending cost increases that tariffs would produce. This chart appears in the May ERS Amber Waves article, “U.S. Exports for Most Major Meat Commodities Grew in 2018.”
Monday, May 6, 2019
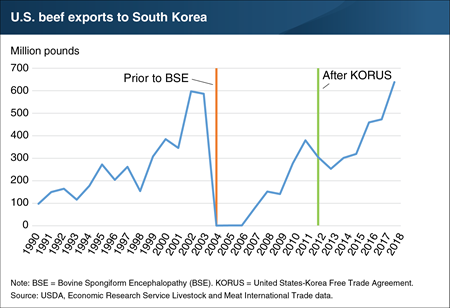
Fifteen years ago, U.S. beef was banned in South Korea after the discovery of bovine spongiform encephalopathy (BSE) in the United States at the end of 2003. U.S. beef exports gradually reentered the market after the ban was partially lifted in 2006, and then markedly accelerated in the years following implementation of the 2012 United States-South Korea free trade agreement (KORUS), which reduced tariffs and non-tariff barriers. Recently emerging as an important market for U.S. beef exports, South Korea received more than half of the increase in U.S. total beef-export volume from 2017 to 2018, with 35 percent year-over-year growth. Further, South Korea received more than 20 percent of total U.S. beef exports in 2018. Likely drivers of this growth included strong consumer demand; lower tariffs than the next largest competitor, Australia; large exportable supplies of beef in the United States relative to Australia; and a relatively weaker U.S. dollar in the first half of the year. As a result, U.S. beef exports to South Korea exceeded the pre-BSE peak level of 597 million pounds in 2002, reaching 638 million pounds in 2018, and making the United States the largest supplier of beef to South Korea. This chart appears in the May 2019 ERS Amber Waves article, “U.S. Exports for Most Major Meat Commodities Grew in 2018.”
Wednesday, November 21, 2018
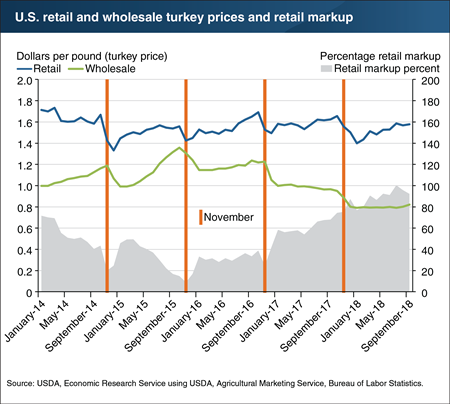
Thanksgiving meals typically include such iconic dishes as pumpkin pie and stuffing, and turkey is usually the centerpiece. This year and last, wholesale turkey prices have been sharply lower than in years past. Do lower wholesale prices mean lower turkey prices at the grocery store? Not always. While wholesale and retail turkey price movements are historically correlated on a yearly basis, seasonal factors can disrupt this correlation. Commonly in the past, retail turkey prices in the Thanksgiving holiday season were near annual low points, while wholesale prices were near yearly highs. Between 2014 and 2016, the November markup from wholesale to retail prices for turkey was 18 percent, compared with an average 38-percent markup over the entire 2-year period. Beginning in 2017, however, wholesale turkey prices began a sustained decline that was not reflected in retail price movements. The retail markup in November 2017 reached 78 percent, compared with 65 percent for this year, and a higher markup is expected in 2018. The data suggest that the past relationship between wholesale and retail Thanksgiving turkey prices may be fading, as retail prices have become less responsive to downward movements in wholesale prices. This chart appears in the ERS Livestock, Dairy, and Poultry Outlook newsletter released in November 2018.
Monday, November 5, 2018
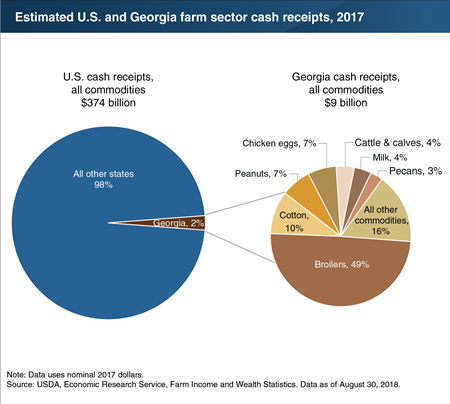
Each August, ERS estimates the previous year’s farm sector cash receipts—the cash income received from agricultural commodity sales. Historical State-level estimates provide baseline information that can be useful in gauging the financial impact of unexpected events that affect the agricultural sector, such as the recent hurricane that struck Georgia and surrounding States. In 2017, cash receipts for all U.S. farm commodities totaled $374 billion. Georgia contributed about 2 percent ($9 billion) of that total, ranking 15th among all States. Broilers (chickens that are raised for meat) accounted for the largest share of cash receipts in Georgia at $4.4 billion (49 percent of Georgia’s cash receipts)—followed by cotton at $878 million (10 percent of Georgia’s receipts. Georgia led the Nation in cash receipts from broilers and ranked second in cotton cash receipts, behind Texas. Georgia also led the country in cash receipts from peanuts and pecans—accounting for 47 percent and 38 percent, respectively, of the U.S. totals for those commodities—although they amounted to a smaller share of the State’s total cash receipts. This chart uses data from the ERS U.S. and State-Level Farm Income and Wealth Statistics data product, updated August 2018.
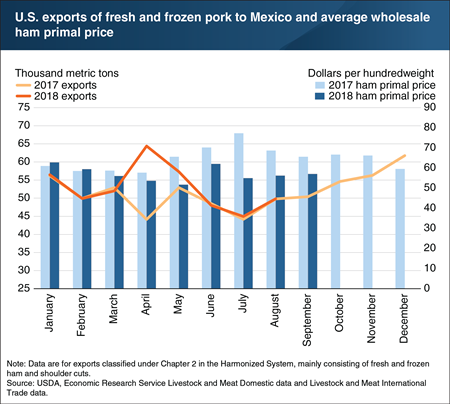
Lower prices have likely blunted the effect of Mexican tariffs on U.S. fresh and frozen pork exports
Friday, November 2, 2018
Since Mexico imposed retaliatory tariffs against the United States in June, export volumes (June to August) of U.S. fresh and frozen pork products subject to the tariffs have maintained the same levels as last year. Typically accounting for more than 97 percent of monthly U.S. pork shipments to Mexico, these exports consist mainly of fresh and frozen ham and shoulder cuts. The lower prices of 2018 U.S. ham primal cuts—averaging 20 percent lower in June-August 2018 than in June-August 2017—are likely a significant offset to the import tariff. In contrast to stable exports of fresh and frozen pork products, a different category of pork exports, that includes some processed pork products as well as cooked hams and shoulders, is down almost 45 percent in the June-August period. This chart is drawn from data in the ERS Livestock, Dairy, and Poultry Outlook newsletter, released in October 2018.
Wednesday, October 3, 2018
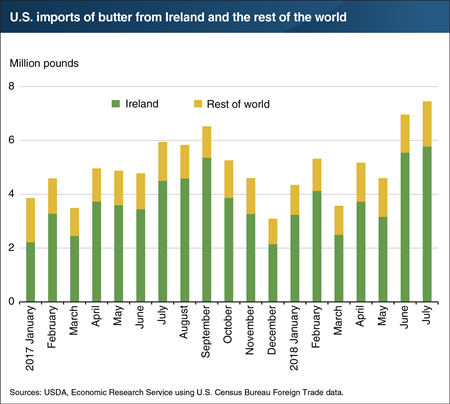
Total U.S. butter imports—driven by high imports of butter sourced from Ireland—reached record levels in July, supplanting a record set in May 2004. Total U.S. butter imports for July were 7.5 million pounds, with 5.8 million pounds (about 77 percent) coming from Ireland. Irish butter contains at least 82 percent butterfat (compared with at least 80 percent for most U.S. butter), is sourced from cows that are mainly grass fed, and is usually sold at a premium. Irish butter’s higher butterfat content is marketed as being superior for baking and as more pure than lower butterfat options. The recent rise in butter imports from Ireland can be partly attributed to the success of this marketing strategy and Irish butter’s popularity with many well known professional bakers and chefs. This chart appears in the ERS Livestock, Dairy, and Poultry Outlook newsletter released in September 2018.
Monday, September 24, 2018
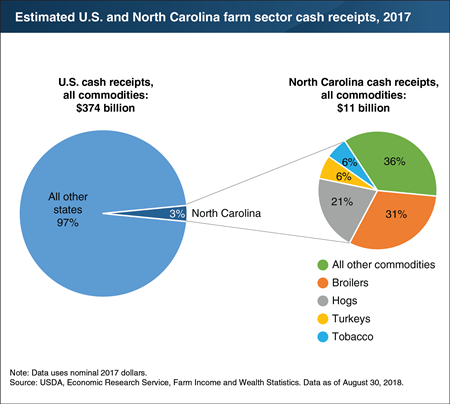
Each August, as part of the its Farm Income data product, ERS produces estimates of the prior year’s farm sector cash receipts—the cash income the sector receives from agricultural commodity sales. State-level estimates provide background information about States subject to unexpected changes that affect the agricultural sector, such as the recent hurricane that struck North Carolina and surrounding States. In 2017, cash receipts for all U.S. farm commodities totaled $374 billion. North Carolina contributed about 3 percent ($11 billion) of that total, ranking eighth among all States. Broilers (chickens that are raised for meat) accounted for the largest share of cash receipts in North Carolina at 31 percent ($4 billion), compared to 12 percent nationwide—followed by hogs at 21 percent ($2 billion), compared to 11 percent nationwide. The State ranked third in the nation in cash receipts for both broilers and hogs. North Carolina led the country in cash receipts from tobacco, sweet potatoes, and turkeys—accounting for 50, 47, and 15 percent of the U.S. total for those commodities, respectively—although they contributed a smaller share of the State’s total cash receipts. This chart uses data from the ERS U.S. and State-Level Farm Income and Wealth Statistics data product, updated August 2018.
Tuesday, September 11, 2018
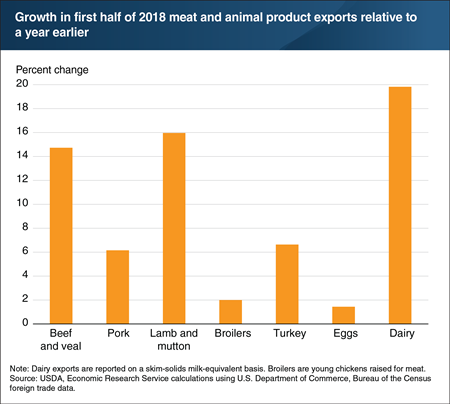
All major U.S. animal protein sources have experienced growth in exports in the first half of 2018 relative to the same period in 2017. U.S. trade data for the first 6 months of 2018 indicate year-over-year (YOY) growth for U.S. exports of all major meats as well as dairy and eggs. Dairy exports led the way, increasing by nearly 20 percent YOY, likely due to competitive prices. Lamb and mutton exports increased by 16 percent YOY, albeit from a much smaller base than other meats. Strong global demand, particularly from Asian markets, pushed beef and veal exports up 15 percent YOY. First-half 2018 pork exports—more than 6 percent above a year ago—were driven higher mainly by larger shipments to Mexico, South Korea, Central/South America, and the Caribbean. On the poultry side, turkey meat exports grew at levels on par with pork, while broiler meat and egg exports grew by only 2 and 1 percent, respectively. Although U.S. egg exports to certain major markets (such as Canada, Japan, and Hong Kong) (demonstrated double-digit growth in the first half, declines in sales to other markets, including the European Union, confined total growth to 1 percent YOY. This chart appears in the latest ERS Livestock, Dairy, and Poultry Outlook newsletter, released in August 2018.
Tuesday, July 24, 2018
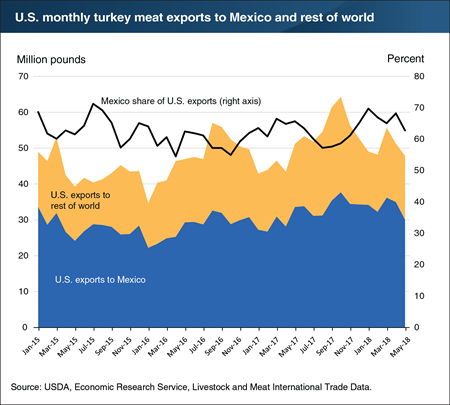
The United States is the world’s largest producer and exporter of turkey meat. In January 2016, turkey exports fell to their lowest levels since 2010, following the 2015 U.S. outbreak of Highly Pathogenic Avian Influenza that resulted in significant animal losses and the temporary closing or partial closing of key export markets. Since then, exports have crept upward, with key recovery happening with Mexico, the largest destination for U.S. turkey shipments. For most of the last decade, more than half of U.S. turkey exports have gone to Mexico, with the share reaching as high as 74 percent of all shipments in July 2014. As exports have recovered, the share of shipments going to Mexico has generally risen as well—apart from seasonal patterns. As domestic prices continue to stay below historical levels and cold storage stocks remain high, the export market is expected to remain an attractive option for producers. Exports have averaged 11 percent of production over the last 12 months, up from just under 10 percent in the previous 12-month period. Annually, exports are expected to grow further in 2018 to 663 million pounds, a 7-percent increase over 2017. In 2019, turkey meat exports are expected to total 655 million pounds, or a 1-percent decline from the strong export totals in 2018. This chart appears in the ERS Livestock, Dairy, and Poultry Outlook newsletter released in July 2018.
Friday, July 13, 2018
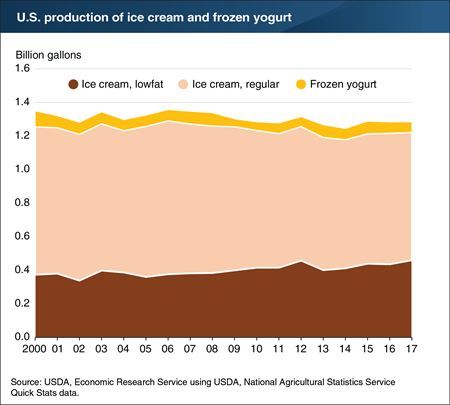
Americans continue to appreciate a cold treat every now and then, according to the latest data on U.S. ice cream and frozen yogurt production. In 2017, domestic production of ice cream (regular and low-fat) and frozen yogurt totaled just under 1.3 billion gallons. In the aggregate, production of ice cream and frozen yogurt has been quite stable, but movement has occurred among categories. As consumers have become more conscious of their intake of fats, the ice cream industry has shifted toward increased production of low-fat ice creams at the expense of regular fat content ice creams. Since 2000, production of low-fat ice cream has increased by 23 percent, while regular ice cream production has decreased by 14 percent. Perhaps due to increased availability of non-dairy ice cream options, frozen yogurt has also declined in prevalence. Production of frozen yogurt is down 34 percent since 2000 and nearly 60 percent since the mid-1990s. This chart is drawn from the ERS Dairy Data product, last updated in June 2018.


