ERS Charts of Note
Subscribe to get highlights from our current and past research, Monday through Friday, or see our privacy policy.
Get the latest charts via email, or on our mobile app for  and
and 
Friday, July 6, 2018
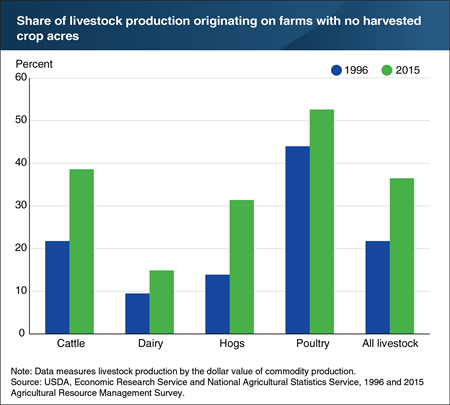
Livestock production has become increasingly specialized, relying less on homegrown and more on purchased feed. Since fully specialized farms have no cropland to absorb manure as fertilizer, they must move their manure off the farm. In 2015, 37 percent of all livestock were produced on farms that had no crop production, up from 22 percent in 1996. Specialization grew in each major livestock commodity during this period. In 2015, nearly 53 of all poultry production occurred on farms that raised no crops, up from 44 percent in 1996. Poultry manure is lighter than other manure and easier to transport, making it cheaper for a contract poultry operation to dispose of all its manure off the farm and reducing the incentive to grow crops on farm. Specialization increased substantially in hog production, where 31 percent of production occurred on farms with no crops in 2015, up from 14 percent in 1996. This chart appears in the March 2018 ERS report, Three Decades of Consolidation in U.S. Agriculture.
Friday, May 25, 2018
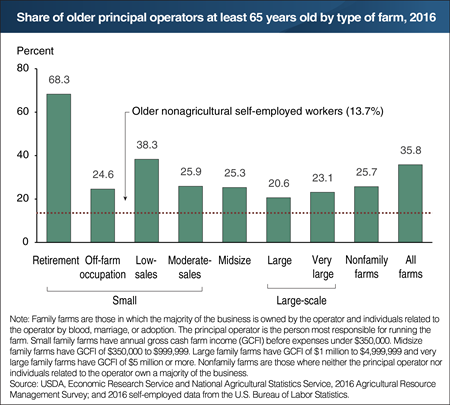
A notable characteristic of principal farm operators (those most responsible for running the farm) is their relatively advanced age. In 2016, 36 percent of principal farm operators were at least 65 years old, compared with only 14 percent of self-employed workers in nonagricultural businesses. Older operators ran 37 percent of all small family farms—those with annual gross cash farm income (GCFI) before expenses under $350,000—including 68 percent of retirement farms and 38 percent of low-sales farms. By comparison, older operators ran 21 percent of large family farms (GCFI of $1 million to $4,999,999) and 23 percent of very large family farms (GCFI of $5 million or more). Improved health and advances in farm equipment enable operators to farm later in life than in past generations. The farm is also home for most farmers, and they can gradually phase out of farming by renting out or selling parcels of their land. Some larger, more commercially oriented farms run by older farmers may have a younger, secondary operator who might eventually replace the principal operator. This chart appears in the ERS report America's Diverse Family Farms: 2017 Edition, released December 2017.
Thursday, May 10, 2018
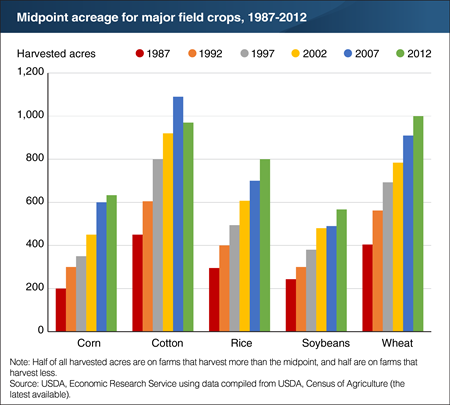
Over the last three decades, the midpoint acreage—where half of acres are on farms that harvest more than the midpoint, and half are on farms that harvest less—has shifted to larger farms for almost all crops. In 1987, for example, the midpoint for corn was 200 acres, which increased to 600 acres by 2012. Four other major field crops (cotton, rice, soybeans, and wheat) showed a very similar pattern: the midpoint for harvested acreage more than doubled for each crop between 1987 and 2012. The midpoints also increased persistently in each census year, with the single exception of a decline in cotton in 2012. ERS researchers repeated the analysis for a total of 55 crops in all. Consolidation was nearly ubiquitous, as the midpoint increased in 53 of 55 major field and specialty crops between 1987 and 2012. Consolidation was also substantial, as most of these midpoint increases were well over 100 percent—and it was persistent, as most midpoints increased in most census years. This chart appears in the ERS report Three Decades of Consolidation in U.S. Agriculture, released March 2018.
Thursday, March 15, 2018
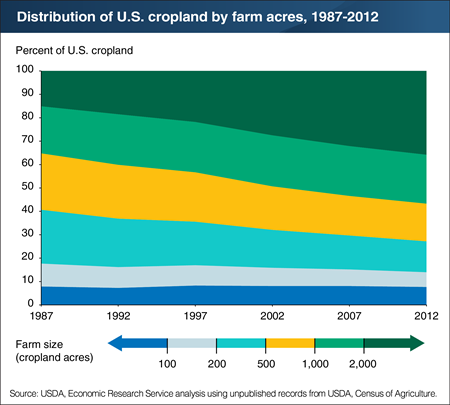
Agricultural production has shifted to much larger farming operations over the last three decades. In 1987, more than half (57 percent) of all U.S. cropland was operated by midsize farms that had between 100 and 999 acres of cropland. The largest farms with at least 2,000 acres operated only 15 percent of U.S. cropland that year. By 2012, midsize farms held 36 percent of cropland, the same share as that held by the largest farms. That shift occurred persistently over time, as the share held by the largest farms increased in each Census of Agriculture after 1987—in 1992, 1997, 2002, 2007, and 2012—while the share held by midsize farms fell in each census. By comparison, the share of cropland held by the smallest farms with less than 100 acres changed little over time, remaining at about 8 percent. Consolidation can occur through shifts in ownership, as operators of larger farms purchase land from retiring operators of midsize farms. However, most cropland is rented, and farms frequently expand by renting more cropland, often from retired farmers and their relatives. This chart appears in the ERS report, Three Decades of Consolidation in U.S. Agriculture, released March 2018.
Thursday, March 1, 2018
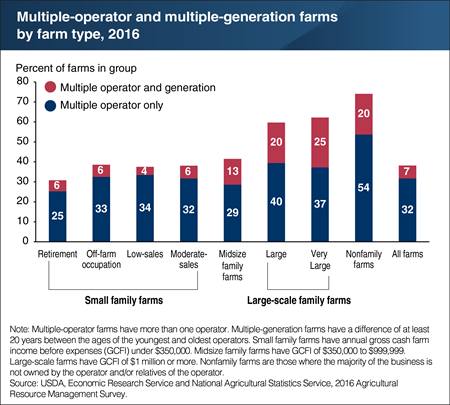
Commercial-sized farms often require more management and labor than an individual can provide. Additional operators can offer these and other resources, such as capital or farmland. Having a secondary operator may also provide a successor when an older principal operator phases out of farming. In 2016, nearly 40 percent of all U.S. farms had a multiple operators. Because nearly all farms are family owned, family members often serve as secondary operators. For example, 64 percent of secondary operators were spouses of principal operators. Some multiple-operator farms were also run by multiple generations, with a difference of at least 20 years between the ages of the youngest and oldest operators. These multiple-generation farms accounted for about 7 percent of all U.S. farms. Large-scale family farms and nonfamily farms were more likely to be operated by multiple generations, at about 20-25 percent of those farms. However, the operators in nonfamily multiple-generation farms were likely unrelated managers from different generations. This chart appears in the December 2017 ERS report, America’s Diverse Family Farms, 2017 Edition.
Wednesday, January 24, 2018
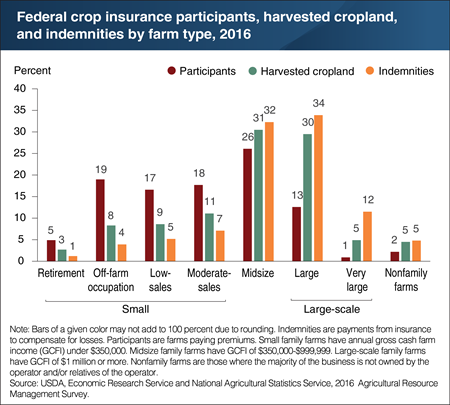
In recent Farm Acts, emphasis has shifted to a greater reliance on risk management through insurance and less reliance on income support through Government payments from commodity programs. Indemnities—payments from Federal crop insurance to compensate for losses—are roughly proportional to acres of harvested cropland. In 2016, midsize family farms and large family farms together accounted for 66 percent of indemnities and 61 percent of harvested cropland. These farms’ high share of indemnities reflects their high participation in Federal crop insurance. About two-thirds of midsize farms and three-fourths of large farms participated in Federal crop insurance, compared with only one-sixth of all U.S. farms. Grain farms—the most common specialization among midsize and large family farms—accounted for 67 percent of all participants in Federal crop insurance and 64 percent of harvested cropland in 2016. This chart appears in the ERS report America’s Diverse Family Farms, 2017 Edition, released December 2017.
Monday, December 18, 2017
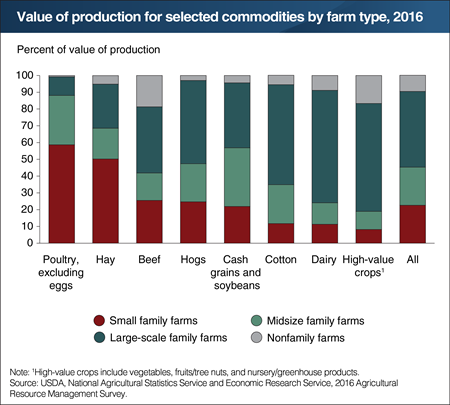
Farm production has been shifting to larger farms for many years, but this trend varies by commodity. In 2016, over 45 percent of U.S. farm production occurred on the 3 percent of U.S. farms classified as large-scale family farms—with at least $1 million in annual gross cash farm income before expenses (GCFI). These farms accounted for half of hog production and two-thirds of the production of both dairy and high-value crops like fruits and vegetables. Large-scale farms also contributed 60 percent of cotton’s value of production. By comparison, small family farms—with less than $350,000 GCFI—accounted for 90 percent of U.S. farms, but contributed less than 23 percent to U.S. farm production. These small farms, however, contributed larger shares of production for poultry (59 percent) and hay (50 percent). Nonfamily farms, which accounted for 1 percent of U.S. farms, contributed about 10 percent of U.S. farm production. This chart appears in the ERS report America’s Diverse Family Farms, 2017 Edition, released December 2017.
Friday, December 1, 2017
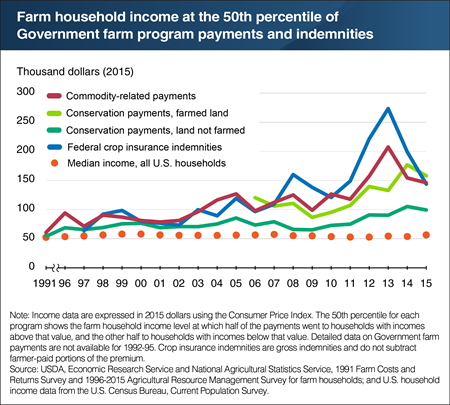
USDA’s commodity, Federal crop insurance, and conservation programs provided about $16.9 billion in financial assistance to farm producers and landowners in 2015. Over time, as agricultural production shifted to larger farms, these programs’ payments shifted to higher-income households—which often operate larger farms. In 1991, half of commodity program payments went to farms operated by households with incomes over $60,717 (adjusted for inflation). By 2015, this midpoint value, at which half of payments went to households with higher incomes, was $146,126. Similar trends hold for other programs, though with variability across programs and over time. For example, the midpoint income level for crop insurance indemnity payments increased from 2010 to 2013, but by 2015 had dropped below the 2008 level, to $143,806. For context, the median U.S. household income shows little change over the period and in 2015 was $56,516. Payments from commodity programs reduce financial risks to specific commodity producers, while payments from federally subsidized crop insurance mitigate yield and revenue risks. Payments from conservation programs aim to conserve natural resources and reduce environmental impacts from farming. This chart appears in the ERS report The Evolving Distribution of Payments from Commodity, Conservation, and Federal Crop Insurance Programs, released November 2017.
Friday, November 24, 2017
Errata: On November 24, 2017, the Chart of Note article “Cropland is shifting to larger farms, even as average size changes little” was reposted to correct a mislabeling in the chart’s legend.
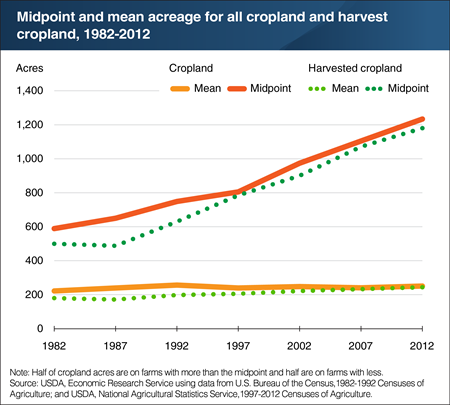
U.S. cropland has shifted to larger farms over time. However, between 1982 and 2012, the average (or mean) acres of cropland and harvested cropland changed little. Acreage averages have been stable because the largest and smallest crop farms grew in number, while farms in the middle declined. With only small changes in total cropland and total crop farms, average acreages changed minimally. The trend in midpoint acreage—at which half of all cropland acres are on farms with more cropland than the midpoint and half are on farms with less—captures the consolidation of cropland better than average acreage. As cropland shifts to larger farms, the midpoint increases. Between 1982 and 2012, the midpoint acreage for both cropland and harvested cropland roughly doubled to about 1,200 acres each. This shift was aided by technologies that allowed a single farmer or farm household to farm more acres. This chart appears in the ERS report America's Diverse Family Farms, 2016 Edition, released December 2016.
Tuesday, August 15, 2017
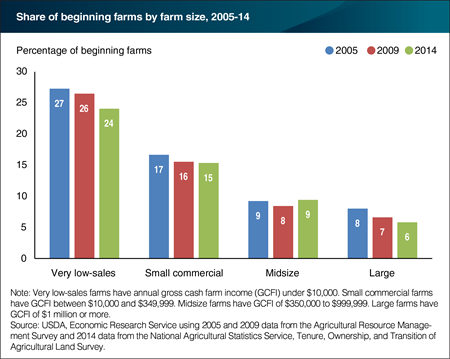
The aging of the overall farm population raises questions about whether there are enough beginning farms to replace those that exit farming. Between 2005 and 2014, the share of beginning farms generally declined across all farm sizes, though overall farm numbers were relatively steady during this period. A beginning farm is one where all operators have 10 years or less farming experience. Very-low sales farms—those with annual gross cash farm income (GCFI) under $10,000—had the most beginning farms across these years, but also saw the greatest decline: from 27 percent in 2005 to 24 percent in 2014. By comparison, the share of beginning midsize farms—those with GCFI between $350,000 and $999,999—hovered around 9 percent during this period. In 2014, that represented about 12,000 midsize farms. This chart and the factors affecting these results appear in the ERS report The Changing Organization and Well-Being of Midsize U.S. Farms, 1992-2014, released October 2016.
Thursday, May 25, 2017
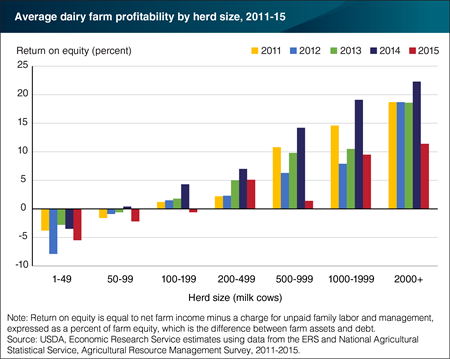
On average, larger dairy farms earn higher profits than smaller farms, spurring a steady shift of cows and production to larger operations. Between 2011 and 2015, farms with at least 1,000 milk cows earned the highest average rates of return on equity (ROE), a measure of profitability that captures the return to the capital that farmers have invested in the business. According to the 2012 Census of Agriculture (the latest data), these farms accounted for nearly half of all cows. By comparison, farms with less than 100 cows generally had negative average ROE between 2011 and 2015, but accounted for only 17 percent of all cows in 2012. Average ROE data can mask variation at the farm level: some farms are profitable and others are not. Low and negative ROE indicate that dairy farmers could earn more by investing their money elsewhere. Dairy farming carries financial risks for farms in all herd size classes. For example, ROE rose in 2014 as the prices that farmers receive for their milk rose to well over $20 per hundredweight of milk, but then fell sharply the following year as monthly milk prices declined by about 30 percent. This chart updates data from the ERS report Changing Structure, Financial Risks, and Government Policy for the U.S. Dairy Industry, released March 2016.
Tuesday, March 7, 2017
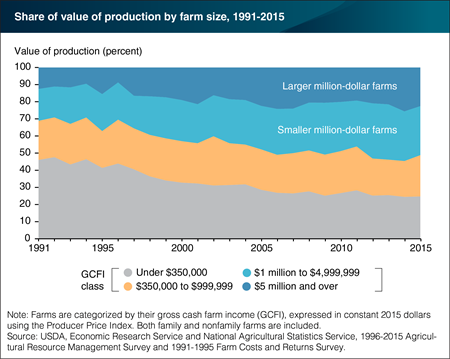
Agricultural production has been shifting to larger farms for many years. Farms with over $1 million in gross cash farm income (GCFI) accounted for half of the value of U.S. farm production in 2015, up from about a third in 1991. Most million-dollar farms (90 percent) are family farms; only 10 percent are nonfamily farms. Larger million-dollar farms (over $5 million in GCFI) nearly doubled their share of production between 1991 and 2015. Smaller million-dollar farms (GCFI between $1 million and $4,999,999) increased their share from 19 percent to 29 percent. This marks a shift in the share of production from small farms (GCFI under $350,000). Small farms accounted for 46 percent of production in 1991; by 2015, they accounted for less than 25 percent. Farmers who take advantage of ongoing innovations to expand their operations can reduce costs and raise profits because they can spread their investments over more acres. This chart appears in the ERS report America's Diverse Family Farms, 2016 Edition, released December 2016.
Thursday, January 26, 2017
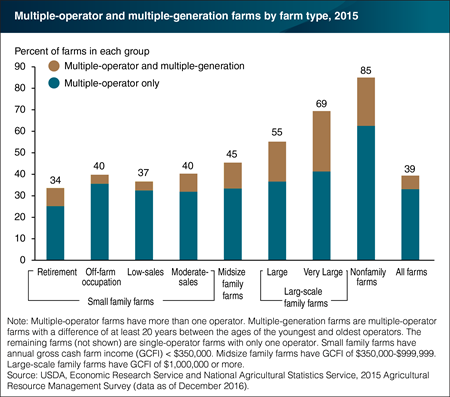
Commercial-sized farms often require more management and labor than an individual can provide. Additional operators can offer these and other resources, such as capital or farmland. Having a secondary operator may also provide a successor when an older principal operator phases out of farming. In 2015, 39 percent of all U.S. farms (811,000 farms) had secondary operators. Because nearly all farms are family-owned, family members often serve as secondary operators; nearly two-thirds of all secondary operators were spouses of principal operators. Multiple-operator farms are most prevalent among nonfamily farms, accounting for 85 percent of that group. Some multiple-operator farms are also run by multiple generations. About 6 percent of all farms (and 16 percent of all multiple-operator farms) were multiple-generation farms, with at least 20 years’ difference between the ages of the oldest and youngest operators. Very large family farms had the highest share of operators from multiple generations: about 28 percent of these farms. This chart appears in the topic page for Farm Structure and Organization, updated December 2016.
Thursday, December 22, 2016
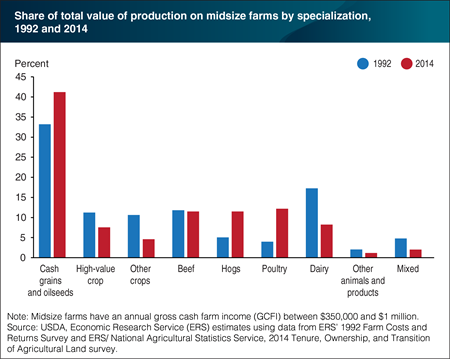
Midsize farms, those with gross cash farm income between $350,000 and $1 million, concentrate their production on grains and oilseeds. In 2014, over 40 percent of midsize farm production occurred on farms that specialized in these crops—8 percentage points higher than in 1992. Midsize farms that specialized in hogs and poultry also accounted for a higher share of production in 2014 than in 1992. However, midsize farms specializing in dairy, high-value crops, and other crops (such as tobacco and peanuts) represented a smaller share in 2014. Midsize dairy farms, for example, declined in number over this period—and total dairy production became more concentrated on large farms. Midsize farm contribution to total U.S. production has also declined from 26.7 percent to 20.9 percent during this period. This chart appears in the ERS report The Changing Organization and Well-Being of Midsize U.S. Farms, 1992-2014, released October 31, 2016.
Wednesday, December 7, 2016
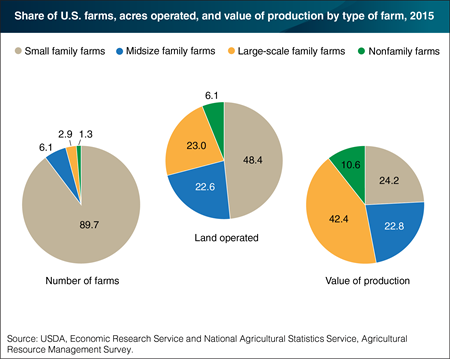
In 2015, 99 percent of U.S. farms were family farms, where the principal operator and his or her relatives owned the majority of the business. Small family farms—those with less than $350,000 in annual gross cash farm income (GCFI)—accounted for about 90 percent of U.S. farms, half of all farmland, and a quarter of the value of production. Midsize and large-scale family farms, which have at least $350,000 in GCFI, made up only 9 percent of U.S. farms—but contributed most of the value of production (65 percent). Over the past 25 years, production has shifted to midsize and large-scale farms. Nevertheless, small family farms did produce a relatively large share of two commodities in 2015: poultry and eggs (57 percent) and hay (52 percent). This chart appears in the ERS report America’s Diverse Family Farms: 2016 Edition , released December 6, 2016.
Tuesday, November 1, 2016
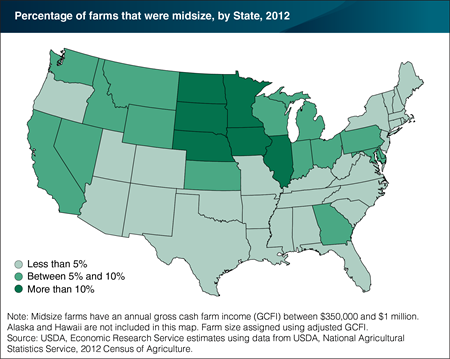
Midsize farms, those with gross cash farm income (GCFI) between $350,000 and $1 million, represent an important link in the chain of family farms. Many U.S. midsize farms start out as successful small commercial farms, and as many as 15 percent of today’s midsize farms will become tomorrow’s large farms. In 2012, the U.S. had 125,441 midsize farms—the majority of which (over 70,000 farms) specialized in cash grains and oilseed crops. Another 15,000 midsize farms specialized in beef cattle. Midsize farms were found in greater proportions and numbers in the northern Great Plains (North Dakota, South Dakota, and Nebraska) and the Heartland (Iowa, Illinois, and Indiana) because these regions are best suited to growing cash grains and oilseed crops. In 2014, midsize farms in these two regions contributed nearly half of the total value of production on midsize farms. That same year, midsize farms accounted for about 6 percent of U.S. farms and 21 percent of the total value of production. This chart appears in the ERS report The Changing Organization and Well-Being of Midsize U.S. Farms, 1992-2014, released October 31, 2016.
Tuesday, October 4, 2016
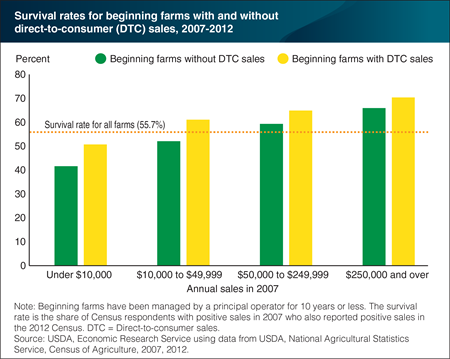
Beginning farmers, those who have managed a farm or ranch for 10 years or less, generally have lower rates of business survival than more established farm operators. According to Census of Agriculture data, only 48.1 percent of beginning farmers with positive sales in 2007 also reported positive sales in 2012—compared with 55.7 percent of all farms. Running a larger operation and selling directly to consumers (at roadside stands, farmers’ markets, and so on) may help beginning farmers remain in business. As a whole, beginning farms with direct-to-consumer (DTC) sales had a 54.3 percent survival rate, while 47.4 percent of those without DTC sales survived. This pattern holds across operations of different sizes, as defined by annual sales. The difference in survival rates was substantial—ranging from 9 percentage points for the smallest farms to about 4 percentage points for the largest. Farmers with DTC sales can usually get a higher product price and reach a certain level of sales with less machinery and land. In turn, these farmers may have a more stable income and need to borrow less—further increasing chances of survival. This chart appeared in the September 2016 Amber Waves finding, “For Beginning Farmers, Business Survival Rates Increase With Scale and With Direct Sales to Consumers."
Wednesday, September 21, 2016
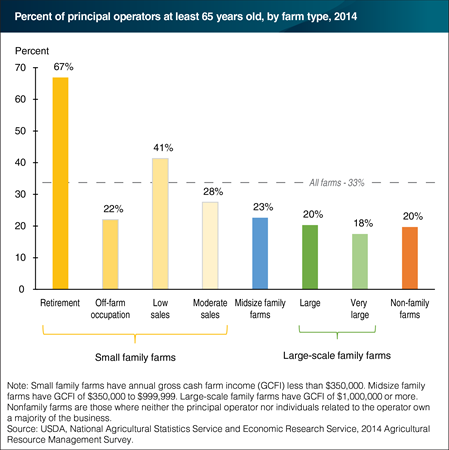
A notable characteristic of principal farm operators—the person most responsible for running the farm—is their relatively advanced age. In 2014, 33 percent of principal farm operators were at least 65 years old. This is nearly three times the U.S. average (12 percent) for older self-employed workers in nonagricultural businesses, according to the U.S. Bureau of Labor Statistics. Most older principal farm operators run small family farms. Retirement farms had the highest percentage of older operators (67 percent), followed by low-sales farms (41 percent) and moderate sales farms (28 percent). Older operators made up about one-fifth of each of the remaining groups. The advanced age of farm operators is understandable. The farm is also home for most farmers and they can gradually phase out of farming. Improved health and advances in farm equipment also allow operators to farm later in life than in past generations. This chart appears in the 2015 ERS report America’s Diverse Family Farms.
Tuesday, July 12, 2016
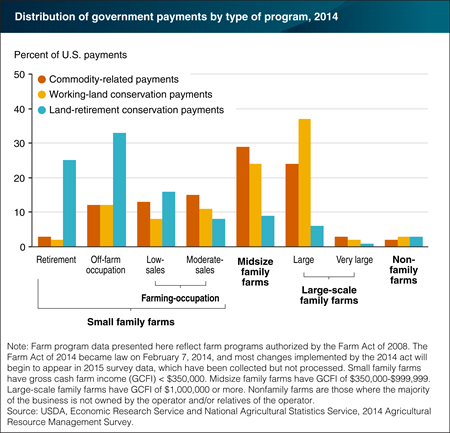
Farmers can receive government farm program payments from three broad categories of agricultural programs: commodity-related programs, working-land conservation programs, and land-retirement conservation programs. The distribution of payments in each category varies by farm type. In 2014, nearly 70 percent of commodity-related program payments went to moderate-sales, midsize, and large family farms, roughly proportional to their 80-percent share of acres in program-eligible crops. Midsize and large family farms together received about 60 percent of working-land payments that help farmers adopt conservation practices on agricultural land in production. Land-retirement programs pay farmers to remove environmentally sensitive land from production. Retirement, off-farm occupation, and low-sales farms received about three-fourths of these payments. Retired farmers and older farmers on low-sales farms may be more likely to take land out of production as they scale back their operations. Although government farm program payments can be important to the farms receiving them, 75 percent of farms in 2014 received no government payments. (These data summarize payments made in 2014. The Farm Act that was passed in 2014 introduced changes to commodity programs as part of a shift to greater reliance on crop insurance; most of those changes will be reflected in the source data beginning in 2015. Nevertheless, who receives particular government payments will continue to reflect farm and operator characteristics.) This chart is found in the ERS report America’s Diverse Family Farms: 2015 Edition.
Friday, June 10, 2016
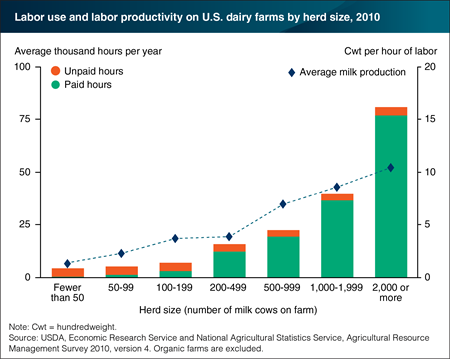
Most labor on small U.S. dairy farms is provided by the operator and the operator’s family, whereas large dairy farms, while usually still family-owned and operated, rely extensively on hired labor. Labor productivity—output of milk per hour of labor—is much higher on larger dairy farms, with the largest (farms with milking herds of at least 2,000 cows) realizing 10 hundredweight (cwt) per hour of labor, compared to 2-4 cwt per hour on farms with herds of 50-500 head. Large farms operate differently than small dairy farms, as their size allows them to apply practices and technologies that result in higher milk yields and labor productivity. For example, farms with at least 500 cows are much more likely to milk three times a day, while smaller farms typically milk twice a day. Thrice-daily milking raises per-cow milk yields, allows farms to offer more work and higher pay to their hired labor, and creates more intensive use of milking equipment. Greater labor productivity is one source of the cost advantages accruing to larger dairy operations. This chart is based on data found in the ERS report, Changing Structure, Financial Risks, and Government Policy for the U.S. Dairy Industry, March 2016.


