ERS Charts of Note
Subscribe to get highlights from our current and past research, Monday through Friday, or see our privacy policy.
Get the latest charts via email, or on our mobile app for  and
and 
Tuesday, August 12, 2014
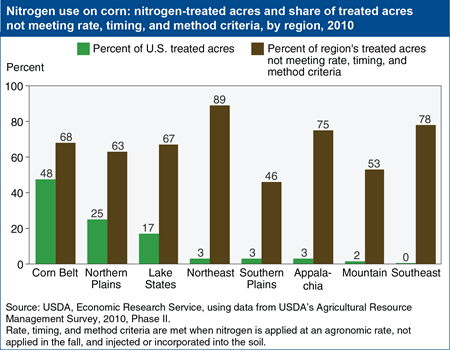
Corn is the most widely planted crop in the U.S. and the largest user of nitrogen fertilizer. By using this fertilizer, farmers can produce high crop yields profitably; however nitrogen is also a source of environmental degradation when it leaves the field through runoff or leaching or as a gas. When the best nitrogen management practices aren’t applied, the risk that excess nitrogen can move from cornfields to water resources or the atmosphere is increased. Nitrogen management practices that minimize environmental losses of nitrogen include applying only the amount of nitrogen needed for crop growth (agronomic rate), not applying nitrogen in the fall for a crop planted in the spring, and injecting or incorporating fertilizer into the soil rather than leaving it on top of the soil. In 2010, about 66 percent of all U.S. corn acres did not meet all three criteria. Nitrogen from the Corn Belt, Northern Plains, and Lake States (regions that together account for nearly 90 percent of U.S. corn acres) contribute to both the hypoxic (low oxygen) zone in the Gulf of Mexico and to algae blooms in the Great Lakes. This chart is based on data found in the ERS report, Nitrogen Management on U.S. Corn Acres, 2001-10, EB-20, November 2012.
Tuesday, July 29, 2014
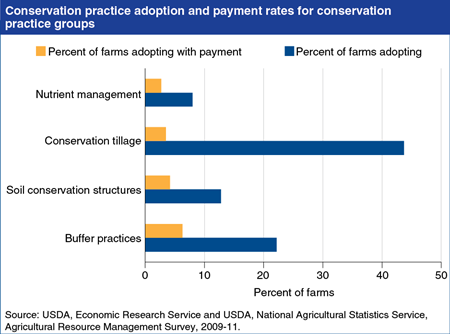
The Federal Government spent more than $6 billion in fiscal 2013 on conservation payments to encourage the adoption of practices addressing environmental and resource conservation goals, but such payments lead to additional improvement in environmental quality only if those receiving them adopted conservation practices that they would not have adopted without the payment. Some farmers have adopted specific conservation practices without receiving payments because doing so reduces production costs or preserves the long-term productivity of their farmland (e.g., conservation tillage). Many other farmers have not adopted conservation practices, presumably because the cost of doing so exceeds expected onfarm benefits, the value of which can vary based on many factors—soil, climate, topography, crop/livestock mix, producer management skills, and risk aversion. Since the value of onfarm benefits can vary widely across practices and farms, identifying which farmers will adopt a conservation practice only if they receive a payment is not straightforward, but research indicates that the likelihood a payment will result in additional environmental benefits increases as the implementation cost of the conservation practice increases and its impact on farm profitability declines. This chart is found in the ERS report, Additionality in U.S. Agricultural Conservation and Regulatory Offset Programs, ERR-170, July 2014.
Friday, June 27, 2014
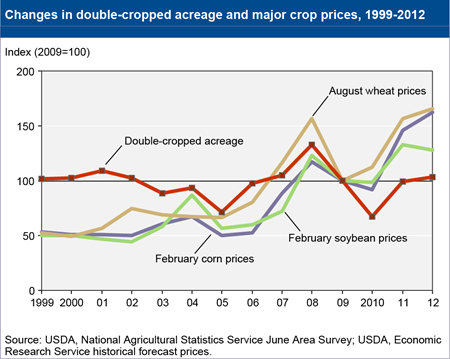
Double-cropped acreage has varied from year to year. Because decisions about double cropping are made annually, fluctuations are likely as farmers respond to changing market and weather conditions. For example, higher commodity prices give farmers more incentive to intensify production and could offset revenue shortfalls from lower potential yields when double cropping. From 2004 to 2012, total double-cropped acreage roughly paralleled soybean, winter wheat, and corn prices. When commodity prices at the time of planting decisions were increasing or relatively high, total double-cropped acreage also increased. Total double-cropped acreage peaked at 10.9 million acres in 2008, when prices for soybeans, winter wheat, and corn also peaked. In 2005 and 2010, nearly every region witnessed declines in double-cropped acreage amid commodity price declines. This chart is found in the ERS report, Multi-Cropping Practices: Recent Trends in Double-Cropping, EIB-125, May 2014.
Tuesday, June 24, 2014
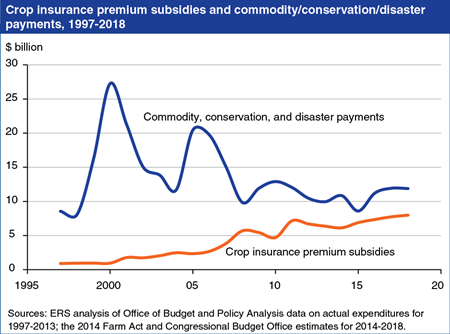
The 2014 Farm Act adds crop insurance premium subsidies to the list of benefits that could be withheld for noncompliance with conservation provisions, further supporting farmer incentives for environmental stewardship. Producers who fail to apply approved soil conservation plans on highly erodible cropland or who drain wetlands could become ineligible for all or part of a number of commodity programs, conservation programs, disaster assistance, and now crop insurance premium subsidies. In recent years, the value of such subsidies has increased as premium subsidy rates, crop insurance participation, and commodity prices all rose. On average, the Federal Government pays roughly 60 percent of crop insurance premiums, and about 80 percent of acreage for all major commodity crops is now covered by crop insurance. In 2012, crop insurance premium subsidies were roughly $6.7 billion or about 60 percent as large as commodity, conservation, and disaster assistance payments combined. This chart is found on the Conservation page in Agricultural Act of 2014: Highlights and Implications, on the ERS website.
Thursday, May 29, 2014
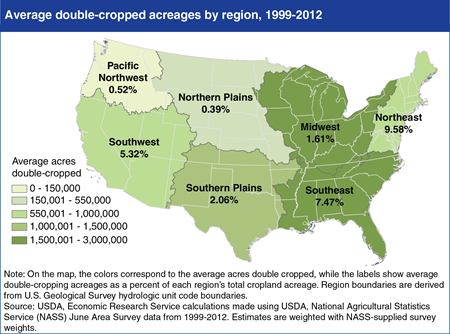
Over the last decade, growing demand for agricultural commodities—for both food and fuel—has increased the incentives for farm operators to raise production. Double cropping, the harvest of two crops from the same field in a given year, has drawn interest as a method to intensify production without expanding acreage. In the U.S., the prevalence of double cropping varies by region. The variation across regions reflects farmers’ response to local conditions such as weather, climate (particularly growing season length), policy differences, and market incentives. The Southeast, Midwest, and Southern Plains regions lead the country in total double-cropped acreage. About one-third of the total double-cropped acreage over 1999-2012 was in the Southeast (2.7 million acres on average), and slightly more than one-fifth was in the Midwest (1.8 million acres on average). However, relative to each region’s total cropland acreage, the Northeast, Southeast, and Southwest all have larger shares of cropland used in double cropping than other regions. The Northeast had the largest share of double-cropped acreage (nearly 10 percent, on average) of the region’s total cropland, and the Northern Plains had the smallest (less than 0.5 percent on average). This chart is found in the ERS report, Multi-Cropping Practices: Recent Trends in Double-Cropping, EIB-125, May 2014.
Funding for conservation shifts towards working land conservation under the Agricultural Act of 2014
Wednesday, March 19, 2014
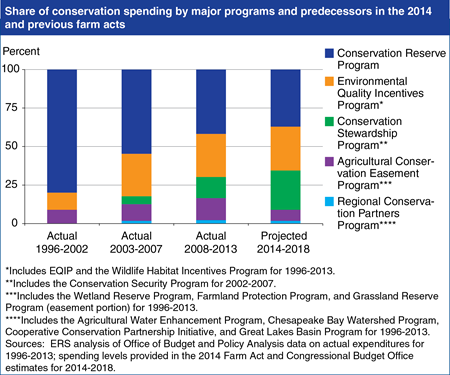
Between 2014 and 2018, the Agricultural Act of 2014 calls for mandatory spending on USDA conservation programs to decline by $200 million, or less than one percent of the $28 billion (for the entire 5 year period) that the Congressional Budget Office projects would have been spent if the 2008 Farm Act had continued through 2018. However, funding will shift from land retirement and conservation easement programs (e.g., Conservation Reserve Program (CRP) and the Agricultural Conservation Easement Program and predecessors) to working land conservation programs (the Environmental Quality Improvement Program (EQIP) and Conservation Stewardship Program (CSP)). Combined funding for EQIP and CSP is projected to account for more than 50 percent of conservation spending during 2014-2018. These programs (and predecessors) accounted for just over 40 percent of spending during 2008-2013 and 32 percent during 2003-2007. Although CSP funding will be higher during 2014-2018 than during 2008-2013, a large share will go to servicing CSP contracts signed during 2008-2012. Under the 2014 Farm Act, USDA can enroll up to 10 million acres per year, down from 12.789 million acres per year under the 2008 Farm Act (2008-2012). This chart is found in the ERS analysis of 2014 Agricultural Act Impacts.
Nutrition programs projected to account for 80 percent of outlays under the Agricultural Act of 2014
Wednesday, March 12, 2014
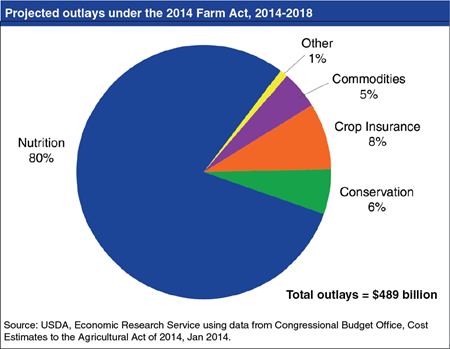
The new U.S. farm bill, the Agricultural Act of 2014, was signed on February 7, 2014 and will remain in force through 2018. The 2014 Act makes major changes in commodity programs, adds new crop insurance options, streamlines conservation programs, modifies provisions of the Supplemental Nutrition Assistance Program (SNAP), and expands programs for specialty crops, organic farmers, bioenergy, rural development, and beginning farmers and ranchers. The Congressional Budget Office (CBO) projects that 80 percent of outlays under the 2014 Farm Act will fund nutrition programs, 8 percent will fund crop insurance programs, 6 percent will fund conservation programs, 5 percent will fund commodity programs, and the remaining 1 percent will fund all other programs, including trade, credit, rural development, research and extension, forestry, energy, horticulture, and miscellaneous programs. Find this chart and additional information on the new U.S. farm bill on the Farm Bill Resources pages.
Monday, February 10, 2014
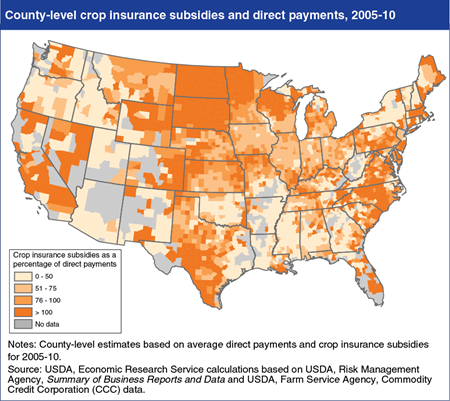
Under environmental compliance, U.S. farmers who crop highly erodible land without applying an approved soil conservation system or who drain wetlands risk losing all or part of many Federal agricultural payments. The Agricultural Act of 2014 makes several changes which, on balance, continue to provide compliance incentives. Direct payments, which were paid to farmers regardless of economic conditions, were eliminated, but the act makes crop insurance premium subsidies subject to compliance, along with other continuing or new conservation and commodity programs. In some areas (those where the ratio of average insurance subsidies to direct payments for 2005-2010 exceeds 100 percent), the loss of direct payments will be more than offset by making crop insurance premium subsidies subject to compliance. In other areas, where direct payments were large relative to premium subsidies, compliance incentives will depend more heavily on new commodity programs. This map is found in the ERS report, The Future of Environmental Compliance Incentives in U.S. Agriculture, EIB-94, March 2012.
Wednesday, January 29, 2014
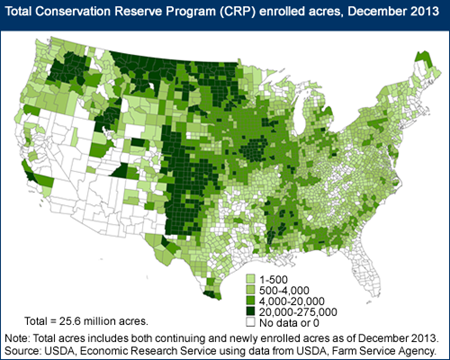
The Conservation Reserve Program (CRP) covered about 26 million acres of environmentally sensitive land at the end of 2013, with an annual budget of roughly $2 billion (currently USDA’s largest conservation program in terms of spending). Enrollees receive annual rental and other incentive payments for taking eligible land out of production for 10 years or more. Program acreage tends to be concentrated on marginally productive cropland that is susceptible to erosion by wind or rainfall. A large share of CRP land is located in the Plains (from Texas to Montana), where rainfall is limited and much of the land is subject to potentially severe wind erosion. Smaller concentrations of CRP land are found in eastern Washington, southern Iowa, northern Missouri, and the Mississippi Delta. This chart appears in ERS’s data product, Ag and Food Statistics: Charting the Essentials.
Friday, December 6, 2013
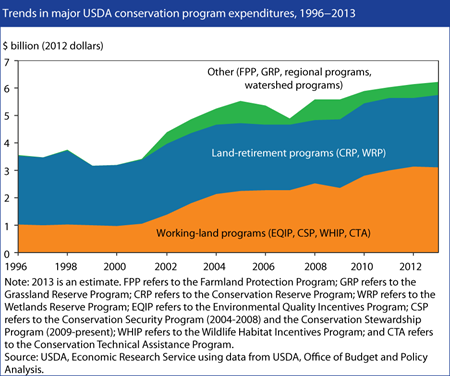
USDA relies mainly on voluntary programs providing technical and financial support to encourage farmers to conserve natural resources and protect the environment. Land-retirement programs remove environmentally sensitive land from production, while working-land programs provide assistance to farmers who install or maintain conservation practices on land in crop production and grazing. Common practices include nutrient management, conservation tillage, field-edge filter strips, and fences to exclude livestock from streams. Support for conservation through USDA programs increased by roughly 70 percent between 1996 and 2012 and now amounts to roughly $5 billion annually. A large majority of the increase occurred in working land programs, including the Environmental Quality Incentives Program (EQIP), the Conservation Security Program (2004-2008) and the Conservation Stewardship Program (2009-present). These and other programs, such as agricultural land preservation programs that purchase development rights from farmland owners to maintain land in agricultural uses, supplement land retirement programs and provide farmers with a wide range of options to support their conservation efforts. This chart is found in Ag and Food Statistics: Charting the Essentials on the ERS website.
Monday, May 6, 2013
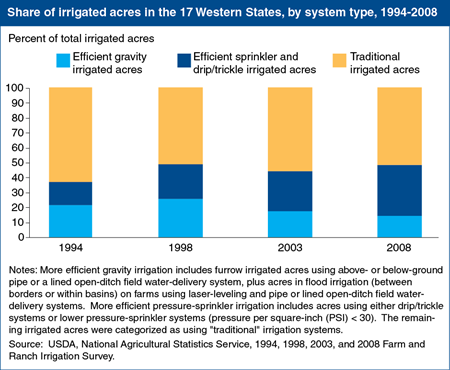
U.S. agriculture accounts for 80-90 percent of the Nation’s consumptive water use (water lost to the environment by evaporation, crop transpiration, or incorporation into products). The 17 Western States account for nearly three-quarters of U.S. irrigated agriculture. While substantial technological innovation has already occurred in irrigation systems, significant room for improvement in farm irrigation efficiency still exists. Between 1994 and 2008, the combined share of Western irrigated acres using improved gravity-flow and low-pressure sprinkler systems has increased but the rate at which traditional irrigation systems have been replaced with more efficient, improved systems has slowed over the past decade. This chart comes from the Amber Waves September 2012 finding, Improving Water-Use Efficiency Remains a Challenge for U.S. Irrigated Agriculture.
Monday, April 22, 2013
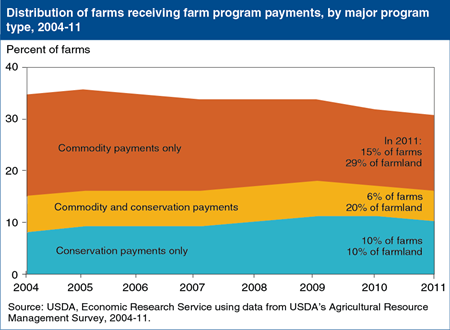
Existing conservation and farm commodity programs serve multiple purposes. Commodity-based income programs are intended to support farm families historically involved in the production of targeted “program” crops. Conservation payments, on the other hand, are designed to promote environmentally beneficial changes in farmland use or production practices. Conservation payments are available to a much wider range of producers, with nearly all crop and livestock producers eligible for at least one conservation program. In 2011, roughly 31 percent of all U.S. farms received commodity payments, conservation payments, or both. Only 6 percent of farms, however, received both commodity and conservation payments. Fifty-five percent of conservation payments went to farms that did not receive commodity payments, while 63 percent of commodity payments went to farms that did not receive conservation payments. Since 2004, the proportion of farms receiving both conservation and commodity payments has remained fairly constant. This chart updates one found in the March 2012 Amber Waves finding, Green Payments: Can Conservation and Commodity Programs Be Combined?
Tuesday, October 9, 2012
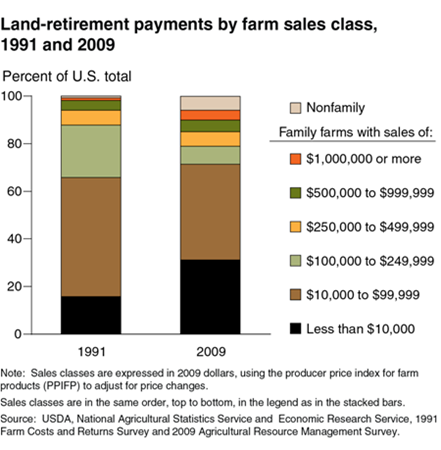
While commodity payments have shifted towards farms with more sales, the situation is different for land-retirement payments, which target environmentally sensitive land and largely come from the Conservation Reserve Program. From 1991 to 2009, family farms with sales less than $10,000 (noncommercial farms) nearly doubled their share of land-retirement payments from 16 percent to 30 percent. Over the same period, the average share of acreage enrolled--the ratio of the acres enrolled to total acres operated--increased from 36 percent to 46 percent for participating noncommercial farms. These increases could be attributed to small farms shifting into the noncommercial class following a substantial land retirement and/or older farmers with small commercial farms scaling their operations down by enrolling in the CRP. This chart comes from Changing Farm Structure and the Distribution of Farm Payments and Federal Crop Insurance, EIB-91, February 2012.
Monday, July 16, 2012
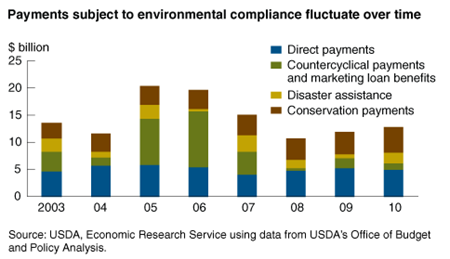
Federal farm program payments help encourage good stewardship of natural resources through environmental compliance requirements. To maintain eligibility for most farm programs, farmers must follow an approved soil conservation plan on all highly erodible land used for crop production. Farmers who do not comply with these requirements, even on a small number of acres, risk losing some or all of their Federal farm commodity, conservation, and disaster payments, as well as access to Federal farm loan and loan guarantee programs. Since 2003, annual farm program payments subject to environmental compliance have fluctuated between $11 billion and $20 billion. Most of the variation can be attributed to countercyclical payments (CCP) and marketing loan benefits (MLB), which are triggered by low crop prices. Since 2007, high prices for most program crops have sharply reduced CCP and MLB payments from their 2005-06 levels. Direct payments have accounted for roughly half of the compliance incentive since 2008. If they are eliminated in the 2012 farm bill, farmers who do not receive conservation or disaster payments (the other major payments subject to environmental compliance) may have less incentive to continue meeting compliance requirements unless these payments are replaced by another type of commodity or insurance program subject to compliance. This chart appeared in the June 2012 issue of Amber Waves magazine.
Tuesday, March 20, 2012
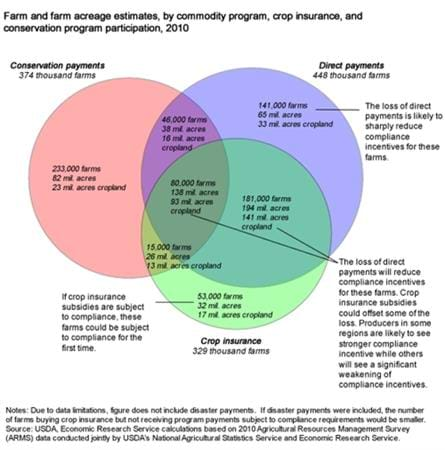
In recent years, direct payments (DPs) have been a key source of environmental compliance (EC) incentives. Under EC, farmers must apply approved soil conservation systems to highly erodible cropland and refrain from draining wetland to maintain eligibility for most USDA agricultural programs. Federally subsidized crop insurance is the only large USDA program that is not currently subject to EC. Direct payments may be reduced or eliminated in the next farm bill (due in 2012) to help reduce the Federal budget deficit. An end to DPs would sharply reduce compliance incentives for many farms. Some farmers (but not all) would continue to be subject to EC because of other payments, primarily conservation and disaster assistance. One way to fill the incentive gap for other farmers would be to extend EC requirements to crop insurance. The extent to which crop insurance could replace compliance incentives now supplied by DPs will depend, in part, on the extent to which farmers who receive DPs also buy crop insurance. Roughly 141,000 farmers (7 percent), operating on 33 million acres of cropland (8 percent), received DPs in 2010 but did not purchase crop insurance or receive conservation payments. For these farms, extending compliance requirements to cover crop insurance would not replace DP incentives. In 2010, 181,000 farms (9 percent), operating on 141 million acres of cropland (36 percent), received DPs and also purchased crop insurance, but did not receive conservation payments. For these farms, making crop insurance subject to compliance sanction could help compensate for compliance incentives lost if direct payments end. Farmers who do not receive DPs or other payments subject to compliance but do purchase crop insurance may be subject to compliance requirements for the first time. In 2010, an estimated 53,000 farms (2.4 percent) with 17 million crop acres (4.3 percent) received neither conservation payments nor DPs but did purchase crop insurance. Some of these farms may already be subject to compliance requirements because of disaster payments. Of course, farms facing compliance requirements based on crop insurance coverage would be affected only if they continued to purchase crop insurance. This chart is found in the ERS report, The Future of Environmental Compliance Incentives in U.S. Agriculture, EIB-94, March 2012.
Tuesday, March 13, 2012
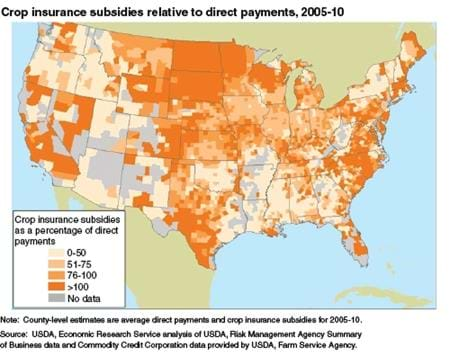
Environmental compliance requires farm program participants to conserve soil on highly erodible cropland and refrain from draining wetlands or risk losing all or part of most farm program payments. Since 2008, "direct payments" have accounted for a large share of payments subject to withholding. Federally subsidized crop insurance is not currently subject to environmental compliance but has been in the past. If direct payments are reduced or eliminated in future farm legislation but crop insurance is again subject to withholding, environmental compliance incentives would change. In many areas where crop production is risky, such as the Northern Plains, crop insurance could provide a conservation incentive that is equal to or even larger than direct payments. In other areas, such as the Mississippi Delta, compliance incentives could decline. This map appears in the March 2012 issue of Amber Waves magazine.
Tuesday, August 23, 2011
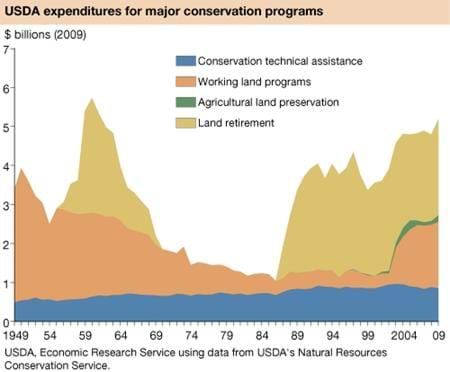
USDA provides technical and financial assistance to help farmers implement conservation practices on working agricultural lands or on lands temporarily retired from production. As measured in constant (2009) dollars, Federal conservation assistance has fluctuated widely during the past 60 years. Rapid increases in spending have typically been associated with large-scale land retirement in the Soil Bank (1956-1972) and Conservation Reserve (1986-present) Programs. Since 2002, however, and after several decades with stable levels of spending, there has been a big increase in conservation assistance through programs that help farmers defray conservation costs on working agricultural lands. This chart may be found in the September 2011 issue of Amber Waves magazine.
Monday, July 25, 2011
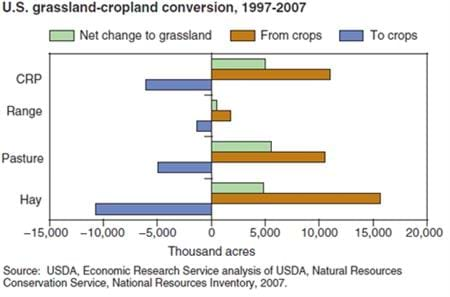
Land that moves between grassland and cultivated cropland is, by definition, at the margin between these uses. Nationally, the most active grassland-cultivated cropland margin between 1997 and 2007 was for hay. More than 26 million acres moved between cultivated crops and hay, resulting in a net shift of 4.8 million acres from cultivated crops to hay. More than 15 million acres moved between cultivated cropland and pasture, resulting in an overall shift of 5.5 million acres from cultivated crops to pasture. In contrast, the margin between cropland and rangeland involved less than 3.1 million acres. Roughly 1.3 million acres of range were converted to cultivated cropland, while 1.8 million acres went the other way for a net conversion from cultivated crops to range of about 500,000 acres. The CRP appeared to serve as a transitional land use between cultivated crop and forage production. Total CRP enrollment was roughly 32 million acres in both 1997 and 2007. During this period, however, 11.1 million acres of cultivated cropland were enrolled in the CRP for the first time while only 6.1 million acres were returned to cultivated crops. This chart is from the ERS report, Grassland to Cropland Conversion in the Northern Plains: The Role of Crop Insurance, Commodity, and Disaster Programs, ERR-120, June 2011.
Wednesday, April 20, 2011
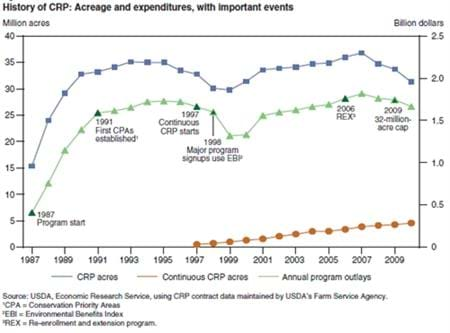
USDA's Conservation Reserve Program (CRP) was established in 1985 and by 1986 began enrolling highly erodible cropland using contracts that retired land from crop production for 10-15 years. Enrollment grew quickly, reaching 33 million acres by 1990. After the initial contracts were awarded, program goals were expanded to include water quality and wildlife habitat improvements in addition to reduced soil erosion. To capture these multiple objectives, an Environmental Benefits Index (EBI) was adopted in the 1990s to rank competing offers for CRP's periodic "general signups," but didn't begin to have a measurable impact on enrollment until 1998. At about the same time, a "continuous CRP signup" began enrolling parcels of land with high environmental benefits outside of the EBI ranking process. Enrollment in continuous programs has steadily increased, as has their role in expanding CRP benefits. Between 1990 and 2008, CRP enrollment fluctuated around 33 million acres. As of February 2010, the program enrolled 31.2 million acres. This includes about 4.5 million acres of continuous signup acres. This chart appeared in the ERS publication, The Influence of Rising Commodity Prices on the Conservation Reserve Program, ERR-110, February 2011.
Monday, March 21, 2011
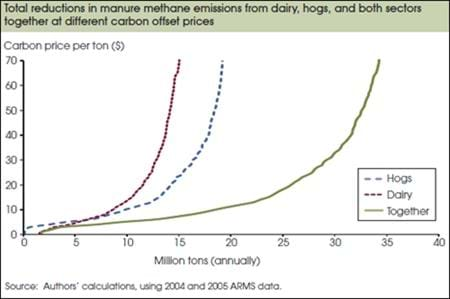
Methane digester systems capture methane from lagoon or pit manure storage facilities and use it as a fuel to generate electricity or heat. In addition to providing a renewable source of energy, digesters can reduce greenhouse gas emissions and provide other environmental benefits. Methane digesters have not been widely adopted in the United States mainly because the costs of constructing and maintaining these systems have exceeded the value of the benefits provided to the operator. But policies to reduce greenhouse gas emissions could make such biogas recovery facilities profitable for many livestock producers. Without a carbon market (when the price is zero), no hog and few dairy operations find it profitable to adopt a digester. As the carbon price increases, more operations adopt digesters, lowering emissions. At a carbon price of $13, greenhouse gas emissions could be reduced by 9.8 and 12.4 million tons (carbon dioxide equivalent) for the dairy and hog sectors, respectively. This amounts to reductions of 61-62 percent of manure-generated methane in these sectors. A doubling of the carbon price to $26 could cause manure-based methane emissions from dairy and hogs together to be reduced by 78 percent. This chart was originally published in Carbon Prices and the Adoption of Methane Digesters on Dairy and Hog Farms, EB-16, February 2011.


