ERS Charts of Note
Subscribe to get highlights from our current and past research, Monday through Friday, or see our privacy policy.
Get the latest charts via email, or on our mobile app for  and
and 
Thursday, December 15, 2016
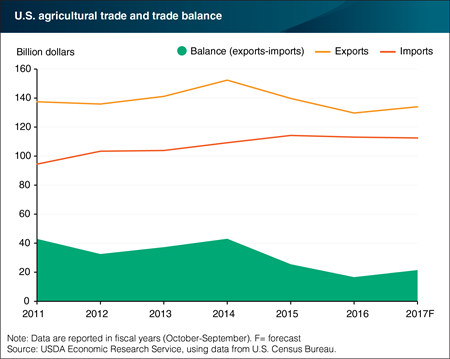
USDA forecasts U.S. agricultural exports in fiscal year 2017 to reach $134 billion, up 1 percent from the previous forecast in August—largely due to expected increases in dairy and livestock byproduct exports. U.S. agricultural imports in fiscal year 2017 are projected at $113 billion, down 1 percent from the August forecast. Reduced imports of horticultural, sugar, and tropical products are leading this decline. As a result, the U.S. agricultural trade surplus is expected to increase to $22 billion in fiscal 2017. The forecasted surplus is an increase compared with the expected $17 billion surplus in fiscal 2016, but nearly half of the 2011 surplus of $43 billion. The U.S. agricultural sector consistently runs a trade surplus, benefiting the overall U.S. trade balance—which has run a deficit every year since 1976. The data in this chart is drawn from ERS’s quarterly Outlook for U.S. Agricultural Trade report released on November 30th, 2016.
Thursday, December 8, 2016
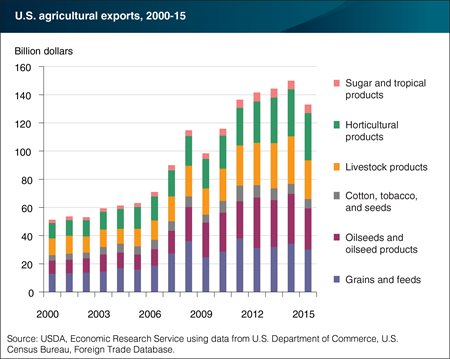
The value of U.S. agricultural exports declined in 2015, reversing 5 consecutive years of export growth. Since 2000, developing countries—led by China—had been the main drivers of U.S. export gains. Horticultural exports were the only product group to grow in 2015, up about $266 million, increasing its share of total U.S. agricultural exports to about 25 percent. In fact, horticultural products had the largest share of any group—surpassing livestock products, grains/feeds, and oilseed/products, which had combined losses in 2015 that accounted for nearly all of the decrease in export values. The drop in export value in 2015 can be attributed, in part, to a stronger U.S. dollar relative to competitors, which made U.S. exports appear more expensive. Additionally, poultry exports were severely limited due to trade restrictions applied following the outbreak of Highly Pathogenic Avian Influenza in several U.S. states in 2015. This chart is from ERS’s Ag and Food Statistics: Charting the Essentials, updated October 2016.
Friday, November 25, 2016
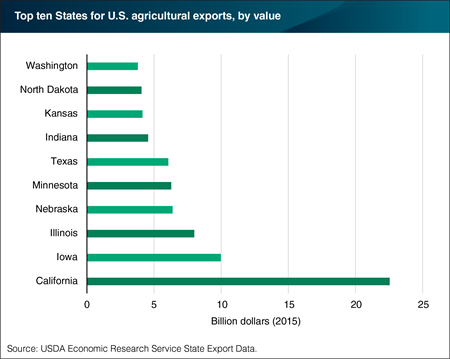
All U.S. States export some agricultural products to markets overseas. While the value of agricultural exports is relatively modest for States like Alaska, Rhode Island, and New Hampshire (less than $100 million in 2015), many States rely on agricultural exports for a large share of their market revenue. The largest beneficiary of overseas markets is California, which contributes 17 percent of all U.S. agricultural exports by value. The $23 billion worth of agricultural goods exported by California in 2015 is more than double the next largest State total, Iowa. Iowa and Illinois exported agricultural goods valued at $10 and $8 billion, respectively, in 2015. To put these numbers in perspective, the 2012 Agricultural Census calculated the total value of agricultural sales in California to be 44 billion dollars, while Iowa and Illinois were valued at 31 and 17 billion, respectively. In California, tree nuts account for the largest share of exports. Soybeans are the most valuable export in five of the top ten exporting States, including Iowa, Illinois, and Nebraska. Other leading export products for States in the top ten exporters include cotton, wheat, and fruits. The data in this chart is drawn from the ERS State Export Data product updated in October 2016.
Tuesday, August 16, 2016
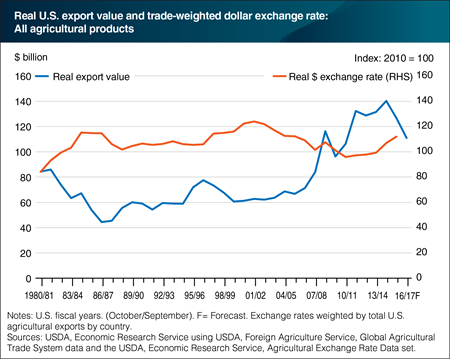
Macroeconomic factors, including the exchange rate of the U.S. dollar, played a key role in the strong growth of U.S. agricultural exports that began in the early 2000s, with exports peaking in U.S. fiscal year (FY) 2014/15 (October/September). While other variables, particularly robust income gains in developing countries, supported market growth, an extended period of dollar depreciation during FY2003-14 increased the competitiveness of U.S. exports. Since FY2014, however, U.S. agricultural exports have declined in real terms as global income growth has slowed and the dollar has strengthened against the currencies of many U.S. agricultural export markets and competitors. A stronger dollar tends to have the greatest impact on U.S. exports of bulk and intermediate goods that are more readily substituted for by exports from other suppliers. Exports of consumer-oriented products that are more differentiated from those of competitors tend to be less affected by a stronger dollar. The real trade-weighted dollar exchange rate is an indicator that accounts for both the change in each country’s exchange rate with the U.S. dollar and its share of U.S. agricultural exports. This is an updated version of a chart found in Global Macroeconomic Developments Drive Downturn in U.S. Agricultural Exports released on July 12, 2016.
Thursday, July 28, 2016
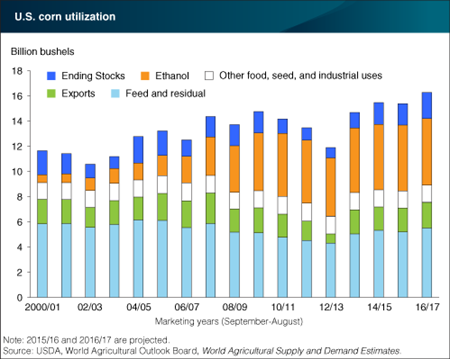
U.S. corn area in 2016/17 is estimated at 94.1 million acres, of which 86.6 million is expected to be harvested for grain, up 5.9 million from last year. With a national average yield forecast of 168 bushels, corn production this year would reach 14.5 billion bushels, 939 million bushels above last year’s harvest and 324 million more than was harvested from the record-large 2014/15 crop. The larger supply is expected to have a dampening effect on prices, making U.S. corn more competitive in the global market and boosting exports to 2.1 billion bushels in 2016/17, up from 1.9 million from the 2015/16 crop and the highest since 2007/08 when they reached 2.4 billion. Use for ethanol as well as other food, seed and industrial uses is expected to increase only modestly (less than 1 percent) to 6.7 million bushels, reflecting the maturity of those markets. Feed and residual use (a category that mainly includes livestock feed as well as other uses unaccounted for) is expected to consume 5.5 billion bushels, up 300 million from the 2015/16 crop. With projected supply expected to exceed total use of the 2016/17 crop, ending stocks are forecast to grow to 2.1 billion bushels, up from the 1.7 billion bushels expected to be on hand at the end of the 2015/16 crop year. This chart is from the ERS report Feed Outlook, July 2016.
Tuesday, July 26, 2016
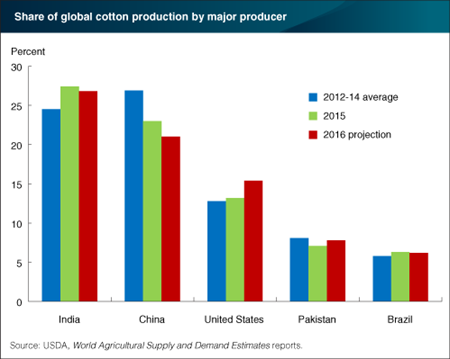
The 2016 U.S. cotton crop is expected to reach 15.8 million bales (1 bale = 480 pounds), 23 percent larger than the 2015 crop, reflecting a 17-percent increase in acreage, lower abandonment and higher yields compared to last year. Globally, cotton production is projected to reach 102.5 million bales in 2016, up 5 percent from last year. Global cotton production is concentrated among a small number of countries, with India and China accounting for nearly half of world production and the top five producers expected to supply 77 percent of the world’s cotton this year. Production in most countries is expected to increase at least modestly this year, with the exception of China, where production is expected to fall 4.5 percent to 21.4 million bales as acreage there falls to historically low levels. Given the large increase in U.S. production, the U.S. share of global supply is expected to increase from 13.2 percent in 2015 to 15.4 percent in 2016, compared to a 27-percent share supplied by India and 21 percent by China. This chart is from the ERS report Cotton and Wool Outlook report, July 2016.
Tuesday, July 19, 2016
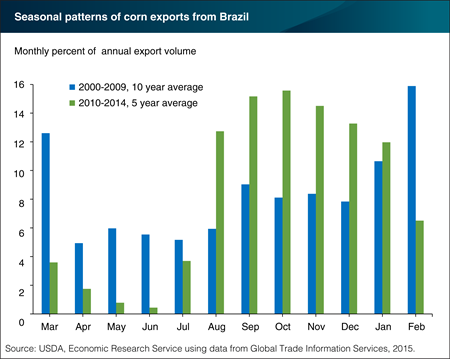
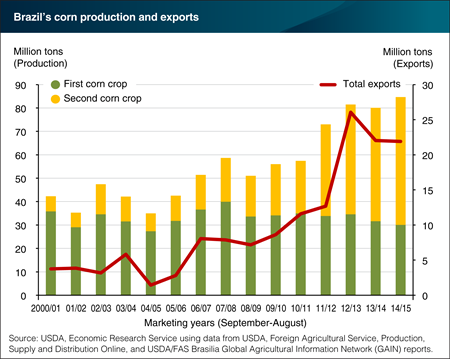
Corn is Brazil’s second largest crop (after soybeans), accounting for 20 percent of planted area, and Brazil is the world’s second largest corn exporter, behind the United States. Due to a favorable climate and long growing season, double-cropping is possible in much of the country, and the majority of corn in Brazil is harvested as a second crop planted after soybeans. Brazil tends to use most of its first-crop corn (harvested primarily during February-April) domestically because it is grown near the poultry and pork enterprises in the South, and the transportation system is focused on moving soybeans into global markets. But second-crop corn is harvested during June-August just as Brazil’s peak soybean export period ends, freeing up port capacity and transportation resources to move corn into export markets. Second-crop corn production in Brazil has expanded rapidly over the past 5 years, and over the same period the seasonal pattern of Brazil’s corn exports has shifted such that a much larger portion now enters export markets from August to January, months when harvesting begins and supplies peak in the United States. This chart is from the ERS report, Brazil’s Corn Industry and the Effect on the Seasonal Pattern of U.S. Corn Exports, released June 15, 2016.
Thursday, July 14, 2016
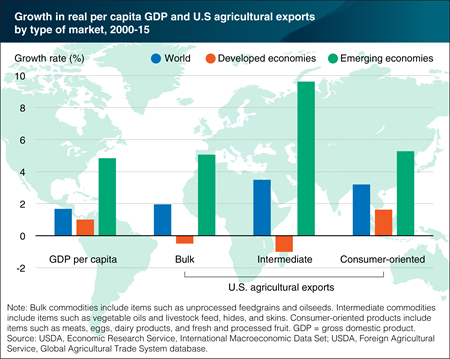
Growth in demand for food, and by extension for agricultural imports, is particularly sensitive to growth in per capita incomes in developing countries, where relatively large shares of rising incomes are typically spent on increasing both the amount and diversity of foods consumed. In contrast, consumers in more developed countries, where per capita incomes and food intake are already relatively high, are less likely to spend as much of new income on increasing the amount of food they eat. Emerging markets averaged higher rates of real per capita gross domestic product growth and accounted for all of the volume growth in U.S. exports of bulk and intermediate agricultural products and most of the growth in U.S. exports of consumer-oriented products during 2000-15. The volume of U.S. exports of bulk and intermediate agricultural goods to developed countries actually declined during the period, and U.S. exports of consumer-oriented goods to developed markets grew only about a third as fast as to emerging markets. This chart is from the ERS report, Global Macroeconomic Developments Drive Downturn in U.S. Agricultural Exports, released July 12.
Thursday, July 7, 2016
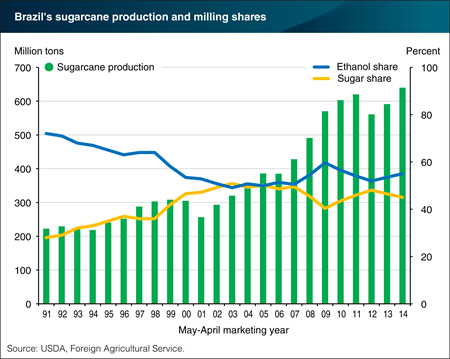
The Government of Brazil has supported the production of ethanol as an automotive fuel for many years, beginning in 1975 with the Proálcool program, to encourage production of ethanol from sugarcane and including many programs that remain in effect today—including mandatory ethanol-blending requirements in gasoline and tax exemptions for ethanol-powered cars. Sugarcane is nearly the exclusive ethanol feedstock in Brazil, and Brazil is the world’s largest sugarcane producer, accounting for 39 percent of world production. Until the mid-1990s, the share of sugar production turned into ethanol was set by government policy, but since then market forces have determined the share that is converted to ethanol. In particular, the relationship among the prices of sugar, gasoline, and ethanol, as well as storage capacity at sugar mills, all play a role. Production of both sugar and ethanol in Brazil has expanded rapidly since the mid-1990s. Sugarcane production reached 640 million tons in 2014, up 188 percent since 1991, while over the same time, the share used for ethanol production declined from 72 percent in 1991 to a low of just over 49 percent in 2003 and a 2014 level of 55 percent. This chart is from the ERS report, Brazil’s Agricultural Land Use and Trade: Effects of Changes in Oil Prices and Ethanol Demand, released June 29, 2016.
Friday, June 24, 2016
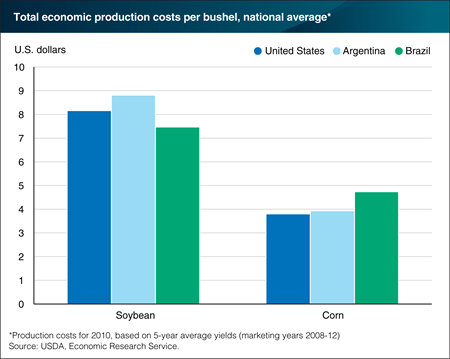
The cost of producing agricultural commodities varies across countries and regions due to many factors, including the quality of resources, climatic conditions, and the cost and availability of necessary inputs. Differences in cost of production help to determine a country’s export competitiveness in global markets, with low-cost producers usually capturing a larger share of global exports. Corn and soybeans are among the most important agricultural commodities traded in global markets, and the United States, Brazil and Argentina are the leading exporters, accounting for a combined 88 percent of world soybean exports and 73 percent of world corn exports between 2008 and 2012. Based on data for 2010 and 5-year average yields, the cost of producing soybeans in Argentina average $8.81 per bushel, compared to $7.47 in Brazil and just over $8.00 in the United States. For corn, Brazil had the highest cost of production at $4.74 per bushel, compared to $3.93 for Argentina and $3.80 in the United States. This chart is from the ERS report, Corn and Soybean Production Costs and Export Competitiveness in Argentina, Brazil and the United States, released on June 22, 2016.
Tuesday, June 21, 2016
Since 2000/01, corn production in Brazil has doubled, reaching a record 85 million metric tons in 2014/15, equivalent to 8.4 percent of global corn production. Corn is now Brazil’s second largest crop (after soybeans), accounting for 20 percent of planted area, and Brazil is the world’s second largest corn exporter, behind the United States. Due to a favorable climate and long growing season, double-cropping is possible in much of the country, and the majority of corn in Brazil is harvested as a second crop planted after soybeans. Technological advances in soil management and improvements in hybrid corn varieties have supported this expansion. The second-crop corn harvest largely serves the export market, putting it in direct competition with the timing of the U.S. corn harvest. This chart is from the ERS report, Brazil’s Corn Industry and the Effect on the Seasonal Pattern of U.S. Corn Exports, released on June 15, 2016.
Tuesday, June 14, 2016
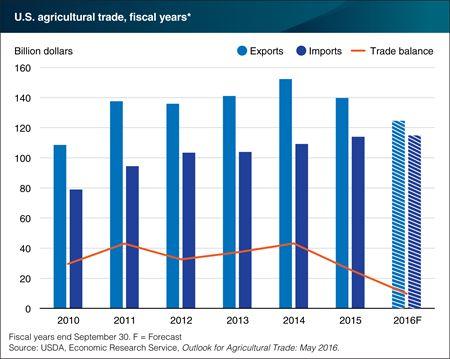
The value of U.S. agricultural exports is forecast at $124.5 billion for fiscal year (FY) 2016 (ending September 30), down $15.2 billion from FY 2015 and the second consecutive decline since a record $152.3 billion in agricultural exports was achieved in FY 2014. The declining export values over the past few years reflect a combination of lower commodity prices, a relatively weak global economy, and a strong U.S. dollar—which makes U.S. products more expensive in foreign currency terms. The value of imports, on the other hand, continues to grow and is forecast to reach a record $114.8 billion this year, up $800 million from FY 2015. With lower exports and higher imports, the FY 2016 agricultural trade balance is forecast to fall to $9.7 billion, down $16.0 billion from last year and the lowest since FY 2006. This chart is from the ERS report Outlook for U.S. Agricultural Trade: May 2016.
Wednesday, June 1, 2016
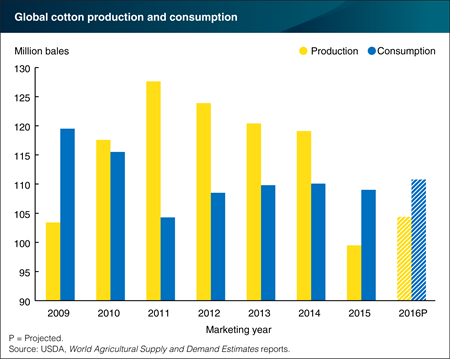
World cotton consumption is expected to grow modestly during the 2016/17 marketing year (August-July), reaching 110.8 million bales. That is similar to 2014/15 levels after dipping slightly in 2015/16. Modest growth in the global economy and relatively low cotton prices are expected to support mill use in most countries. China, India, and Pakistan are expected to lead world cotton mill use and account for a combined 62 percent of the total, similar to 2015/16. Global cotton production is forecast at 104.4 million bales in 2016/17, a modest increase following the 16-percent reduction in production in 2015/16—the result of inclement weather and pest damage in a number of producing countries. While cotton area is expected to decline, a rebound in yields would support the increase in production. With global cotton consumption forecast to exceed production for a second consecutive season, 2016/17 world ending stocks are projected to decline 6 percent from 2015/16, but at more than 96 million bales, ending stocks remain historically high and will continue to weigh on prices and production. This chart is from the May 2016 Cotton and Wool Outlook report.
Thursday, May 5, 2016
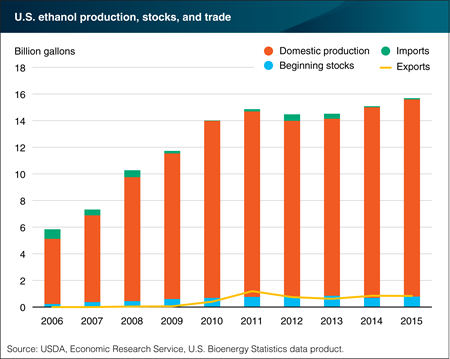
U.S. production of ethanol hit a record 14.8 billion gallons in 2015, and when combined with the carry-over stocks from the previous year and 2015 imports, the total ethanol supply reached an all-time high of 15.7 billion gallons. Nearly all ethanol blended into the U.S. gasoline supply is produced domestically, and, over the past five years, about 94 percent of domestic production was used in the United States. Ethanol imports peaked in 2006 at 731 million gallons (equal to 12 percent of the U.S. supply), but each year since 2010 exports have exceeded imports, making the United States a net exporter of ethanol. The domestic market for ethanol is at full capacity due to the technical and regulatory constraints that limit most of the U.S. gasoline supply to a 10 percent maximum ethanol blend, so the export market is now the primary opportunity for growth. Ethanol exports peaked in 2011 at nearly 1.2 billion gallons, but have remained below 850 million gallons for the past four years. This chart is based on the ERS U.S. Bioenergy Statistics data product.
Friday, April 29, 2016
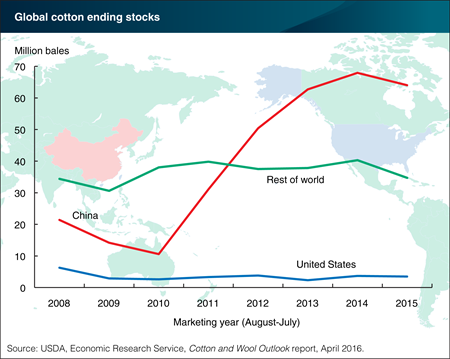
Global ending stocks of cotton are forecast to decline in the 2015/16 marketing year (August-July), down about 9 percent from last year’s record of nearly 112 million bales. Cotton stocks rose dramatically between 2010/11 and 2014/15 as relatively high prices encouraged world production and discouraged consumption. Despite this season’s anticipated decrease, ending stocks remain double the 2010/11 level. The recent global stocks buildup resulted from policies in China that insulated Chinese cotton producers from declining world prices and, at the same time, also encouraged imports. More recent policy shifts in China have discouraged production and imports in that country, beginning the process of reducing the surplus of Government-held stocks. In 2015/16, China’s stocks are expected to decrease for the first time since 2010/11. However, with stock reductions also expected in the rest of the world, China’s share of global stocks remains above 60 percent. This chart is from the April 2016 Cotton and Wool Outlook report.
Tuesday, March 29, 2016
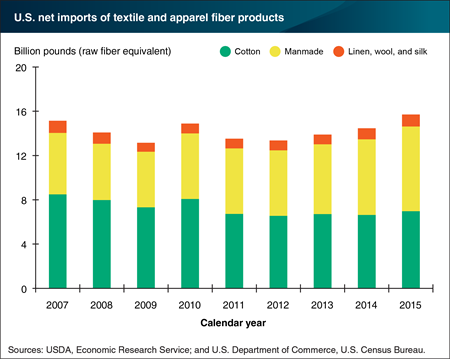
U.S. net imports of textile and apparel fiber products increased for a third consecutive calendar year in 2015 to the highest on record, reaching 15.7 billion pounds (raw fiber equivalent), compared with 14.5 billion pounds in 2014. U.S. net imports consist mostly of cotton and manmade fiber products, as demand for linen, wool, and silk products remains relatively small. With manmade fiber imports expanding steadily in recent years, cotton’s share has declined consistently. In 2015, cotton textile and apparel products accounted for 44 percent of the total imports, while manmade fibers contributed nearly 49 percent. By comparison, in 2007, cotton accounted for 56 percent of all textile and apparel imports, while the share of manmade fibers was 37 percent. This chart is from the Cotton and Wool Outlook, March 2016.
Wednesday, March 16, 2016
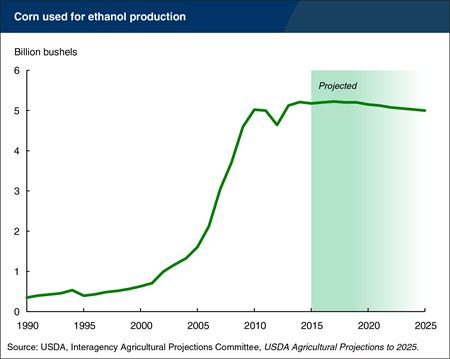
Ethanol production in the United States is based almost entirely on corn as a feedstock. Corn‑based ethanol production is projected to fall over the next 10 years. This reflects declining overall gasoline consumption in the United States (which is mostly a 10‑percent ethanol blend, E10), infrastructural and other constraints on growth for E15 (15‑percent ethanol blend), and the small size of the market for E85 (85‑percent ethanol blend), with less-than-offsetting increases in U.S. ethanol exports. Even with the U.S. ethanol production decline, demand for corn to produce ethanol continues to be strong. While the share of U.S. corn expected to go to U.S. ethanol production falls, it accounts for over a third of total U.S. corn use throughout the projection period. This chart is based on information in USDA Agricultural Projections to 2025.
Wednesday, March 9, 2016
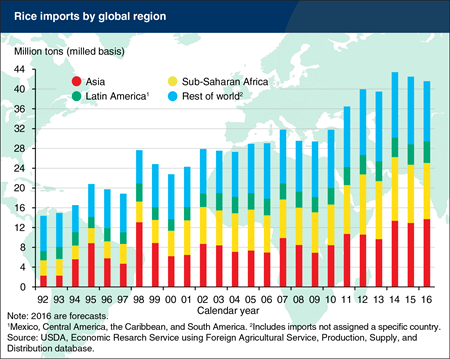
Global trade in rice is expected to decline for the second consecutive year in 2016, reflecting reduced exports from India, Australia, Cambodia, and the United States, and softening demand, particularly in Sub-Saharan Africa. Reduced imports by Nigeria—the world’s second-largest rice import market—account for the largest share of the decline in global rice trade. Imports by Nigeria are expected to fall 17 percent in 2016, the result of a recent increase in import tariffs, declining oil revenues, and foreign exchange restrictions. Cote d’Ivoire, Cuba, the European Union, Nepal, and Sri Lanka are also expected to reduce rice imports this year. The decline in global trade comes despite further growth in demand by China, the world’s largest rice importing country, as well as expanded imports by the Middle East and Indonesia. Rice imports by China have been at record high levels since 2012 and are expected to grow 4 percent in 2016, reflecting prices that are lower in the global market than the domestic market, stock-building efforts by the government, and quality concerns regarding domestic rice.
Tuesday, February 16, 2016
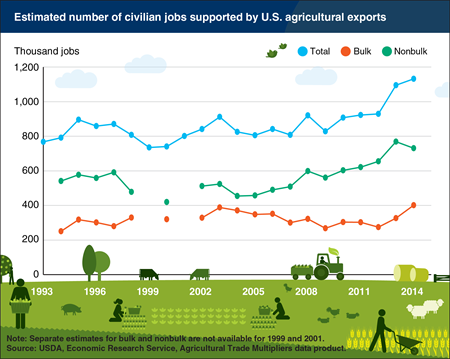
Agricultural exports support job growth in the United States, and the number of jobs depends on the type of products exported. In calendar year 2014, $150 billion in U.S. agricultural exports supported an estimated 1,132,000 full-time civilian jobs, up from the 1,095,000 agricultural export-related jobs the previous year. Products that are largely unprocessed and sold in bulk tend to generate fewer jobs than higher value, more highly processed, nonbulk agricultural products. However, when prices for bulk commodities are low and export volume is high, the number of jobs supported by each billion dollars of export value can rise. This was the case in 2014, as the number of jobs supported by exports of bulk commodities rose by 23 percent from the previous year, while jobs supported by exports of nonbulk commodities declined by nearly 5 percent. Consequently, the growth in jobs associated with U.S. agricultural exports was driven purely by bulk commodities in 2014. Nevertheless, nonbulk commodities still account for the majority of U.S. agricultural exports, and continue to support the majority of jobs generated by agricultural exports. This chart is based on the Agricultural Trade Multipliers data product.
Friday, February 12, 2016
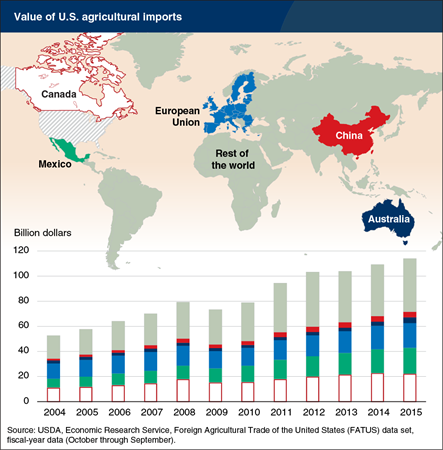
The value of U.S. agricultural imports has more than doubled since 2004, exceeding $114 billion in fiscal year 2015 and up 4 percent from the previous year. Canada and Mexico are the two largest sources of U.S. agricultural imports and account for about one-third of the total value, while the combined value of imports from the countries that comprise the European Union roughly equal the value of imports from Canada. Together, Canada, Mexico, and the European Union account for just over half of the value of agricultural products that the United States imports, and this share has held relatively constant over the past decade although the import shares for Canada and the EU have declined, while Mexico’s has grown. The $4.3 billion in agricultural imports from China in 2015 still accounts for less than 4 percent of the U.S. total, but has grown by nearly 170 percent since 2004. This data in this chart is from the ERS Foreign Agricultural Trade of the United States data set.


