ERS Charts of Note
Subscribe to get highlights from our current and past research, Monday through Friday, or see our privacy policy.
Get the latest charts via email, or on our mobile app for  and
and 
Tuesday, April 28, 2015
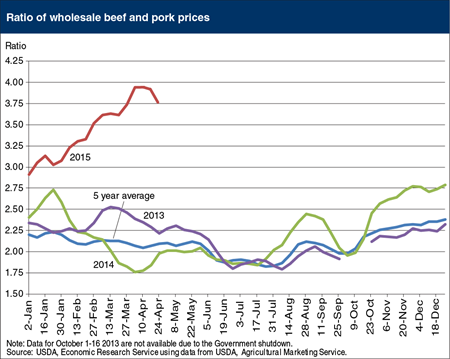
The spread, or difference, between the Choice beef cutout and pork carcass value can indicate the relative demand for red meat proteins at the wholesale level. Likewise, the spread between wholesale Choice beef and pork cutout values—the value of a carcass based on the wholesale prices for the various cuts of meat and other items contained in the carcass—is important to the retail sector. The rapid rise in beef prices and significant decline in pork prices since the beginning of 2015 has widened the spread between the two competing meats to $190/cwt (as of April 24). The choice beef-to-pork ratio sits at 3.77, implying that wholesale beef is being priced nearly four times higher than pork. Most retailers are sensitive to price changes at the wholesale level and choose to feature meat items that provide a good value to consumers while ensuring profitable margins. At current prices, consumers are likely to favor more pork in their diet and less beef. Retail beef prices are expected to remain high throughout the calendar year due to constrained beef production. This chart appears in the cattle and beef section of the April 2015 Livestock, Dairy and Poultry Outlook, LDPM-250.
Friday, April 24, 2015
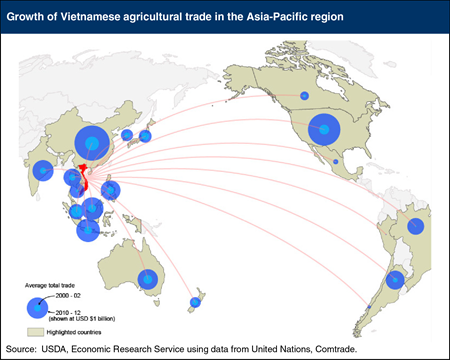
After Vietnam joined the Association of Southeast Asian Nations (ASEAN), its agricultural trade within the 10-member regional trade bloc expanded. The normalization of trade with the United States in 2001 and WTO accession in 2007 also provided catalysts for growth and integration. Subsequent preferential trade agreements (PTAs) have led to tariff reductions that have only recently begun to take effect. Today, Vietnam’s agricultural trade is still led by trade with its ASEAN partners; however, China has become a major export market and Vietnam’s largest trade partner, while the United States is a close second, and also the largest source of imports. Trade growth with both partners has been significant, growing 7- and 10-fold, respectively, while imports from South America have also grown. The Trans-Pacific Partnership (TPP) agreement, now under negotiation, is viewed as important to Vietnam’s long-term economic strategy as it could potentially secure markets abroad and facilitate the flow of foreign investment. Vietnam seeks greater access for its textile and footwear industry, while exporting countries, including the United States, see Vietnam as a market with growth potential. This report is from the Amber Waves article, “Japan, Vietnam, and the Asian Model of Agricultural Development and Trade.”
Friday, April 17, 2015
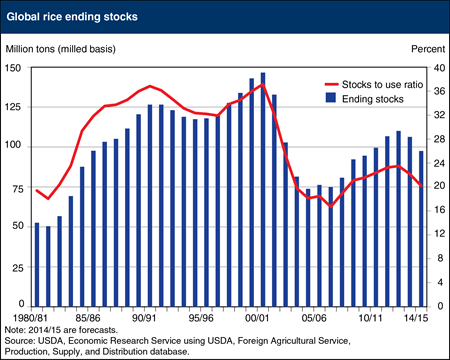
Global ending stocks of most agricultural commodities, including feedgrains, oilseeds, wheat, and cotton are expected to reach multi-year highs in 2015. Ample supplies are reflected in prices that are well below the record levels of just a few years ago. Rice is an exception, with global ending stocks projected to decline for the second year in a row to reach their lowest level since the 2009/10 marketing year (August/July). At the same time, global use continues to grow, led by consumption growth in China, India, Bangladesh, the Philippines, and several other nations. As a result, the global stocks-to-use ratio is projected at just over 20 percent, the lowest it has been since 2007/08, a time when international concern over high commodity and food prices led several of the world’s leading rice producing and consuming countries to restrict exports and increase government-owned rice reserves. These actions resulted in a rapid rise in global rice prices and reduced trade. Today, even though global stocks are approaching levels that prompted substantial trade restrictions in early 2008, prices are lower and global rice trade remains at near-record levels. This chart is from the April 2015 Rice Outlook.
Tuesday, April 14, 2015
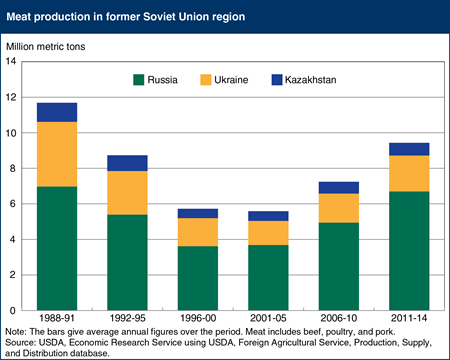
During the last decades of the USSR, the livestock sector grew substantially as the state heavily subsidized both the production and consumption of livestock goods. After the breakup of the Soviet Union, the livestock sectors of Russia, Ukraine, and other countries of the former USSR contracted. By the end of the 1990s, both animal inventories and meat production were half (or even less) than at the start of the decade, as these countries’ governments could no longer afford the large subsidies provided to the sector during the Soviet period. Beginning in 2000, the livestock sector in Russia, Ukraine, and Kazakhstan began to rebound, though output has not yet reached pre-reform levels. As gross domestic product (GDP) began to rise the governments in these countries had the financial resources to restore some of the subsidies to the sector. Russia also protected the sector with a system of tariff rate quotas on meat imports imposed in 2003. In addition, large modern livestock producers are increasing the efficiency and productivity of operations. The poultry and pork industries have grown, but the beef industry has yet to experience a turnaround. This chart is from the report, Rising Grain Exports by the Former Soviet Union Region: Causes and Outlook.
Monday, March 30, 2015
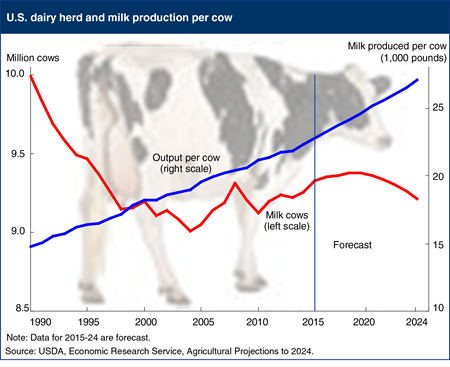
U.S. milk cow numbers are projected to rise through 2018 as high milk prices and lower feed costs provide favorable returns to producers. Lower returns due in part to higher feed costs are expected to lead to year-to-year declines in cow numbers from 2020-24. At the same time, U.S. milk output per cow is projected to increase through the projection period, reflecting continued technological and genetic developments. Domestic commercial use of dairy products is expected to increase faster than the growth in U.S. population over the next decade. The demand for cheese is expected to rise due to greater consumption of prepared foods and increased away‑from-home eating, while the long-term decline in per capita consumption of fluid milk products is likely to continue. The United States is expected to expand exports of dairy products; commercial U.S. dairy exports are projected to increase steadily over the next decade, reaching record levels on both a fat and a skim-solids basis. Production increases in other major dairy exporting countries are expected to lag growth in global import demand, supporting a favorable outlook for U.S. dairy exports. This chart is based on the report, USDA Agricultural Projections to 2024.
Monday, March 23, 2015
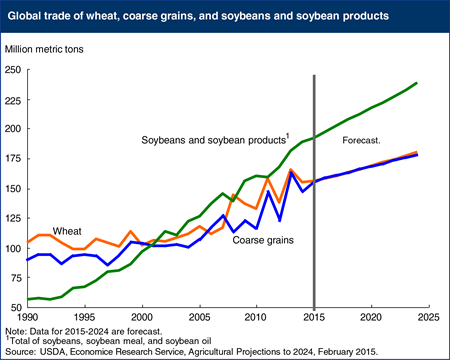
Global trade in soybeans and soybean products has risen rapidly since the early 1990s, surpassing global trade in both wheat and total coarse grains (corn, barley, sorghum, rye, oats, millet, and mixed grains). Continued growth in global demand for vegetable oil and protein meal, particularly in China and other Asian countries, is expected to keep soybean and soybean products trade above either wheat or coarse grain trade throughout the next decade. Increasing demand for grains, oilseeds, and other crops provides incentives to expand global area under cultivation and cropping intensity, although lower projected prices could constrain expansion. Globally, the total area planted to grains, annual oilseeds, and cotton is projected to expand at an average annual rate of 0.5 percent from 2015 to 2024, from 934 to 982 million hectares. Population growth is a significant factor driving overall growth in demand for agricultural products. Rising per capita income in most countries is also contributing to the demand for vegetable oils, meats, horticulture, dairy products, and grains. This chart is based on the report, USDA Agricultural Projections to 2024.
Friday, March 20, 2015
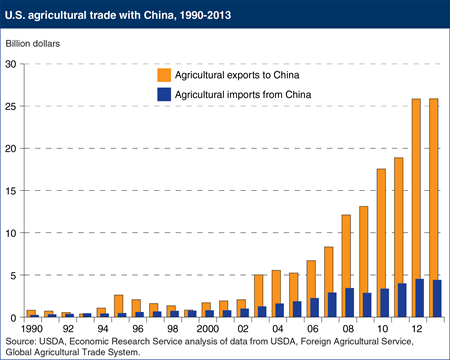
In recent years, growth in U.S.-China agricultural trade has accelerated. During calendar years 2012-13, U.S. exports of agricultural products to China averaged $25.9 billion per year—a tenfold increase from the late 1990s. Sales to China doubled during 2004-08 and doubled again during 2008-12, while the share of U.S. agricultural exports going to China rose from about 3 percent during the 1990s to 18 percent during 2012-13. China became the largest overseas market for U.S. farm products in 2010. U.S. imports of agricultural products from China rose at a slower pace, reaching $4.4 billion in 2013—agriculture is one of the few sectors where the United States has a trade surplus with China. During 2012-13, the United States accounted for over 24 percent of China’s agricultural imports by value and was its leading supplier of oilseeds, cotton, meat, cereal grains, cattle hides, distillers’ dried grains (mainly used for animal feed), and hay. Soybeans account for more than half of the total value of U.S. agricultural exports to China, averaging $14.1 billion during the 2012-13 calendar years, and are also the largest U.S. export of any type to China, accounting for about 11 percent of the value of total U.S. exports to China. This chart is based on the ERS report, China’s Growing Demand for Agricultural Imports.
Thursday, March 12, 2015
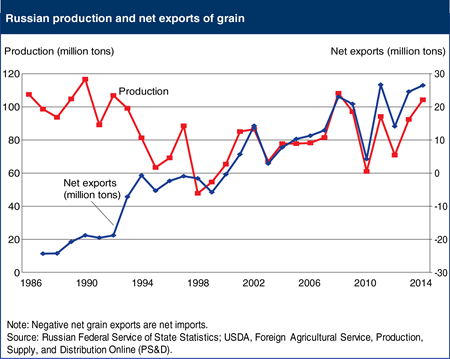
During the final decades of the Soviet Union, Russia (along with the USSR in general) was a large importer of grain, with net imports in some years exceeding 20 million metric tons (mmt). However, since 2000, the country has become a major grain exporter (primarily of wheat), with net exports in some years exceeding 20 mmt. Underlying this reversal is the fact that the Russian livestock sector contracted substantially—by about half—during the 1990s, reducing not only the need for grain imports, but for domestic production, as well. Then, beginning in about 2000, Russian grain production began to rise substantially, creating large surpluses for export. Despite the country’s move from large grain importer to exporter, average annual grain output over 2011-14 was still below that of 1986-90. This highlights the degree to which the Soviet Union over-invested in its high-cost and inefficient livestock sector, which required large volumes of feed from both domestic and imported grain. Russian grain output and exports continue to trend higher, but can fluctuate considerably on a year-to-year basis because of Russia’s volatile continental weather. This chart is based on the report, Rising Grain Exports by the Former Soviet Union Region, Causes and Outlook.
Thursday, March 5, 2015
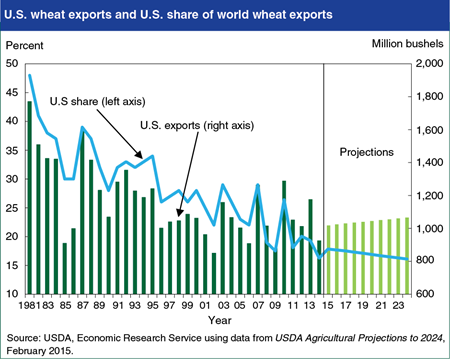
The United States is one of the world’s largest exporters of wheat—second only to the European Union and ahead of the world’s other major exporters including Canada, Australia and Russia—but its share of global wheat exports has trended lower over several decades and is expected to continue to decline over the next 10 years. While US wheat exports are expected to trend modestly higher from 2015 through 2024, exports from Russia, Ukraine and Kazakhstan could account for nearly half of the projected increase in world wheat trade, notwithstanding the weather-related production fluctuations that are common in this region. Growth in wheat imports is concentrated in developing countries where income and population gains drive increases in demand, including regions of West Africa, sub-Saharan Africa, Egypt and other parts of North Africa and the Middle East, Indonesia and Pakistan. In many of these markets, Black Sea and EU exporters maintain a cost advantage over the United States reflecting transportation distance, as well as the fact that U.S. wheat exports are almost exclusively for high-value food markets while much of the wheat imported by developing countries is for lower value uses including livestock feed. Nevertheless, the United States will remain one of the world’s leading suppliers of high-quality wheat, with exports projected to rise slowly during the coming decade, even as its share of global exports falls from 17.8 percent in 2015/16 to 16.1 percent in 2024/25. This chart is based on the report, USDA Agricultural Projections to 2024.
Wednesday, March 4, 2015
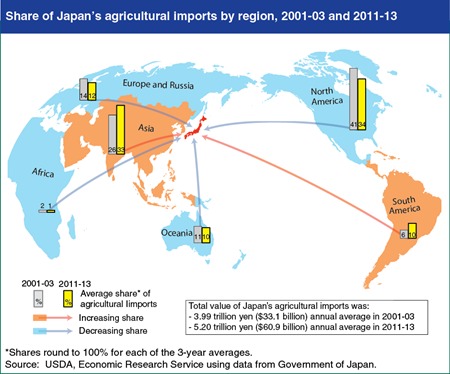
Japan is one of the largest markets for U.S. agricultural exports, and the United States has long been its largest supplier. However, in recent years the total value of U.S. agricultural exports to Japan has stagnated (in real terms) and the U.S. share of Japan’s agricultural imports has declined. U.S. exports to Japan of some major products—such as soybeans and fruits/preparations—are down since 2000, and others, such as wheat and corn, have remained flat. Japanese imports of U.S. pork are an exception, with strong growth over the last 15 years. The decline in the U.S. share of Japan’s agricultural imports reflects greater competition from competing suppliers, especially in South America and Asia. Japan has expanded its imports of soybeans, soy meal, poultry meat, and grains from South America; palm oil, rubber, and poultry meat from Southeast Asia; soy meal from South Asia; and alcoholic beverages and processed foods from nearby South Korea. Nevertheless, the United States remains Japan’s largest supplier of agricultural products despite trade policies there that maintain a high level of protection for domestically produced products such as wheat and rice and many consumer-ready foods. This chart is from “Japan, Vietnam, and the Asian Model of Agricultural Development and Trade,” in Amber Waves, February 2015.
Tuesday, February 24, 2015
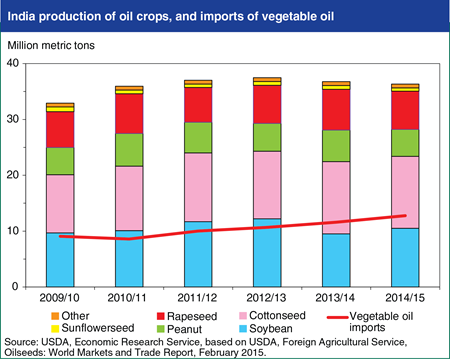
Production incentives for Indian oilseeds are being eroded by declining prices for imported vegetable oils, which are down to a six-year low. Indian rapeseed area fell 7 percent in 2014/15 to 6.6 million hectares. Peanut production is down 4.6 million hectares (15 percent) from 2013/14, continuing a shift by Indian farmers to competing crops such as cotton. Similarly, sunflowerseed area is down 13 percent in 2014/15. Cottonseed production is estimated to be nearly flat in 2014/15 and soybean production increased about 10 percent, reflecting an improved yield. Total oilseed production will be down about a half million metric tons from the previous year and 1.2 million metric tons from 2012/13. To make up for lower domestic production, India’s imports of vegetable oil are forecast to be up more than 10 percent in 2014/15, the fourth consecutive year of growth. This trend has turned India into the world’s top importing country for vegetable oil, and a major factor in determining global prices. This chart is based on the February 2015 Oil Crops Outlook Report.
Monday, February 23, 2015
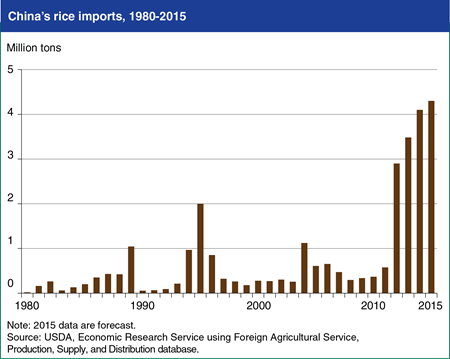
Rice imports by China are expected to set a new record in 2015, surpassing 2014 levels by 200,000 metric tons and marking the fourth consecutive year of record imports. Rice imports surged in 2012 to more than 7 times the average of the previous 5 years, and continued to grow each year thereafter. China remains the world’s largest rice producer and consumer, and has been largely self-sufficient in rice for more than 30 years and until recently, was typically a net rice exporter. In 2012, China surpassed Nigeria to become the world’s largest rice importer. Vietnam and Burma are the largest suppliers of rice to China, along with Pakistan and Thailand. The United States is currently unable to ship rice to China due to ongoing disagreements over phytosanitary issues. China’s record imports are not due to a short crop or tight supplies, but are the result of much lower prices for imported rice than for domestic rice, and continued growth in use partly due to an increasing population. As the world’s largest rice consumer, even small dietary shifts can have a large effect on the supplies needed to meet consumer demand, and China is increasingly turning to the world market to feed its appetite not only for staple commodities such as rice, but also fruits, vegetables, meat and other consumer-oriented products. This chart is based on the February 2015 Rice Outlook report.
Thursday, February 19, 2015
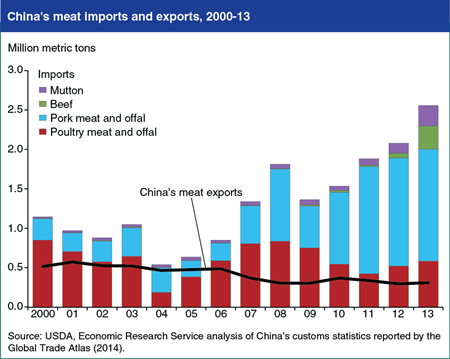
As China enters a new phase of its economic development, its demand for higher-valued products like meat and dairy products is growing rapidly. China’s imports of meats during 2013-14 were more than double the volume imported during the early 2000s. Growing demand and higher prices of domestic meat products have driven the growth in China’s meat imports over the past few years. China’s meat imports have shifted from items like chicken feet and animal offal to muscle meat, as living standards rose and China opened its market to more beef and mutton imports. The U.S. is currently the top supplier of China’s poultry and pork imports. U.S. exports of meat, dairy products, and other consumer-oriented products, such as fruits, nuts, and wine to China rose from $234 million in 2000 to $3 billion in 2013, comprising nearly 12 percent of the value of total U.S. agricultural exports to China that year. The growth in China’s meat imports could mean new opportunities for U.S. exporters. This chart is based on the ERS report, China’s Growing Demand for Agricultural Imports.
Tuesday, November 27, 2012
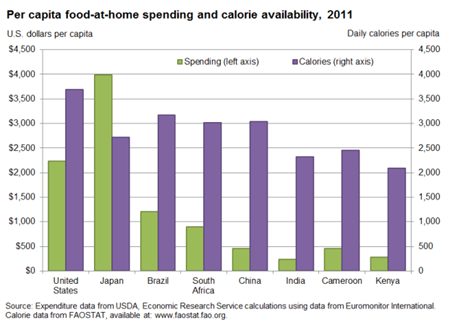
Per capita food-at-home spending differs widely across countries. For example, in 2011 food-at-home spending was $2,239 per person in the United States, $452 in lower middle-income Cameroon, and just $276 in low-income Kenya. However, higher food spending does not always translate into higher food consumption. South African consumers, for example, spent more per person on at-home foods than Chinese consumers, but per person calories available for consumption were about the same in both countries. Japanese consumers outspent U.S. consumers on at-home foods, but per person calorie availability in Japan was lower. At-home food spending reflects general food price levels, prices for the particular foods purchased (grains versus meats), and, for higher income countries, the mix of at-home and away-from-home eating. While the average consumer in the United States spends more than 8 times as much on food at home as the average person in Kenya, per capita calorie availability is less than 80 percent higher. All eight countries had per capita calorie availability over 2,000 per day, but averages can mask large differences in food spending, access, and consumption within a country. This chart is based on data from the ERS Food Expenditures data product, updated October 2012.
Tuesday, November 20, 2012
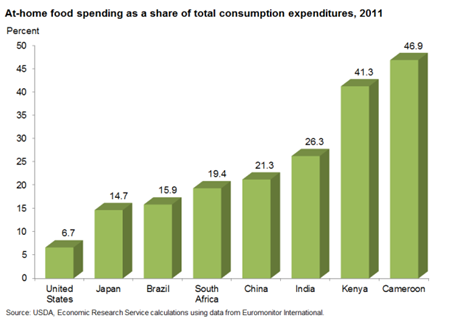
At-home food spending as a share of consumption expenditures varies between countries, with higher income countries spending a relatively small share and lower income countries spending a larger share. The United States has the lowest at-home food spending share and Cameroon one of the highest. Consumption expenditures include personal spending on goods and services in the domestic market. As incomes rise, food spending typically increases in absolute terms, but declines as a share of total consumption expenditures. Between 2008 and 2011, food spending as a share of consumption expenditures remained relatively flat in both the United States and Japan. Food spending's share in the other six countries fell during this time, especially in India which saw large increases in income and total consumption expenditures. This chart is based on data from the ERS Food Expenditure Series data product, updated October 2012.
Wednesday, November 7, 2012
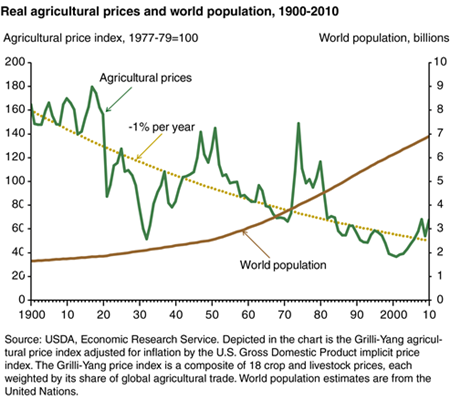
Improving agricultural productivity has been the world's primary safeguard against the needs of a growing population outstripping the ability of man and resources to supply food. Over the past 50 years, global gross agricultural output has more than tripled in volume, and productivity growth in agriculture has enabled food to become more abundant and cheaper. In inflation-adjusted dollars, agricultural prices fell by an average of 1 percent per year between 1900 and 2010, despite an increase in the world's population from 1.7 billion to nearly 7.0 billion over the same period. Nonetheless, food prices have been rising since around 2001. This has renewed concerns about the pace of agricultural productivity growth. If productivity growth slows, then more resources--land, labor, energy, fertilizers, and other inputs--would be needed to meet rising demand, raising the cost of food. This chart appears in "New Evidence Points to Robust But Uneven Productivity Growth in Global Agriculture" in the September 2012 issue of ERS's Amber Waves magazine.


