ERS Charts of Note
Subscribe to get highlights from our current and past research, Monday through Friday, or see our privacy policy.
Get the latest charts via email, or on our mobile app for  and
and 
Thursday, July 21, 2016
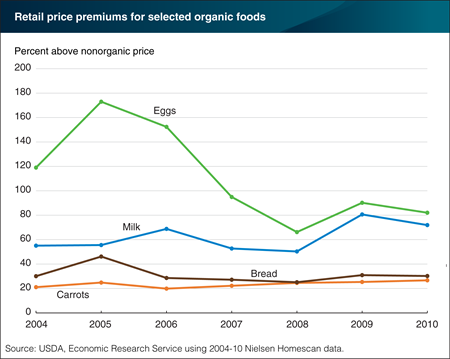
A recent ERS study estimated price premiums in grocery stores for 17 commonly purchased organic foods relative to their nonorganic counterparts from 2004 to 2010. Price premiums for most of the organic products studied did not steadily increase or decrease during the 7-year period, but fluctuated. Premiums for organic bread ranged from 25 to 45 percent above the nonorganic price, and premiums for organic milk ranged from 50 to 80 percent. The wide fluctuations in the price premium for organic eggs—66 to 173 percent—may be a result of the large retail price swings common for nonorganic eggs. Organic carrots, on the other hand, had a narrower range of premiums. Organic carrots were priced between 20 and 27 percent higher than nonorganic carrots during 2004 to 2010. This chart appears in “Investigating Retail Price Premiums for Organic Foods” in the May 2016 issue of ERS’s Amber Waves magazine.
Thursday, June 23, 2016
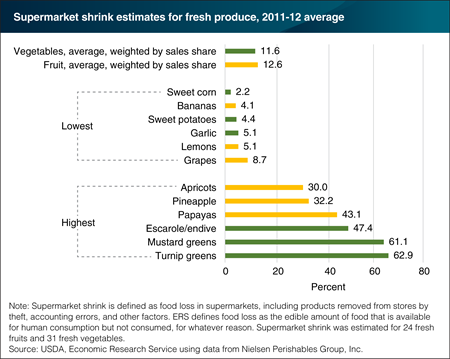
Food loss, or shrink as retailers call it, occurs when grocery retailers remove dented cans, misshaped produce items, overstocked holiday foods, and spoiled foods from their shelves. Estimates of supermarket shrink for fresh produce were developed by comparing data on pounds of shipments received with pounds purchased by consumers for 2,900 U.S. supermarkets in 2011-12. Average supermarket shrink was 12.6 percent for 24 fresh fruits and 11.6 percent for 31 fresh vegetables. For the fresh fruits, loss ranged from 4.1 percent for bananas to 43.1 percent for papayas. Pineapples and apricots had the second- and third-highest shrink rates for fresh fruits. The highest shrink in 2011-12 among the fresh vegetables was for turnip greens, followed by mustard greens, and escarole/endive. Leafy greens are more prone to moisture loss, and hence weight loss, than other types of produce. Uncertain or uneven demand for highly perishable produce items may also contribute to higher loss rates. The statistics in this chart are from the ERS report, Updated Supermarket Shrink Estimates for Fresh Foods and Their Implications for ERS Loss-Adjusted Food Availability Data, released on June 21, 2016.
Thursday, June 2, 2016
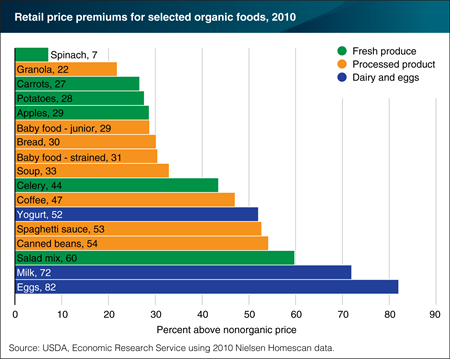
Organic foods are generally higher priced than their nonorganic counterparts. Price premiums for organic foods reflect both costs to produce and bring organic foods to consumers as well as consumers’ willingness to pay more for organic products. A recent ERS study estimated price premiums in grocery stores for 17 commonly purchased organic foods relative to their nonorganic counterparts from 2004 to 2010. Eggs and milk had the highest premiums in 2010, at 82 and 72 percent, respectively. Organic eggs and dairy products have high production costs since the chickens and cows must be fed organic feed, have access to the outside, and be free of hormones and antibiotics. Organic fresh fruits and vegetables, generally recognized as the largest part of the organic market, had the widest spread of premiums in 2010—ranging from 7 percent for spinach to 60 percent for salad mix. Price premiums for organic processed foods ranged from 22 percent for granola to 54 percent for canned beans. This chart appears in the ERS report, Changes in Retail Organic Price Premiums from 2004 to 2010, released on May 24, 2016.
Wednesday, April 27, 2016
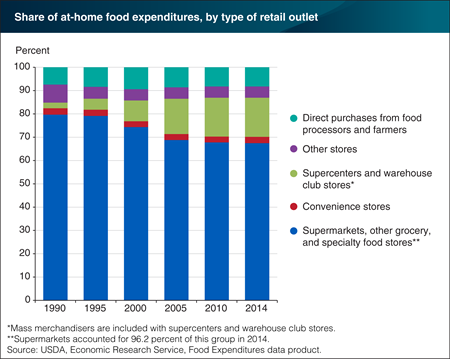
Americans spent $1.46 trillion on food in 2014. Of this total, 49.9 percent was spent in supermarkets, supercenters, farmers’ markets, convenience stores, and other retailers. The relative importance of the various outlets comprising the U.S. at-home-food market has shifted somewhat during the last 25 years. Supermarkets had a 64.9-percent share of at-home spending in 2014, down from a peak of 76.3 percent in 1993. In 1990, food expenditures in convenience stores were higher than those for warehouse club stores and supercenters. By 1993, the reverse was true; and by 2014, warehouse club stores and supercenters accounted for 16.8 percent of at-home spending. The combined share of direct purchases from food processors and farmers grew from 7.4 percent in 1990 to 9.4 percent in 2000, and their share has averaged 8.4 percent over the last decade. Other stores—for example, discount dollar stores and drug stores—accounted for 4.9 percent of the at-home-food market in 2014. This chart appears in “After a Sharp Rise Between 1990 and 2005, Supercenters’ Share of At-Home-Food Spending Has Leveled Off” in the April 2016 issue of ERS’s Amber Waves magazine.
Thursday, April 21, 2016
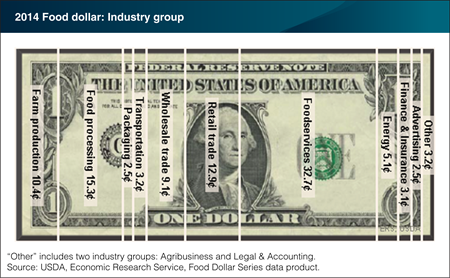
In 2014, total food-away-from-home expenditures of U.S. consumers, businesses, and government entities surpassed at-home food sales for the first time. This outcome is reflected in the 32.7-cent foodservices share of the U.S. food dollar claimed by restaurants and other eating-out places—its highest level during 1993 to 2014. It is also reflected in the 12.9-cent retail-trade share claimed by grocery stores and other food retailers, which is at its lowest level since 2002. ERS uses input-output analysis to calculate the value added, or cost contributions, from 12 industry groups in the food supply chain. Annual shifts in food dollar shares between industry groups occur for a variety of reasons, ranging from the mix of foods that consumers purchase to relative input costs. A growing share of the food dollar has gone to farm producers, up 1.7 cents since 2009 to 10.4 cents in 2014, while food processing’s share is down 2.1 cents since 2009. This chart is available for years 1993 to 2014 and can be found in ERS’s Food Dollar Series data product, updated on March 30, 2016.
Thursday, March 19, 2015
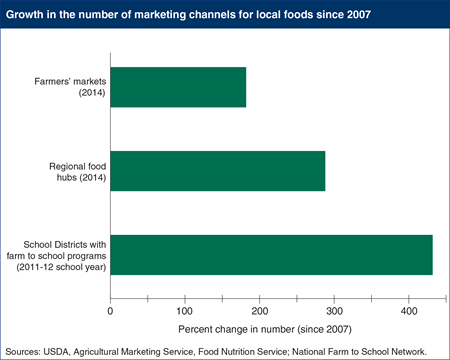
Local foods is one of the fastest growing segments of U.S. agriculture, and the number of local food marketing outlets is increasing. Growing demand for local foods in the United States is, at least in part, the result of consumer interest in environmental and community concerns, including supporting local farmers/economies and increasing access to healthful foods. American farmers and consumers are increasingly finding more opportunities to sell and buy food locally. As of 2014, there were 8,268 farmers’ markets in the United States, up 180 percent since 2007, despite no growth in real farmer-to-consumer (direct) sales between 2007 and 2012. Local food sales may be increasingly indirect, that is through intermediaries rather than farmer-to-consumer. The number of regional food hubs, (enterprises that aggregate locally sourced food to meet wholesale, retail, institutional and even individual demand) has increased almost threefold since 2007, to a total of 302 in 2014. Farm to school programs have multiple objectives, ranging from nutrition education to serving locally-sourced food in school meals. According to the USDA Farm to School Census, 4,322 school districts have farm to school programs, a 430-percent increase since 2007. This chart is found in the ERS report, Trends in U.S. Local and Regional Food Systems: A Report to Congress, AP-068, January 2015.
Wednesday, November 5, 2014
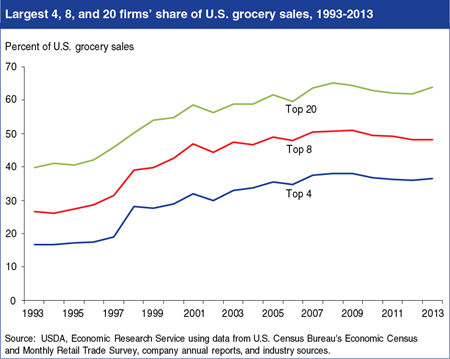
Sales of food and nonfood grocery products by the 20 largest U.S. grocery retailers accounted for 63.8 percent of the $703.9 billion in total 2013 U.S. grocery sales. 2013 marked the first increase in sales share for the top 20 grocery retailers since 2008, when their share stood at 65.1 percent. The 4 largest grocery retailers—Wal-Mart Supercenters, Kroger, Safeway, and Publix Super Markets—accounted for 36.4 percent of total grocery sales in 2013, a 1.7-percentage point drop since 2008. Wal-Mart Supercenters maintained their number one spot, with grocery sales that were 53 percent higher than second-place Kroger. Kroger’s 2013 acquisition of Harris Teeter and the pending 2014 sale of Safeway to Albertson’s—along with the continued sales growth of supercenters such as Wal-Mart and Target—are likely to increase the sales shares of the largest U.S. grocery retailers during the next few years. This chart appears in “Slow Sales Growth and Increased Company Acquisitions Impact U.S. Food Retailing” in the November 2014 issue of ERS’s Amber Waves magazine.
Wednesday, October 1, 2014
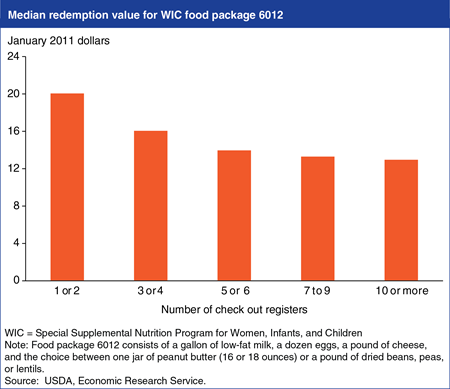
In fiscal 2013, USDA’s Special Supplemental Nutrition Program for Women, Infants, and Children (WIC) served an average of 8.7 million low-income participants per month, with expenditures totaling $6.4 billion. Containing program costs is a continual issue because WIC is funded annually by Congressional appropriations, making the program’s capacity largely dependent on funding levels and costs per participant. In turn, costs per participant depend in part on the prices charged for the WIC foods by WIC-authorized retailers. States are required to authorize an appropriate number and distribution of retailers to ensure adequate participant access to supplemental foods. A recent study found that smaller retailers in California charge higher prices than larger retailers for comparable WIC foods. However, prices did not decrease steadily with increases in store size. Stores with three or four check out registers had lower prices than did the smallest stores, and prices dropped again for stores with five or six registers, but prices were comparable among all stores with at least five registers. This chart is from “WIC Foods Cost More in Smaller Stores” in the September 2014 issue of ERS’s Amber Waves magazine.
Thursday, September 25, 2014
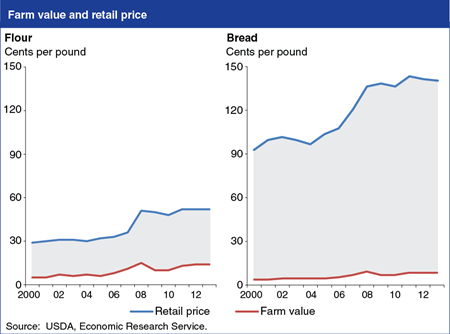
Food price spreads—the difference between a food’s retail price and the value of the farm commodities used in the food—measure the cost of processing, wholesaling, and retailing food from the farmer to consumer. Price spreads vary by food products, reflecting different degrees of processing and marketing. The price spread for white flour, which averaged 30 cents per pound over 2000-2013, is smaller than the price spread for white bread. Multiple ingredients are required to produce bread (including flour, high fructose corn syrup, and vegetable oil) and bread must be mixed, baked, sliced, packaged, and advertised. These additional processing and marketing costs resulted in an average price spread for bread of $1.13 per pound over 2000-2013. Large price spreads signal that changes in farm prices will likely have a weaker effect on retail prices. When wheat prices climbed 162 percent from 2000 to 2013, the retail price of flour rose 79 percent, while retail bread prices were only 52 percent higher. The statistics for these charts come from ERS’s data product, Price Spreads From Farm to Consumer, updated August 11, 2014.
Thursday, September 11, 2014
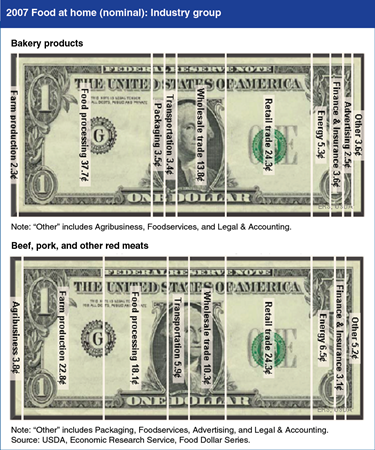
ERS’s Food Dollar Series was expanded in 2014 to include 16 commodity specific at-home food dollars that break out the value added, or cost contributions, from 12 industry groups in the U.S. food supply chain. Comparing the bakery-products dollar with the red meat-dollar highlights the larger role of processing and marketing costs for processed foods. For bakery products such as breads, crackers, cookies, and other sweet goods, processing costs were the largest cost component at 37.7 cents in 2007. In comparison, processing costs made up 18.1 cents of the beef, pork, and other red-meat food dollar, while farm production and agribusiness combined at 26.6 cents was the largest cost component. (Agribusinesses produce the services and products used by farmers, such as veterinary services and fertilizers.) For bakery products, farm-production costs was one of the smallest components at 2.3 cents, smaller than packaging and advertising. Statistics for these dollars and the other 14 commodity food dollars for benchmark years 1997, 2002, and 2007 can be found in ERS’s Food Dollar Series data product.
Wednesday, June 11, 2014
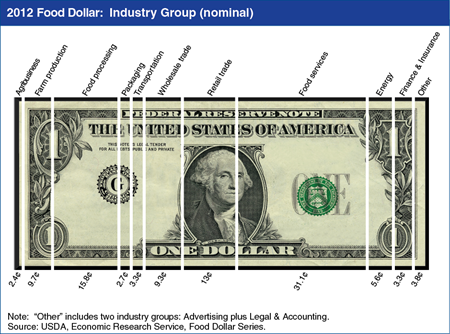
In the United States, 31.1 cents of a typical dollar spent by consumers on domestically–produced food went to pay for services provided by foodservice establishments, 15.8 cents to food processors, and 13 cents to food retailers. ERS uses input-output analysis to calculate the value added, or cost contributions, to the U.S. food dollar from 12 industry groups in the food supply chain—expanded in 2012 to include agribusiness and wholesale trade. Agribusinesses produce products and services used by farmers, such as fertilizers and veterinary services. Wholesale trade companies provide services to all industry groups for the acquisition of products, such as when farmers purchase fertilizers produced by an agribusiness, restaurants purchase takeout containers from a packaging company, and grocery stores purchase produce grown on a U.S. farm. Wholesale trade accounted for 9.3 cents of the 2012 food dollar and agribusiness accounted for 2.4 cents. Previously, wholesaling costs were included with the costs of the industry groups the wholesale companies were servicing, and agribusiness costs were combined with farm production. In 2012, farm production accounted for 9.7 cents of the food dollar. This chart is available for years 1993 to 2012 from ERS’s Food Dollar Series data product updated on May 28, 2014.
Tuesday, March 18, 2014
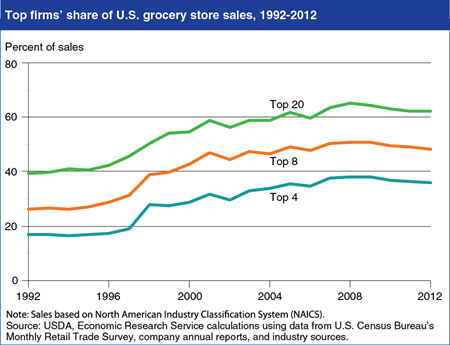
Grocery sales shares of the largest 4, 8, and 20 U.S. supermarket and supercenter retailers have decreased slightly since 2008, and company rankings have shifted somewhat. The 4 largest U.S. grocery retailers—Wal-Mart Stores, Kroger, Safeway, and Publix Super Markets—accounted for 36.1 percent of the $686 billion in total U.S. food and non-food (excluding fuel) grocery sales in 2012, down from 38.1 percent in 2008. Wal-Mart Supercenters maintained their dominant market share, with sales that were 53 percent higher than second-place Kroger in 2012. Ahold USA rose from sixth to fifth place despite 2012 sales that grew more slowly than in 2011. Target was among the largest 20 grocery retailers in 2012, taking the 14th spot. Target’s grocery sales rose at a faster pace in 2012 than the previous year, in contrast to the top 4 firms. SuperValu dropped from fourth to sixth place between 2011 and 2012, reflecting the late-in-the-year sale of about 90 percent of its approximately 1,900 retail outlets. Bi-Lo Holdings became the Nation’s 11th-largest grocery retailer, following the acquisition of 483 Winn-Dixie supermarkets in 2012. This chart appears in the Retailing and Wholesaling topic page on the ERS website, updated February 5, 2014.
Tuesday, February 4, 2014
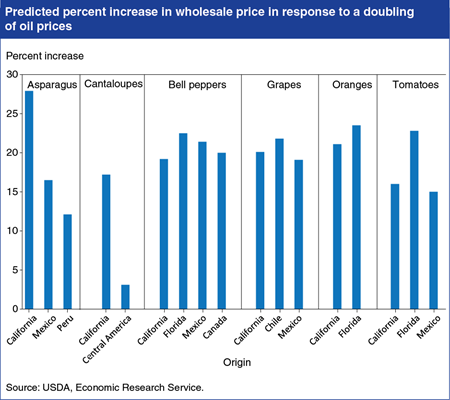
Fresh fruit and vegetable prices are among the most volatile U.S. retail food prices. One potential source of this volatility is the price of oil, as fresh fruits and vegetables often travel long distances from field to consumer. ERS researchers found that the impact of oil price increases on wholesale produce prices depends on both the commodity shipped and the route traveled. A hypothetical doubling of oil prices would be expected to increase wholesale prices of the 6 commodities studied—asparagus, cantaloupes, bell peppers, grapes, oranges, and tomatoes—by 3 to 27 percent depending on the origin of the commodity. Generally, wholesale prices of produce grown in the United States, Canada, and Mexico are more sensitive to changes in oil prices since produce grown in North America is shipped primarily by truck, which has relatively high fuel costs per pound of produce. Fresh fruit and vegetables from South and Central America are more likely to be shipped by plane or boat, which are less fuel-intensive modes of transportation. This chart appears in “Impact of Oil Prices on Produce Prices Depends on Route and Mode of Transportation” in ERS’s Amber Waves magazine, released February 3, 2014.
Wednesday, July 10, 2013
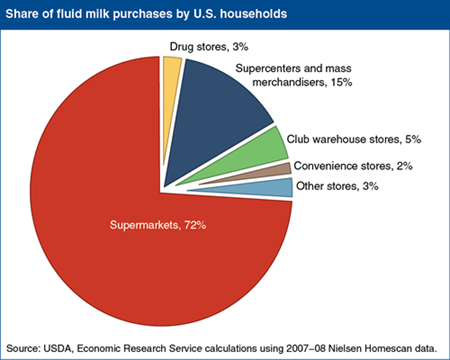
When purchasing food, households make many choices, including what to buy and where to shop. ERS researchers looked at how changes in income affect U.S. consumers’ milk purchasing decisions, including the type of store to patronize. They found that 72 percent of milk purchases took place in supermarkets, followed by 15 percent in supercenters and mass merchandisers. Club warehouse stores and drug stores accounted for 5 and 3 percent of milk purchases, even though these two store types had lower average milk prices than supermarkets, supercenters, or mass merchandisers. The analysis revealed that most households are unlikely to change where they buy their milk, even after large changes in income. Interestingly, a household was 6 percent more likely to buy its milk in a convenience store after its annual income dropped from $60,000 to $40,000, despite the higher price of milk in these stores. Other factors, such as the availability of a car and time to drive to a supermarket, can correlate with income and affect purchase decisions. The data for this chart are from “Changes in Income Have Small Effect on Where a Household Shops for Milk” in ERS’s July 2013 Amber Waves magazine.
Tuesday, May 14, 2013
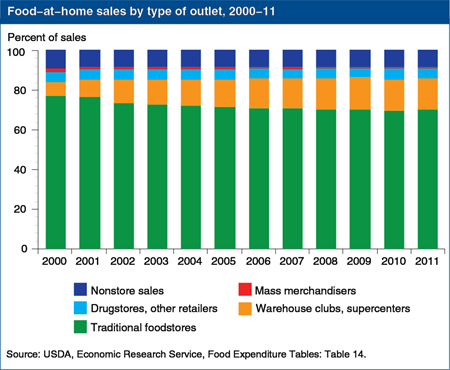
In 2011, traditional foodstores—supermarkets, grocery stores, and specialty food stores—accounted for 69.9 percent of U.S. food-at-home sales, down from 76.8 percent in 2000. Much of the sales share loss by traditional foodstores came from supercenters and warehouse clubs capturing more of the food-at-home market. Over the last 11 years, warehouse clubs and supercenters’ share of food-at-home sales grew from 7.1 to 16.0 percent. More recently, dollar stores and drugstores have expanded their food offerings and increased their share of at-home food sales. Nonstore food sales—such as mail order, home delivery, and direct sales by farms, processors, and wholesalers—made up a smaller share of total at-home food sales in 2011 than in 2000, and mass merchandisers’ share dropped from 1.7 percent in 2000 to 0.6 percent in 2011. This chart appears in the Retailing & Wholesaling ERS topic page, updated March 2013.
Wednesday, May 8, 2013
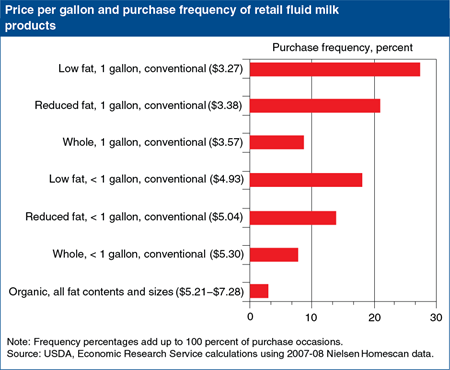
Consumers can buy fluid milk in a variety of forms and at a variety of prices. A recent ERS report looked at purchases of milk products that contained three different fat contents, came in two container sizes, and were produced by either conventional or organic methods. In 2007-08, conventionally produced, low-fat milk in a gallon container was the most frequently bought fluid milk product (28 percent of all milk purchases), while organic milk in all fat contents and container sizes accounted for 3 percent of milk purchases. The researchers analyzed how changes in milk prices and household income affect purchase frequency among fluid milk products. They found that an increase in income or overall milk prices raises the probability that the household will purchase low fat milk. An increase in household income also raises the probability of purchasing organic milk. In general, the demand for organic milk is more sensitive to swings in income and price than is the demand for conventional milk. This chart is based on data in the ERS report, Households’ Choices Among Fluid Milk Products: What Happens When Income and Prices Change?, released April 16, 2013.
Friday, April 19, 2013
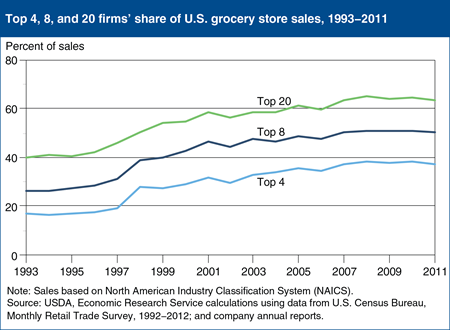
Sales by the 20 largest food retailers operating in the United States totaled $418 billion in 2011, accounting for 63.7 percent of total U.S. grocery store sales. The top 4 and 8 food retailers accounted for 37.3 percent and 50.5 percent, respectively, of total U.S. grocery store sales in 2011. With the Great Recession (December 2007 to June 2009), these sales shares began to flatten in 2008, contrasting with the longer term trend of increasing concentration of sales among the Nation’s largest grocery retailers. Mergers and acquisitions contributed to increasing concentration during the mid-to-late 1990s, with divestitures and internal growth playing a larger role since 2007. One contributing factor to the increases over the 1993-2008 period has been the rapid growth of Wal-Mart Supercenters. Their food and nonfood grocery sales amounted to an estimated $109 billion in 2011, making it the largest U.S. retailer of grocery products. In comparison, second-place Kroger had sales of $71 billion in 2011. This chart appears in the Retailing & Wholesaling topic page on the ERS website, updated March 27, 2013.
Wednesday, December 26, 2012
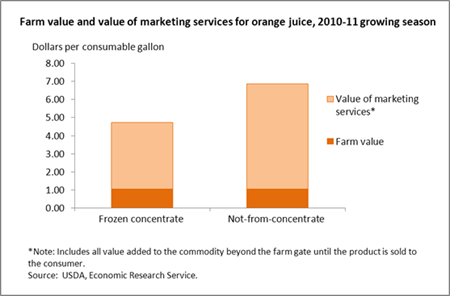
In 2010, Americans consumed 3.4 gallons of orange juice per person. While some families may have squeezed their own, most probably chose other options for their at-home consumption of orange juice, including purchasing frozen concentrated juice to be mixed with water, or ready-to-drink, not from concentrate (NFC) juice. Greater costs for marketing services like packaging and transportation for NFC juices show up in their higher retail prices. For the 2010-11 growing season, NFC orange juice sold in retail stores for $6.86 per gallon, on average, and frozen concentrate for $4.73 per gallon when reconstituted. While the amount of value-adding services is higher for NFC juice, the farm value of fresh Florida oranges used in both types of juice is the same--$1.04 per gallon in 2010-11. Thus, the farm share of retail price is higher for frozen concentrated orange juice. In 2010-11, the farm share was 22 percent for frozen concentrate, compared to 15 percent for NFC. This chart is based on ERS’s farm share statistics found in the Price Spreads from Farm to Consumer data product, updated November 2012.
Wednesday, October 3, 2012
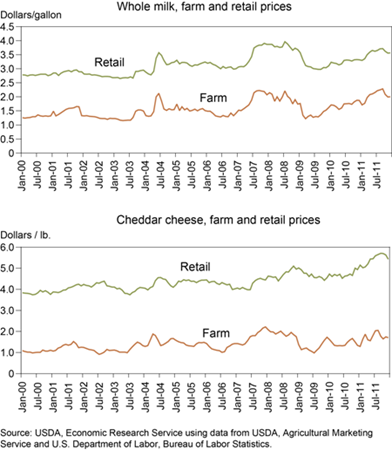
Changes in the farm value and retail price of whole milk tend to track relatively closely over time. Milk moves from farms to retail outlets, via fluid milk processors, in a matter of days. Prices paid at each end of the supply chain are thus close together in time, and changes may be transmitted quickly from level to level. The relationship between the farm value and retail price is weaker for Cheddar cheese. Cheese manufacturing is a lengthier process than fluid milk processing, and cheese may pass through several intermediaries before reaching retail outlets. Prices at each end of the supply chain are thus farther apart in time, and changes at one level are not reflected as quickly at the other. This chart appears in "Retail Dairy Prices Respond Differently to Farm Milk Price Shocks" in the September 2012 issue of ERS's Amber Waves magazine.
Tuesday, August 21, 2012
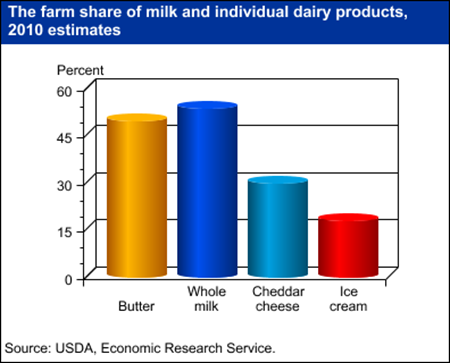
The farm share--the portion of a food's retail price that represents what farmers earn for the agricultural commodities used to produce the food--varies depending, in part, on the degree of processing. Farm shares for highly-processed foods are generally smaller than less processed foods. Dairy products are a case in point. Minimally-processed products like milk and butter have higher farm shares than cheese or ice cream. In 2010, the farm share for fresh whole milk was 54 percent, while the farm shares for Cheddar cheese and ice cream were 30 percent and 18 percent, respectively. Cheddar cheese's lower farm share reflects the costs to process milk into cheese, along with aging, cutting, shredding, packaging, and/or advertising costs. Ice cream makers have greater costs for non-milk inputs like packaging, advertising, and ingredients such as nuts and cookie bits. The data for this chart come from ERS's Price Spreads from Farm to Consumer data set.


