ERS Charts of Note
Subscribe to get highlights from our current and past research, Monday through Friday, or see our privacy policy.
Get the latest charts via email, or on our mobile app for  and
and 
Friday, June 27, 2014
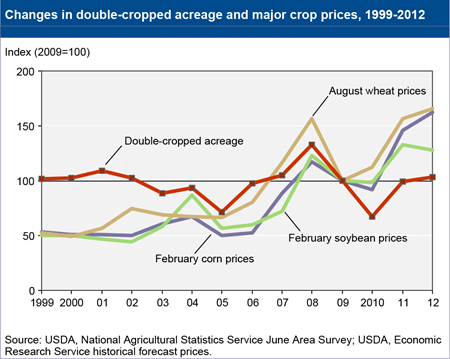
Double-cropped acreage has varied from year to year. Because decisions about double cropping are made annually, fluctuations are likely as farmers respond to changing market and weather conditions. For example, higher commodity prices give farmers more incentive to intensify production and could offset revenue shortfalls from lower potential yields when double cropping. From 2004 to 2012, total double-cropped acreage roughly paralleled soybean, winter wheat, and corn prices. When commodity prices at the time of planting decisions were increasing or relatively high, total double-cropped acreage also increased. Total double-cropped acreage peaked at 10.9 million acres in 2008, when prices for soybeans, winter wheat, and corn also peaked. In 2005 and 2010, nearly every region witnessed declines in double-cropped acreage amid commodity price declines. This chart is found in the ERS report, Multi-Cropping Practices: Recent Trends in Double-Cropping, EIB-125, May 2014.
Wednesday, June 25, 2014
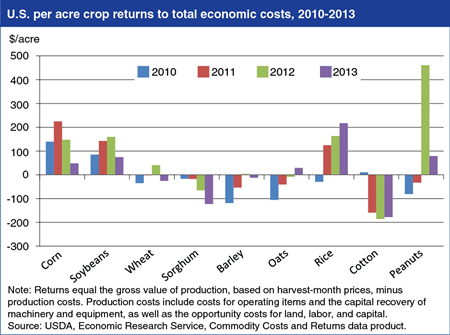
Estimates of U.S. crop returns per acre reveal large differences in crop profitability across commodities and over time during 2010-13. Returns to crop production are defined as the gross value of production less total economic costs. Total economic costs include operating costs such as seeds, fertilizer, and pesticides; the capital recovery cost for machinery and equipment; and the costs—known as opportunity costs—of employing land, labor, capital and other owned resources that have alternative uses. While returns to total economic costs for corn, soybeans, rice, and peanuts were positive, on average, for the 2010-13 period, average returns for other major crops were negative. For most crops, changes in farm prices and the gross value of production per acre, rather than changes in production costs, have driven returns to total economic costs. Lower prices contributed to reduced returns for corn, soybeans, wheat, sorghum, and peanuts in 2013, while price and yield increases improved returns for oats and rice. The negative returns over total economic costs for some crops indicate that that those producers realized a lower rate of return to their land, labor, and capital than the benchmark rates of return used in ERS commodity cost and returns accounts; returns over operating costs alone were positive for all crops throughout the period. This chart is based on data found in Commodity Costs and Returns.
Friday, June 20, 2014
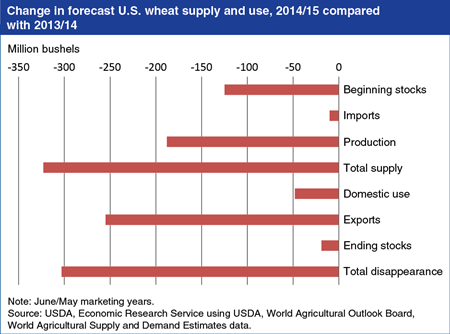
U.S. wheat supplies are projected down 11 percent for 2014/15 (June/May marketing year), with beginning stocks, production, and imports all forecast lower than in 2013/14. Supplies for the new marketing year are expected to be the lowest since 2007/08. Production is forecast at 1,942 million bushels, down 9 percent from 2013/14, with lower area and yield for soft red winter wheat and drought-reduced yields in the Central and Southern Plains contributing to lower 2014/14 production. Total U.S. wheat use is forecast to fall 13 percent in 2014/15, as domestic use and exports fall due to tighter supplies and stronger export competition. Exports for 2014/15 are projected at 925 million bushels, down 255 million from estimated 2013/14 exports because of relatively large supplies with other major exporting countries. U.S. ending stocks are projected to decline for a fifth consecutive year. The forecast season-average farm price range for wheat in 2014/15 is $6.35 to $7.65 per bushel, with a midpoint 1.9 percent above the 2013/14 price of $6.87 per bushel. Find additional analysis in Wheat Outlook: June 2014.
Tuesday, June 10, 2014
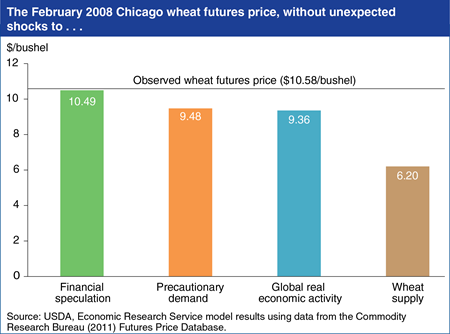
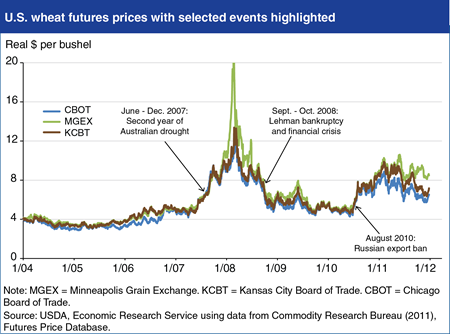
Over the last 5 years, wheat futures prices spiked and then crashed, with increased price volatility drawing the public’s attention. Recent ERS research indicates that the volatility has been primarily due to supply conditions specific to the wheat sector. Wheat supply shocks, such as weather events that lowered yields, were the dominant cause of price spikes between 1991 and 2011. Focusing specifically on the February 2008 price spike, the results showed that, depending on the class of wheat, wheat prices in that month would have been 40-62 percent lower in the absence of supply shocks affecting that year’s wheat crop. The second most important factor in the 2008 spike was shocks to precautionary demand —or incentives to hold commodity inventories associated with expectations about future prices. Wheat prices would have been 11-36 percent lower in the absence of these shocks. Demand shocks associated with fluctuations in global economic activity had a 9- to 12-percent price impact. The shocks attributable to financial speculators like commodity index traders had only a 1-percent impact on the peak wheat price in February 2008. Find this chart in “Wheat Prices Driven by Supply and Demand” in the June Amber Waves, with additional analysis in Deconstructing Wheat Price Spikes: A Model of Supply and Demand, Financial Speculation, and Commodity Price Comovement, ERR- 165.
Tuesday, May 13, 2014
U.S. wheat prices have spiked and then fallen along with prices for other commodities over the last 5 years, leading to questions about how factors such as market fundamentals, macroeconomic events, and increased commodity index trading have contributed to these price swings. Recent ERS research measures the relative contribution of different factors to observed price changes during 1991-2011. Findings show that market-specific shocks related to supply and demand for wheat, such as drought impacts on consecutive Australian wheat harvests in 2006-07 and a Russian ban on wheat exports in August 2010, were the dominant cause of price spikes in the three U.S. wheat futures markets. Fluctuations in the global economy associated with broadbased demand shocks such as the Lehman Brothers Holdings, Inc. bankruptcy, were relatively less significant, and there is little evidence to suggest that increased commodity index trading activity contributed to recent price spikes. Find this chart and more analysis in Deconstructing Wheat Price Spikes: A Model of Supply and Demand, Financial Speculation, and Commodity Price Comovement.
Friday, April 18, 2014
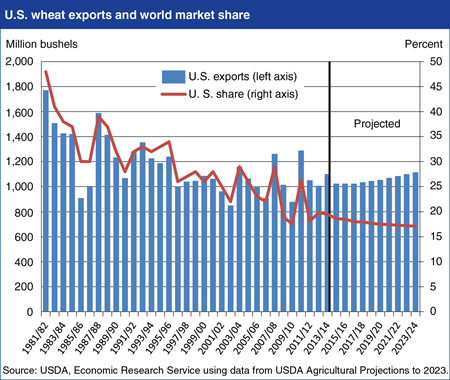
Although global and U.S. wheat exports are projected to rise over the next decade, the U.S. share of the world market is projected to continue to decline because of competition from other exporters. Global demand for wheat is expected to expand, driven primarily by income and population growth in developing country markets, including Sub-Saharan Africa, Egypt, Pakistan, Algeria, Indonesia, the Philippines, and Brazil. The number of major exporting countries has, however, expanded in recent years from the traditional wheat exporters--the United States, Argentina, Australia, Canada, and the European Union--to include Ukraine, Russia, and Kazakhstan. Although variable, the wheat export volume of those three Black Sea exporters together now rivals that of the United States. Low production costs and new investment in the agricultural sectors of the Black Sea region have enabled their world market share to climb, despite the region’s highly variable weather. Competition from the Black Sea region, as well as from traditional exporters, has resulted in a decline in the U.S. share of expanding world exports from an average of about 39 percent in the first half of the 1980s to an average of about 20 percent over the last 5 years. Find this chart and additional analysis on the Wheat topic page.
Wednesday, April 2, 2014
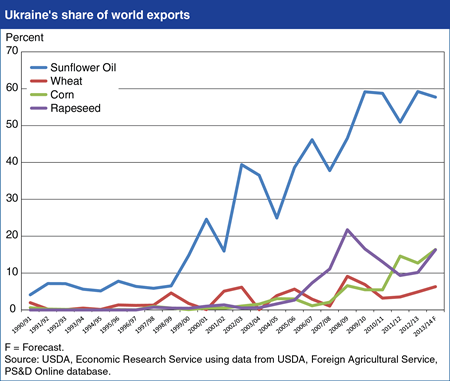
Over the last 15 years, Ukraine has emerged as a major supplier to world markets for several agricultural commodities, including wheat, corn, sunflower oil, and rapeseed. Wheat is a traditional export, with annual shipments varying with crop size. For 2013/14 (July/June marketing year), Ukraine’s wheat exports are forecast at 10 million tons, or about 6 percent of world wheat trade. During the last decade, Ukraine’s corn production and exports have expanded, with 2013/14 (October/September) exports forecast at 18.5 million tons, making Ukraine the world’s third-largest corn exporter. Robust production growth is also behind Ukraine’s emergence as the world’s dominant supplier of sunflowerseed oil, with 2013/14 (September/August) exports forecast at nearly 4.1 million tons, or about 57 percent of global trade. Ukraine has also become a significant exporter of rapeseed, with 2013/14 (July/June) exports forecast at about 2.2 million tons, or 16 percent of world trade. Despite recent political developments in Ukraine, so far there is no evidence of significant shipping disruptions that might alter the 2013/14 Ukraine export forecasts. Find additional analysis Wheat Outlook: March 2014, Feed Outlook: March 2014, and Oil Crops Outlook: March 2014.
Monday, February 24, 2014
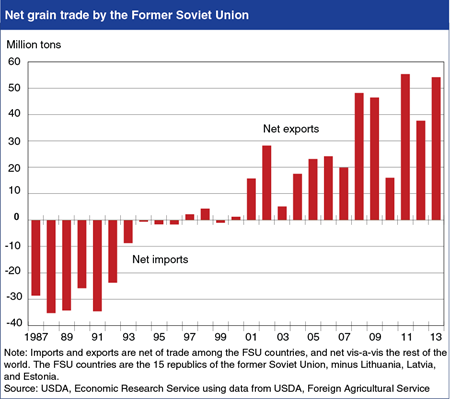
Since the breakup of the former Soviet Union (FSU) in the early 1990s, the region has transitioned from major grain importer to major grain exporter, with important implications for global markets. The region was a large importer of grains—primarily wheat and corn—during the last decade of the FSU, with net imports in some years exceeding 30 million tons. Grain imports largely ceased during the 1990s, but the region emerged as a grain exporter beginning in 2001. Although FSU grain production and exports can vary significantly due to weather conditions, net exports have exceeded 50 million tons in some recent years, representing a swing of roughly 80 million tons of grain available on the world market compared with the 1980s. The vast bulk of the FSU exports are wheat, barley, and corn from the three main agricultural countries of the region – Russia, Ukraine, and Kazakhstan. The trade turnaround has occurred for two main reasons, the first being the contraction of the region’s livestock sector by about half during the 1990s following withdrawal of subsidies under the Soviet system, reducing the need for large imports of animal feed. The second factor is significant gains in grain yields and production during the 2000s, which has created surpluses for export. For more information, see Rising Grain Exports by the Former Soviet Union Region.
Friday, January 24, 2014
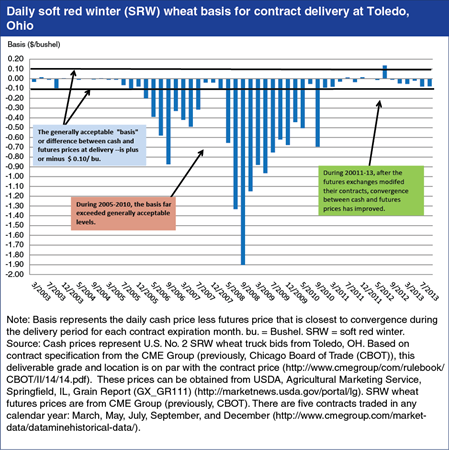
Futures markets play an important role in price discovery (determination of prices through the interaction of market supply and demand) for major agricultural commodities, and provide a tool for growers, traders, and processors to mitigate risk. For futures markets to perform these functions effectively, the price of a commodity held in a futures contract must match (or “converge”) with its price in the cash—or spot—market when the futures contract expires. During 2005-2011, cash and futures prices for soft red winter (SRW) wheat failed to converge to the generally acceptable “basis”—or difference between the cash price and futures price—of plus or minus $0.10/bushel. At times the basis exceeded $1.00/bushel. In response, the futures exchanges modified their SRW contracts to better align contract terms with changes occurring in cash markets for factors including storage rates, major delivery locations for SRW, and quality specifications. Following these changes, cash and futures market prices for SRW have moved closer together, improving the effectiveness of futures contracts in determining prices and as a tool to manage risk. This chart is based on Recent Convergence Performance of Futures and Cash Prices for Corn, Soybeans, and Wheat, FDS-13L-01, released December 30, 2013.
Friday, January 10, 2014
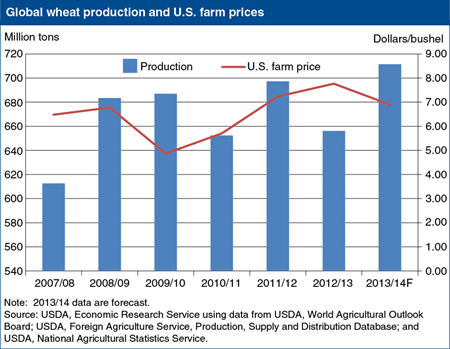
World wheat production is forecast at a record 711.4 million tons in 2013/14 (June/May marketing year), 2 percent above the previous record outturn in 2011/12. The average per hectare yield is forecast at 2.9 percent above the previous record. A record crop in Canada, along with larger harvests in Australia and the Black Sea exporters (Russia, Ukraine, and Kazakhstan) are major contributors to the outlook for the increase in global wheat output. World wheat trade is also forecast to reach a record 154.3 million tons in 2013/14 as increased supplies in major wheat producing and exporting countries—including Canada, Australia, and the Black Sea exporters—puts downward pressure on wheat prices. U.S. wheat prices are also under pressure because falling U.S. corn prices following the rebound in the 2013/14 U.S. corn crop have led to reduced demand for feed wheat. U.S. season average farm prices are currently forecast in the range of $6.65 to $7.15 per bushel, the midpoint of that range down more than 11 percent from the 2012/13 record of $7.77. This chart is based on data and analysis provided in Wheat Outlook: December 2013.
Friday, November 15, 2013
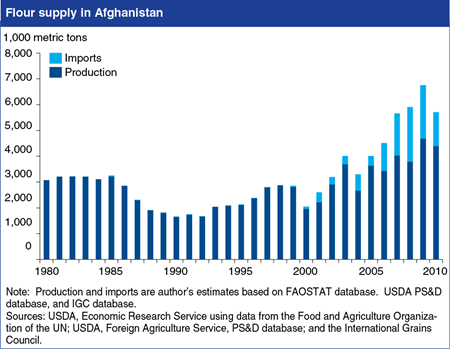
Afghanistan is among the world’s largest importers of wheat flour, with imports growing since 2000 because of a recovery in internal demand, and inadequate water supplies that continue to limit domestic wheat production. Afghan flour production—the nation’s largest official agro-industry—faces competition from imported flour, much of it from neighboring Pakistan where wheat producers and flour millers benefit from Government support. Efforts to support Afghanistan’s flour-milling sector by increasing border protections on flour and wheat—if enforceable along the country’s rugged borders—would have uncertain impact on water-constrained wheat production, and impose higher costs on consumers. Unhindered wheat and flour imports, including imports from Pakistan, may support growth in domestic flour consumption, with relatively small losses in farm output. This chart appears in Afghanistan’s Wheat Flour Market: Policies and Prospects.
Thursday, September 26, 2013
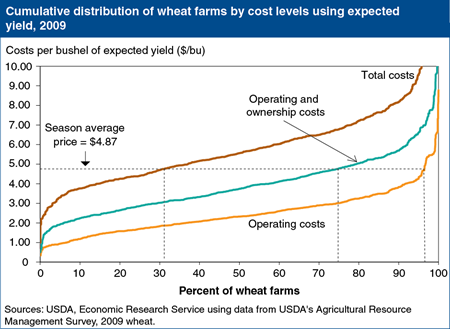
There is wide variation in wheat production costs on U.S. farms based on differences in cropping practices, yields, and costs of land, labor, and capital assets across wheat-producing regions. USDA’s 2009 Agricultural Resource Management Survey found that 97 percent of the country’s farms could have covered all their operating costs (shortrun costs of planting, growing, and harvesting) with the 2009/10 season average price of $4.87 per bushel if they had been able to attain the yields they expected at planting (as reported in the survey). Under the same price and yield assumptions, about 77 percent would have covered both operating and ownership costs (repair costs, annualized depreciation and interest costs, property taxes, and insurance) and 34 percent would have covered total costs (operating and ownership costs, as well as the opportunity costs of unpaid labor and land rental, and general farm overhead). However, during 2009/10, only 79 percent of wheat farms were able to cover their operating costs with the yields they actually harvested. The relatively high share of farmers not covering these shortrun costs is attributed, in part, to yield losses in the Southern Plains, where crops were adversely affected by severe weather during 2009/10. This chart can be found in U.S. Wheat Production Practices, Costs, and Yields: Variations Across Regions, EIB-116.
Thursday, September 12, 2013
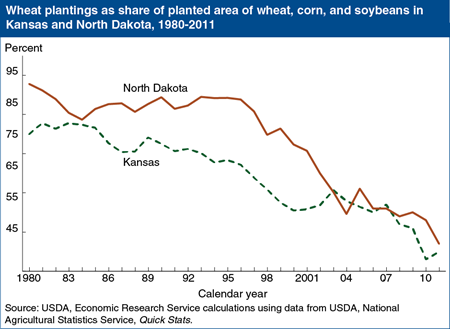
Although the United States remains a major wheat producer, ranking fourth globally after China, the European Union, and India, U.S. wheat area has generally declined since the mid-1980s, in part due to changes in policies and technology that have altered incentives for wheat cultivation. Recent trends are exemplified by developments in two of the largest wheat-producing states: Kansas and North Dakota. The 1996 Farm Act introduced full planting flexibility, enabling farmers to switch to alternative crops without penalties and increasing competition with corn and oilseeds which were more profitable than wheat. Technology changes include new practices that reduce wheat’s frequency in crop rotations, including increased use of water-conserving reduced-till and no-till farming that has enhanced the yields and profitability of crops such as corn and soybeans. Wheat acreage has also been affected by new, genetically modified varieties of corn and soybeans that can be planted farther west and north in areas with drier conditions or shorter growing seasons, and by new herbicide-resistant varieties of corn and soybeans that afford easier weed control. In contrast, the pace of varietal improvement has been slower for wheat, resulting in little growth in wheat yields and reducing its value as a cropping option. In Kansas and North Dakota, wheat accounted for 80-90 percent of the total area of wheat, corn, and soybeans planted in the 1980s but, in recent years, wheat’s share has dropped to 50-52 percent. This chart can be found in U.S. Wheat Production Practices, Costs, and Yields: Variations Across Regions, EIB-116.
Tuesday, June 11, 2013
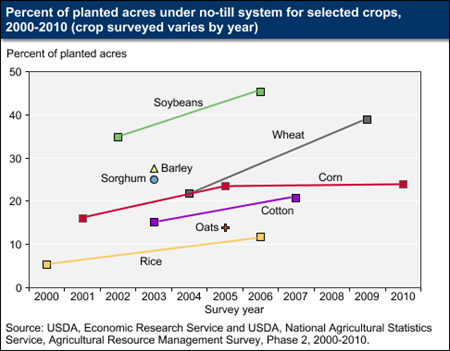
Farmers have choices for how they prepare the soil; reduce weed growth; incorporate fertilizer, manure and organic matter into the soil; and seed their crops, including the number of tillage operations and tillage depth. Tillage practices affect soil carbon, water pollution, and farmers’ energy and pesticide use. No-till is generally the least intensive form of tillage. Approximately 35 percent of U.S. cropland (88 million acres) planted to eight major crops had no-till operations in 2009, according to ERS researchers who estimated tillage trends based on 2000-07 data from USDA’s Agricultural Resource Management Survey (ARMS). Furthermore, the use of no-till increased over time for corn, cotton, soybeans, rice and wheat, the crops for which the ARMS data were sufficient to calculate a trend. While a more recent estimate of nationwide use of no-till by all major crop producers is not available, based on the results of recent surveys of wheat producers in 2009 and corn producers in 2010, it seems likely that no-till’s use continues to spread, albeit at a much reduced pace among corn producers. This chart is found on the ERS topic page, Soil Tillage and Crop Rotation, and in the ERS report, Agriculture’s Supply and Demand for Energy and Energy Products, EIB-112, May 2013.
Tuesday, April 23, 2013
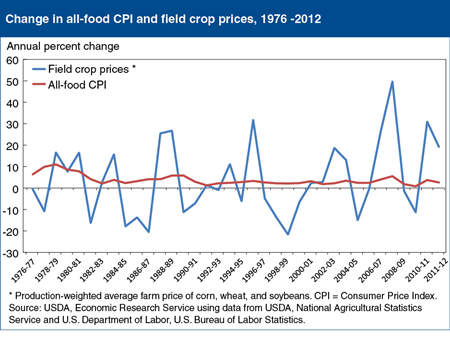
Farm-level commodity prices are far more volatile than food prices, as costs for marketing inputs such as packaging, processing, and transportation mitigate commodity price volatility on supermarket shelves and restaurant menus. Corn, wheat, and soybeans are the three most important field crops to the U.S. food supply. The average farm price of these crops, weighted by total production, regularly rises or falls by over 10 percent from year to year. On average, food prices have become less volatile in recent decades, as food price inflation averaged 8 percent per year in the 1970s, but only 2.8 percent per year since 1990. Commodity prices, alternatively, have grown somewhat more volatile over time. However, large changes in major commodity prices have relatively small impacts on food prices. In 2007-08, the average production-weighted price of these crops increased by 50 percent, while food prices rose 5.5 percent. Similarly, in 2010-11, the crop prices rose 31 percent and food prices increased 3.7 percent. This chart appears in the Food Price Outlook topic page on the ERS website, updated April 17, 2013.
Friday, April 5, 2013
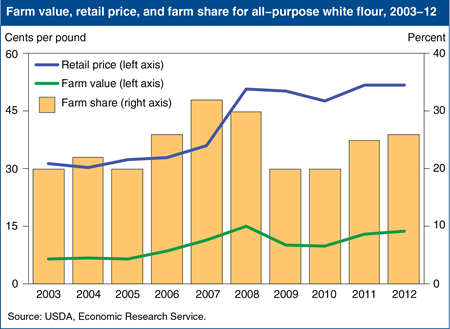
Retail prices for minimally processed foods tend to fluctuate with farm prices for the agricultural commodities used in their manufacture. Prices for wheat and other grains and oilseeds have risen due to a variety of factors including, most recently, the 2012 drought. Prices for flour in retail stores are up as well. Grinding 1.37 pounds of hard red winter wheat produces 1 pound of all-purpose white flour and wheat middlings that may be used in other food products or animal feed. Over 2011 and 2012, as the farm value—the cost of the wheat in a pound of flour—rose from 10 to 14 cents (a 40-percent increase), the average retail price for all-purpose white flour rose from 48 to 52 cents per pound (an 8.3-percent increase). The farm share of the retail price of flour simultaneously increased from 20 to 26 percent. More information on ERS’s farm share data can be found in the Price Spreads from Farm to Consumer data product, updated March 20, 2013.
Monday, March 25, 2013
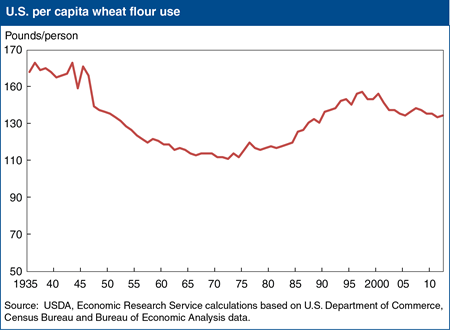
U.S. per capita all-wheat flour use has fluctuated significantly since the 1930s, but is now showing signs of leveling off. Per capita use for 2012 is estimated at 134.4 pounds, up 1.9 pounds from the 2011 estimate, but well below the most recent peak of 147 pounds in 1997 and an earlier peak of 163 pounds during World War II. From the late 1880s until about 1970, U.S. per capita wheat use generally declined, as strenuous physical labor became less common and diets became more diversified. The rebound during 1970-97 reflected such factors as growth in away-from-home eating and an increased understanding of the health benefits from eating high-fiber, grain-based foods. Since 1997, lower wheat use appears to be influenced by consumer interest in low-carbohydrate diets. While U.S. wheat producers benefited from rising U.S. demand between 1970 and the late 1990s, they now face less robust growth in the domestic market. This chart is adapted from a chart in Wheat Outlook: March 2013.
Thursday, August 23, 2012
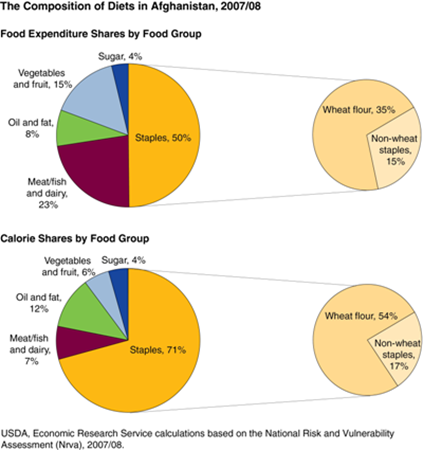
Increases in the prices of staple foods can have serious effects for households living at or near subsistence levels. Over the past few years, increases in global food prices have led to an erosion of purchasing power in many developing countries, where the poor often spend the majority of their budgets on food. Staple foods make up 50 percent of household food expenditures and 71 percent of daily calorie intake in Afghanistan. Wheat flour, which doubled in price between December 2007 and July 2008, is the primary staple food in Afghanistan; it alone accounts for 54 percent of daily calories per capita and 35 percent of household food expenditures. The differences in the calorie and expenditure shares reflect price differences between food groups. The cheapest foods--in terms of calories per Afghani (the local currency)--are grains and pulses. For 1 Afghani (approximately 2 cents), a household can purchase approximately 184 calories of wheat flour, 106 calories of lentils, or 78 calories of rice. In contrast, meat and vegetables are the most expensive; one Afghani purchases only 9 calories of beef or 10 calories of cucumber. These charts are found in the ERS report, International Food Security Assessment, 2012-22, GFA-23, July 2012. Additional information can also be found in "Rising Food Prices and Declining Food Security: Evidence From Afghanistan" in Amber Waves, September 2011.
Wednesday, June 20, 2012
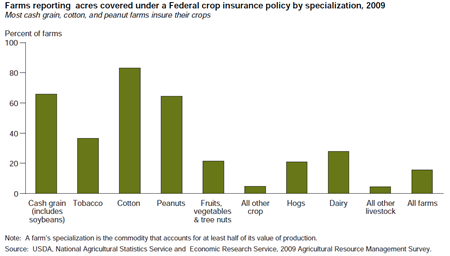
Most farms specializing in cash grains, cotton, and peanuts reported farmland covered under a Federal crop insurance policy in the 2009 Agricultural Resource Management Survey. Farms with other specializations participated in Federal crop insurance, but to a lesser degree. About a third of tobacco farms had insured land, as well as 20 to 30 percent of farms specializing in hogs, dairy, or fruits, vegetables, and tree nuts. Hog and dairy farms often grow crops to feed their livestock, and these crops are eligible for Federal crop insurance. This chart is found in Changing Farm Structure and the Distribution of Farm Payments and Federal Crop Insurance, EIB-91, February 2012.
Monday, March 12, 2012
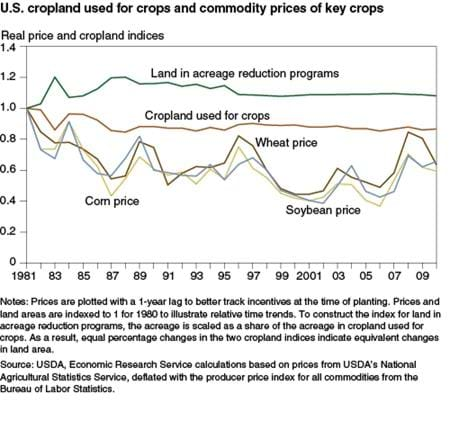
Since 1980, the variation in cropland used for crops has been relatively small, despite significant variation in real (adjusted for inflation) commodity prices. Between 1980 and 2002, the real prices of major commodities (e.g., corn, soybeans, wheat) declined by over 60 percent, while total cropland used for crops dropped by about 6 percent. This relatively small reduction in cropland use may reflect changes in farm legislation in the 1980s and 1990s, which marked a shift toward greater market orientation with the addition of income-supporting (rather than price-supporting) commodity loan programs in 1985 that help protect against revenue losses and the introduction of planting flexibility on acres qualifying for commodity program payments in 1990. Productivity increases also mitigated some of the effect of real price declines on the real returns to crop production. Since 2002, prices of major commodities dropped and then spiked during 2006-08. While cropland used for crops changed little in total during this period, farmers changed the mix of crops by increasing land in corn and wheat and reducing the amount of land planted to hay and other crops. This chart is found in the March 2012 issue of Amber Waves magazine.


