ERS Charts of Note
Subscribe to get highlights from our current and past research, Monday through Friday, or see our privacy policy.
Get the latest charts via email, or on our mobile app for  and
and 
Wednesday, July 1, 2015
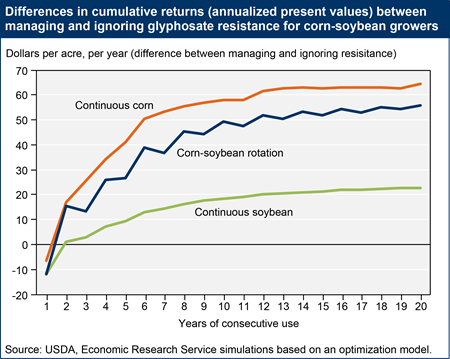
Glyphosate—known by many trade names, including Roundup—has been the most widely used herbicide in the United States since 2001. Crop producers can spray entire fields planted with genetically engineered, glyphosate-tolerant (GT) seed varieties, killing the weeds but not the crops. However, widespread use of glyphosate in isolation can select for glyphosate resistance by controlling susceptible weeds while allowing more resistant weeds to survive, which can then propagate and spread. ERS analyses show that weed control strategies (over 20 years) that manage glyphosate resistance differ from those that ignore glyphosate resistance by using glyphosate during fewer years, by often combining glyphosate with one or more alternative herbicides, and by not applying glyphosate during consecutive growing seasons. Initiating resistance management reduces returns compared to ignoring resistance in the first year, but increases them in subsequent years, as the value of crop yield gains outweighs increases in weed management cost. After two consecutive years of resistance management, the cumulative impact of growers’ returns from continuous corn cultivation, corn-soybean rotation, or continuous soybean cultivation exceeds that received when resistance is ignored. This chart is found in the Amber Waves feature, “Managing Glyphosate Resistance May Sustain Its Efficacy and Increase Long-Term Returns to Corn and Soybean Production,” May 2015.
Monday, May 11, 2015
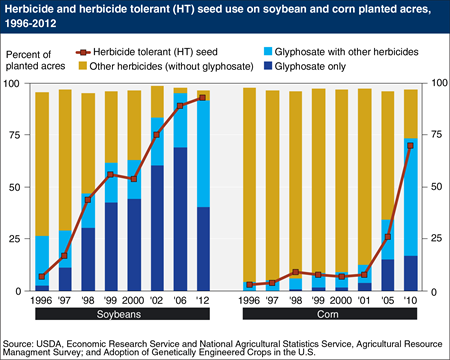
Recent data from the Agricultural Resource Management Survey (ARMS) suggest that glyphosate resistant weeds are more prevalent in soybean than in corn production. Glyphosate, known by many trade names (including Roundup), has been the most widely used pesticide in the United States since 2001. It effectively controls many weed species and generally costs less than the herbicides it replaced. Overall, glyphosate was used on a higher proportion of soybean than corn acres, and it was used alone (not in combination with other herbicides) on a substantially higher proportion of soybean acres. Using glyphosate alone contributes to resistance. Many soybean fields are managed with glyphosate alone, because the next best alternative herbicides are more expensive, less effective, and/or can cause significant injury to soybean plants. This chart is found in the Amber Waves feature, “Managing Glyphosate Resistance May Sustain Its Efficacy and Increase Long-Term Returns to Corn and Soybean Production,” May 2015.
Tuesday, February 24, 2015
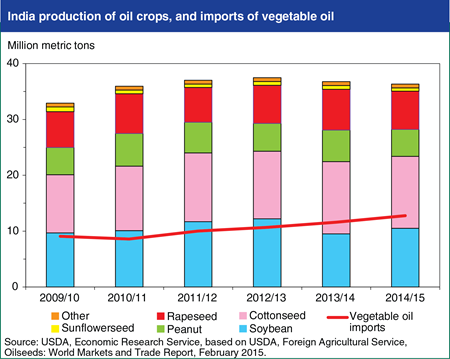
Production incentives for Indian oilseeds are being eroded by declining prices for imported vegetable oils, which are down to a six-year low. Indian rapeseed area fell 7 percent in 2014/15 to 6.6 million hectares. Peanut production is down 4.6 million hectares (15 percent) from 2013/14, continuing a shift by Indian farmers to competing crops such as cotton. Similarly, sunflowerseed area is down 13 percent in 2014/15. Cottonseed production is estimated to be nearly flat in 2014/15 and soybean production increased about 10 percent, reflecting an improved yield. Total oilseed production will be down about a half million metric tons from the previous year and 1.2 million metric tons from 2012/13. To make up for lower domestic production, India’s imports of vegetable oil are forecast to be up more than 10 percent in 2014/15, the fourth consecutive year of growth. This trend has turned India into the world’s top importing country for vegetable oil, and a major factor in determining global prices. This chart is based on the February 2015 Oil Crops Outlook Report.
Monday, December 22, 2014
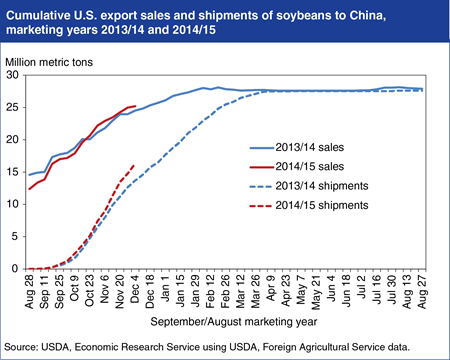
The large 2014/15 (September/August) U.S. soybean crop—18 percent above the previous record—has led to a record pace for U.S. soybean export sales commitments, including sales to China, the largest U.S. market for soybeans. The 2014/15 U.S. soybean crop is estimated at 107.7 million tons and total marketing year exports are forecast at a record 47.9 million tons. Cumulative export shipments have accelerated this fall, with record U.S. export inspections of soybeans in October and again in November. China accounts for most of the gains with 72 percent of U.S. export shipments to date, although substantial gains have been seen for other importers, including the EU, Turkey, and Taiwan. Actual U.S. export shipments are now growing faster than export sales and due to this robust pace, future shipments could moderate without another round of new sales. Even with the outlook for record U.S. exports, the large U.S harvest, coupled with expected record Brazilian and Argentine harvests, is forecast to lead to a 23-percent decline in the U.S. farm price of soybeans to about $10/bushel for 2014/15. Find additional analysis in Soybeans and Oil Crops Outlook: December 2014.
Friday, October 17, 2014
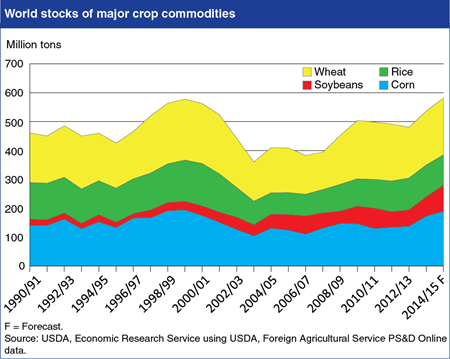
Global stocks of major crop commodities are forecast to expand in the 2014/15 marketing year, with total stocks of wheat, rice, corn, and soybeans completing recovery from the relatively low levels that preceded the 2008 spike in world crop prices. Record U.S. crops of corn and soybeans, along with good harvest by some other major producing countries, are forecast to push both U.S. and global stocks of these commodities to record levels. World wheat stocks are forecast to rise based on the outlook for record or near-record harvests by major foreign producers, including China, the EU, India, and the Former Soviet Union. While world rice stocks are forecast below peak levels of the early 2000s, good harvests and ample stocks are expected across the major producing regions in Asia. The supply outlook is expected to lead to lower commodity prices, with the average U.S. farm prices of corn (-24 percent), soybeans (-23 percent), wheat (-14 percent), and rice (-10 percent) all forecast down in their respective 2014/15 marketing years compared with 2013/14. Find additional analysis in the current editions of Feed Grain Outlook, Oil Crops Outlook, Wheat Outlook, and Rice Outlook.
Friday, August 29, 2014
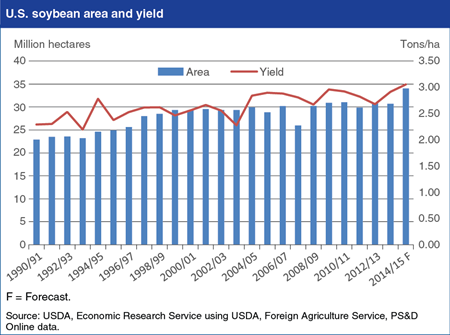
The 2014/15 U.S. soybean crop is forecast at 103.8 million tons (3.82 million bushels)—13.6 percent above the previous record set in 2009/10—based on the outlook for record area harvested and yield. The first USDA objective yield forecast for the 2014 crop indicates an all-time high of 3.05 tons per hectare (45.4 bushels per acre), 4.7 percent above the 2013/14 record. Harvested area is forecast at 34.02 million hectares (84.1 million acres), 9.7 percent above the previous record set in 2010/11. Higher supplies are forecast to raise season-ending soybean stocks to 11.7 million tons (430 million bushels), with the growing stocks forecast leading USDA to trim its 2014/15 forecast of the U.S. average farm price by 15 cents to $9.35-$11.35 per bushel. Seventy percent of the U.S. soybean crop was rated in good-to-excellent condition as of August 24—a level surpassed only once for this date (in 2004). Favorable growing conditions have been widespread throughout the country, with record yields anticipated for Illinois, Ohio, Arkansas, Louisiana, and Mississippi. Find additional analysis in Oil Crops Outlook: August 2014.
Friday, August 1, 2014
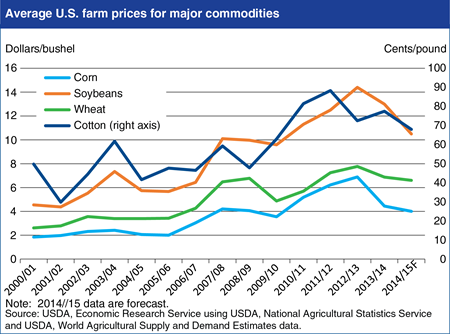
Current USDA forecasts show declines in U.S. average farm prices for major U.S. field crops—corn, soybeans, wheat, and cotton—of 4 to 19 percent in 2014/15. For corn, soybeans, and wheat, this would be the second consecutive year of declining prices. Soybean prices are forecast to decline the most in 2014/15, based on an expected record U.S. crop, combined with ample supplies from Brazil and Argentina. U.S. corn prices are forecast to fall 10 percent in 2014/15, after a 35-percent decline in 2013/14, also based on a large U.S. corn crop forecast and competition from other exporters like Brazil, Argentina, and Ukraine. U.S. wheat prices are forecast to decline about 4 percent in 2014/15, despite the forecast for smaller U.S. supplies, due to adequate supplies from both traditional and Black Sea wheat exporters. Although smaller cotton crops are forecast for China and India—the top two global producers—a larger U.S. crop is expected to lead to a fifth consecutive year of rising global cotton stocks and a 12-percent drop in U.S. prices in 2014/15. Find additional analysis in the current ERS outlook newsletters: Feed Outlook: July 2014, Oil Crops Outlook: July 2014, Wheat Outlook: July 2014, and Cotton and Wool Outlook: July 2014.
Thursday, July 31, 2014
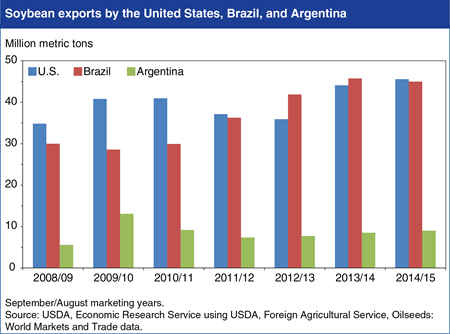
With the 2014/15 (September/August marketing years) soybean production forecast at a record 103.4 million metric tons (3.8 billion bushels), the United States is expected to reclaim the role of leading global soybean exporter that it lost to Brazil in 2012/13. A record harvested area of 84.1 million acres is expected to enhance U.S. price competitiveness and boost U.S. soybean exports to a record 45.6 million metric tons (mmt). U.S. soybean meal and oil exports are also expected to increase, with soybean meal shipments abroad forecast to edge up to 10.66 mmt in 2014/15 from 10.57 mmt this year, and soybean oil exports could reach 0.95 mmt, up from 0.77 mmt in 2013/14. If achieved, the plentiful US supplies will drive farm prices lower. USDA forecasts the U.S. average farm price for soybeans in 2014/15 to fall within a range of $9.50-11.50 per bushel, down from an estimated $13.00 per bushel in 2013/14. The last time the U.S. farm price for soybeans averaged below $12.00 per bushel for a crop year was in 2010/11 when it reached $11.30 per bushel, a record at the time. Find this chart in the Oil Crops Chart Gallery, with additional analysis in the Oil Crops Outlook: July 2014.
Wednesday, July 9, 2014
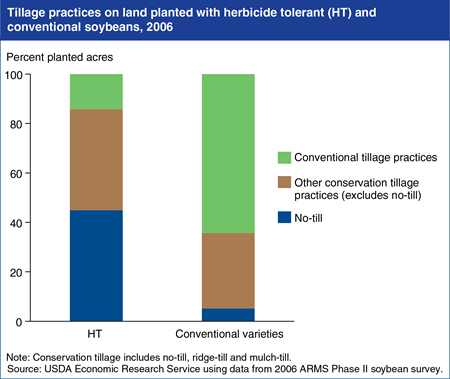
By leaving at least 30 percent of crop residue covering the soil surface after all tillage and planting operations, conservation tillage (including no-till, ridge-till, and mulch-till) reduces soil erosion, increases water retention, and reduces soil degradation and water/chemical runoff. Conservation tillage also reduces the carbon footprint of agriculture. By 2006, approximately 86 percent of land planted with herbicide tolerant (HT) soybeans was under conservation tillage, compared to only 36 percent of conventional soybean acres. Differences in the use of no-till were just as pronounced. While approximately 45 percent of HT soybean acres were cultivated using no-till technologies in 2006, only 5 percent of the acres planted with conventional seeds were cultivated using no-till techniques, which are often considered the most effective of all conservation tillage systems. Cotton and corn data exhibit similar, though less pronounced, patterns. This chart is found in “Adoption of Genetically Engineered Crops by U.S. Farmers Has Increased Steadily for Over 15 Years” in the March 2014 Amber Waves online magazine.
Friday, June 27, 2014
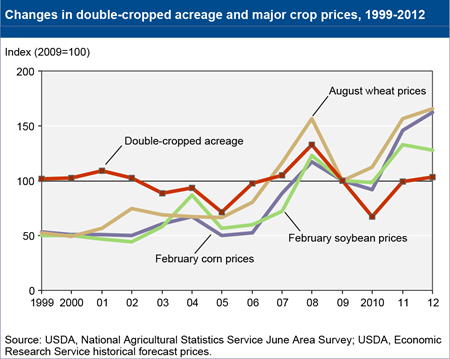
Double-cropped acreage has varied from year to year. Because decisions about double cropping are made annually, fluctuations are likely as farmers respond to changing market and weather conditions. For example, higher commodity prices give farmers more incentive to intensify production and could offset revenue shortfalls from lower potential yields when double cropping. From 2004 to 2012, total double-cropped acreage roughly paralleled soybean, winter wheat, and corn prices. When commodity prices at the time of planting decisions were increasing or relatively high, total double-cropped acreage also increased. Total double-cropped acreage peaked at 10.9 million acres in 2008, when prices for soybeans, winter wheat, and corn also peaked. In 2005 and 2010, nearly every region witnessed declines in double-cropped acreage amid commodity price declines. This chart is found in the ERS report, Multi-Cropping Practices: Recent Trends in Double-Cropping, EIB-125, May 2014.
Wednesday, June 25, 2014
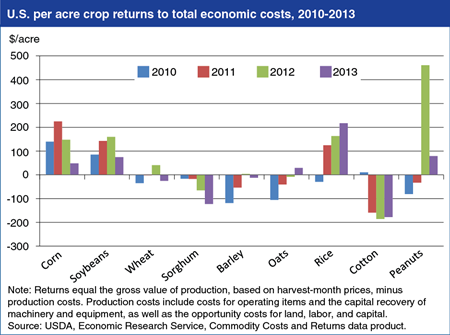
Estimates of U.S. crop returns per acre reveal large differences in crop profitability across commodities and over time during 2010-13. Returns to crop production are defined as the gross value of production less total economic costs. Total economic costs include operating costs such as seeds, fertilizer, and pesticides; the capital recovery cost for machinery and equipment; and the costs—known as opportunity costs—of employing land, labor, capital and other owned resources that have alternative uses. While returns to total economic costs for corn, soybeans, rice, and peanuts were positive, on average, for the 2010-13 period, average returns for other major crops were negative. For most crops, changes in farm prices and the gross value of production per acre, rather than changes in production costs, have driven returns to total economic costs. Lower prices contributed to reduced returns for corn, soybeans, wheat, sorghum, and peanuts in 2013, while price and yield increases improved returns for oats and rice. The negative returns over total economic costs for some crops indicate that that those producers realized a lower rate of return to their land, labor, and capital than the benchmark rates of return used in ERS commodity cost and returns accounts; returns over operating costs alone were positive for all crops throughout the period. This chart is based on data found in Commodity Costs and Returns.
Monday, May 19, 2014
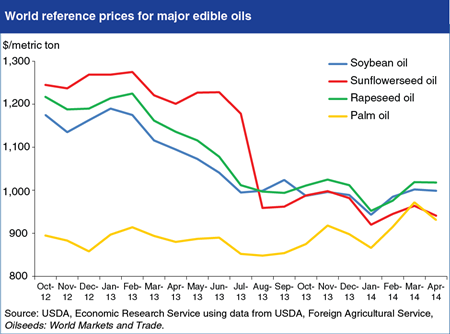
Palm oil accounts for the largest share of global edible oil trade and is typically the lowest priced of the major edible oils, accounting for a large share of purchases by developing importing countries such as India and China. Since late 2013, however, edible oil prices have converged, triggering substitution of other major oils for palm oil by importers and creating opportunities for the United States and other major soybean oil exporters. In India, the world’s largest importer of edible oils, imports of competing oils have expanded as their price gap with palm oil has narrowed. Prices for palm oil delivered to Mumbai are currently $35-$75 per metric ton cheaper than soybean oil and sunflowerseed oil, down from $200-$300 a year ago. Reduced shipments by Indonesia and Malaysia, the 2 major palm oil exporters, are largely responsible for higher palm oil prices. Indonesia’s supplies are being siphoned off by higher blend requirements for domestic biodiesel consumption. In Malaysia, palm oil output has stagnated while domestic use has strengthened, leading to a decline in palm oil stocks. Find additional analysis in Oil Crops Outlook: April 2014.
Wednesday, April 2, 2014
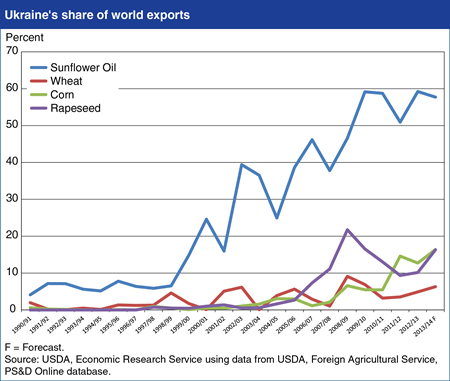
Over the last 15 years, Ukraine has emerged as a major supplier to world markets for several agricultural commodities, including wheat, corn, sunflower oil, and rapeseed. Wheat is a traditional export, with annual shipments varying with crop size. For 2013/14 (July/June marketing year), Ukraine’s wheat exports are forecast at 10 million tons, or about 6 percent of world wheat trade. During the last decade, Ukraine’s corn production and exports have expanded, with 2013/14 (October/September) exports forecast at 18.5 million tons, making Ukraine the world’s third-largest corn exporter. Robust production growth is also behind Ukraine’s emergence as the world’s dominant supplier of sunflowerseed oil, with 2013/14 (September/August) exports forecast at nearly 4.1 million tons, or about 57 percent of global trade. Ukraine has also become a significant exporter of rapeseed, with 2013/14 (July/June) exports forecast at about 2.2 million tons, or 16 percent of world trade. Despite recent political developments in Ukraine, so far there is no evidence of significant shipping disruptions that might alter the 2013/14 Ukraine export forecasts. Find additional analysis Wheat Outlook: March 2014, Feed Outlook: March 2014, and Oil Crops Outlook: March 2014.
Thursday, January 30, 2014
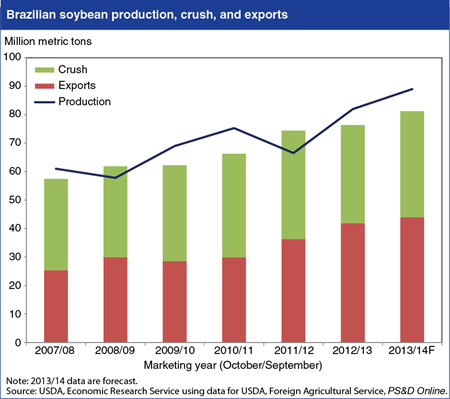
Although robust demand has recently supported soybean prices, the 2013/14 (October/September) soybean market outlook now hinges on the impending large crop forecast in Brazil, the world’s second-largest producer after the United States. The Brazilian forecast indicates a widening gap between soybean production and total use (crush plus exports), which may signal lower prices ahead. High prices are contributing to increased soybean area in Brazil, leading USDA to raise its 2013/14 soybean production forecast for Brazil to 89 million metric tons. The new forecast is up 1 million tons from the previous forecast, is well above last year’s record crop of 82 million, and is nearly equal to this year’s U.S. harvest of 89.5 million. Although abundant rainfall has created favorable growing conditions for Brazil’s 2013/14 soybean crop, the yield forecast is unchanged this month, with another 8-10 weeks of good weather needed if yields are to match or surpass the country’s 2010/11 yield record. While part of the increase in Brazilian supplies is expected to boost the country’s 2013/14 soybean crush and exports, the current outlook indicates a substantial increase in stocks. This chart can be found in the Oil Crops Chart Gallery, with supporting analysis in Oil Crops Outlook: January 2014.
Friday, January 24, 2014
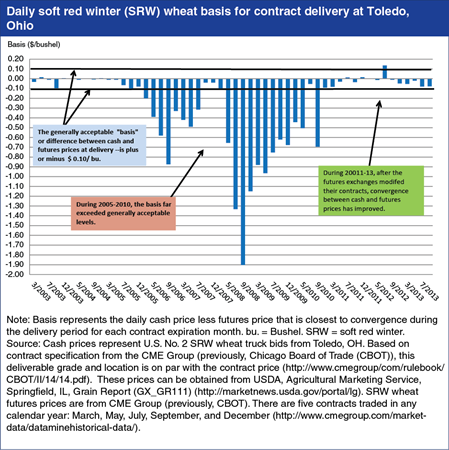
Futures markets play an important role in price discovery (determination of prices through the interaction of market supply and demand) for major agricultural commodities, and provide a tool for growers, traders, and processors to mitigate risk. For futures markets to perform these functions effectively, the price of a commodity held in a futures contract must match (or “converge”) with its price in the cash—or spot—market when the futures contract expires. During 2005-2011, cash and futures prices for soft red winter (SRW) wheat failed to converge to the generally acceptable “basis”—or difference between the cash price and futures price—of plus or minus $0.10/bushel. At times the basis exceeded $1.00/bushel. In response, the futures exchanges modified their SRW contracts to better align contract terms with changes occurring in cash markets for factors including storage rates, major delivery locations for SRW, and quality specifications. Following these changes, cash and futures market prices for SRW have moved closer together, improving the effectiveness of futures contracts in determining prices and as a tool to manage risk. This chart is based on Recent Convergence Performance of Futures and Cash Prices for Corn, Soybeans, and Wheat, FDS-13L-01, released December 30, 2013.
Monday, December 2, 2013
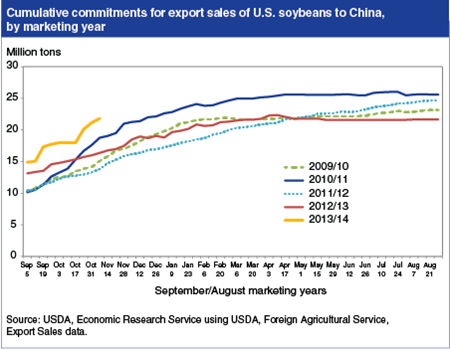
USDA has raised the 2013/14 (September/August marketing year) U.S. soybean export forecast to 39.5 million tons based on improved U.S. supplies and robust early season export sales commitments. As of October 31, 2013 U.S. export sales of soybeans already totaled 32.2 million tons—a record high for that date. Brisk sales to China are the main contributor to the strong pace, accounting for 71 percent of cumulative export inspections during September-October. Just over 2 months into the new marketing year, soybean sales commitments to China are already 98 percent of all sales during 2012/13. Importers are shifting their purchases toward U.S. soybeans as export shipments from Brazil and Argentina are in a seasonal decline, and U.S. Gulf soybean prices are comparatively cheaper than Brazil’s. Early season export sales of U.S. soybean meal are also unprecedentedly high because of declining shipments from South American and Indian processors, strengthening crush demand by domestic processors. This chart can be found in the Oil Crops Chart Gallery, with accompanying analysis in Oil Crops Outlook: November 2013.
Monday, September 30, 2013
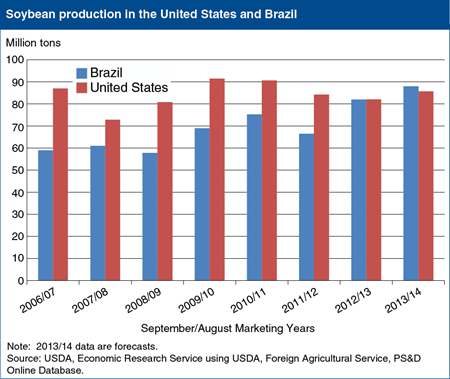
Brazil is forecast to surpass the United States as the world’s largest soybean producer for the first time in 2013/14 (September/August), the result of dry U.S. weather and prospects for continued price-driven expansion in Brazilian plantings. For 2013/14, U.S. soybean yields are now forecast at 41.2 bushels/acre, down from the previous forecast of 42.6 bushels but still above the 2012/13 drought-damaged yield of 39.6 bushels. Dry weather in the U.S. Midwest during August led USDA to cut soybean yield forecasts for 13 States, with the largest reductions in Missouri, Iowa, North Dakota, and Minnesota. The dimmer outlook for U.S. production has increased global soybean prices, making soybeans even more price-competitive with other crop alternatives. In Brazil, prices faced by producers have also been reinforced by currency depreciation versus the U.S. dollar, with Brazil’s real falling 17 percent against the dollar since April 2013. Brazil’s farmers will soon begin planting the 2013/14 soybean crop, with funds on hand from last year’s bumper harvests and facing attractive prices. Brazil’s 2013/14 soybean area is forecast to rise 4 percent to 28.9 million hectares, with production growing to a record 88 million tons—up 6 million from the 2012/13 crop of 82 million tons. This chart can be found in the Oil Crops Chart Gallery with analysis in the Oil Crops Outlook: September 2013.
Wednesday, September 4, 2013
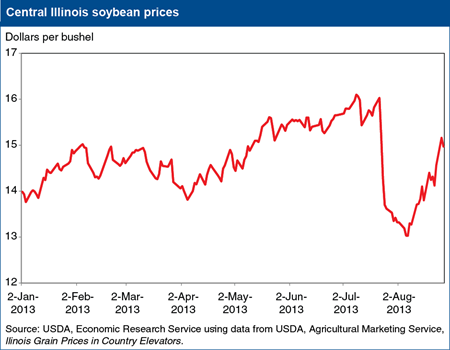
Last month, U.S. cash prices for soybeans fell under the pressure of a new-crop outlook that is much improved over last year, combined with prospects for increased competition in export markets for soybeans and products because of abundant unused stocks in South America. The market’s transition also encouraged farmers to sell more of their last few stocks of old-crop soybeans, which added to the downward price momentum. In early July, cash prices at central Illinois country elevators were near $16 per bushel but were just over $13 by early August. But prices have now rebounded since USDA’s August 12 crop production report, which included a soybean yield forecast that was below market expectations. At $10.35-$12.35 per bushel, USDA’s forecast range for the 2013/14 average farm price is well below this year’s average of $14.40 per bushel. Cash prices for soybean meal and soybean oil are also lower. From its mid-July peak, central Illinois soybean meal prices dropped about $150 per short ton by early August to around $425 per short ton. Likewise, soybean oil prices in early July were close to 47 cents per pound but currently hover just over 41 cents per pound. This chart appears in the Oil Crops Chart Gallery.
Monday, July 15, 2013
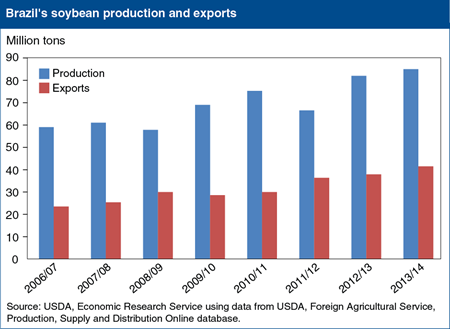
Although the USDA estimate of Brazil’s record 2012/13 soybean crop has been lowered to 82 million tons, strong expansion of Brazil’s soybean exports is forecast for 2012/13 and 2013/14. Brazil’s soybean exports are forecast to surpass those of the United States in both 2012/13 and 2013/14, making Brazil the world’s largest soybean exporter in both years. Despite lower yield expectations for the 2012/13 crop, export prospects have improved as extended weekday operations at major ports have trimmed a backlog of soybean exports. As a result of the enhanced capacity, soybean exports for the country set a monthly record in May at 7.95 million tons and more large monthly shipments are expected to follow. USDA forecasts Brazil’s 2012/13 soybean exports at a record 37.9 million tons and 2013/14 exports at another record of 41.5 million tons. This chart is adapted from one found in the Oil Crops Chart Gallery.
Tuesday, June 11, 2013
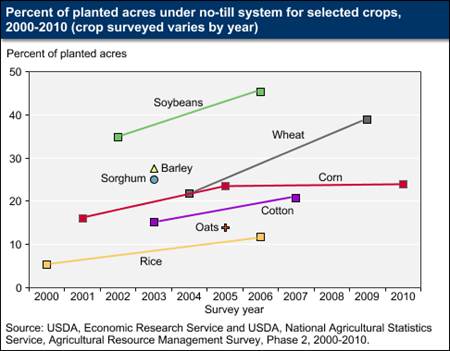
Farmers have choices for how they prepare the soil; reduce weed growth; incorporate fertilizer, manure and organic matter into the soil; and seed their crops, including the number of tillage operations and tillage depth. Tillage practices affect soil carbon, water pollution, and farmers’ energy and pesticide use. No-till is generally the least intensive form of tillage. Approximately 35 percent of U.S. cropland (88 million acres) planted to eight major crops had no-till operations in 2009, according to ERS researchers who estimated tillage trends based on 2000-07 data from USDA’s Agricultural Resource Management Survey (ARMS). Furthermore, the use of no-till increased over time for corn, cotton, soybeans, rice and wheat, the crops for which the ARMS data were sufficient to calculate a trend. While a more recent estimate of nationwide use of no-till by all major crop producers is not available, based on the results of recent surveys of wheat producers in 2009 and corn producers in 2010, it seems likely that no-till’s use continues to spread, albeit at a much reduced pace among corn producers. This chart is found on the ERS topic page, Soil Tillage and Crop Rotation, and in the ERS report, Agriculture’s Supply and Demand for Energy and Energy Products, EIB-112, May 2013.


