ERS Charts of Note
Subscribe to get highlights from our current and past research, Monday through Friday, or see our privacy policy.
Get the latest charts via email, or on our mobile app for  and
and 
Wednesday, November 19, 2014
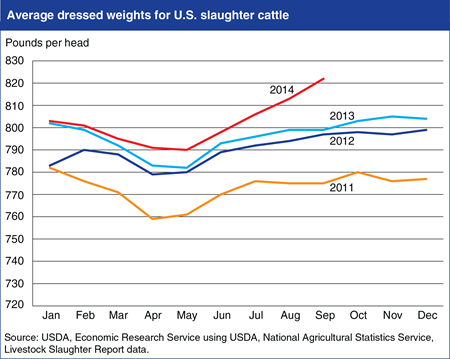
The average weight of cattle slaughtered in the United States is increasing in 2014, as rising prices for cattle and beef, coupled with declining feed costs, have induced growers to feed cattle for longer periods. The average dressed weight—the weight of the carcass minus feet, head, hide, and organs—of U.S. slaughtered cattle has been increasing in recent years, but rose sharply from 799 lbs/head to 822 lbs/head between September 2013 and September 2014. U.S. cattle and beef prices have set a number of successive record highs since mid-2013 because of declining cattle inventories resulting from drought-degraded pasture and forage conditions during 2010-12. With improved weather, cow-calf operators appear to be rebuilding herds by retaining heifers for breeding, adding upward pressure to cattle prices. Lower feed prices resulting from record U.S. corn and soybean crops are creating incentives to feed animals to higher weights. Also, as a direct result of placing fewer heifers in feed lots, there is a larger proportion of steers—which typically weigh more than heifers—in the slaughter mix, contributing to heavier average weights. Find additional analysis in Livestock, Dairy, and Poultry Outlook: November 2014.
Friday, November 7, 2014
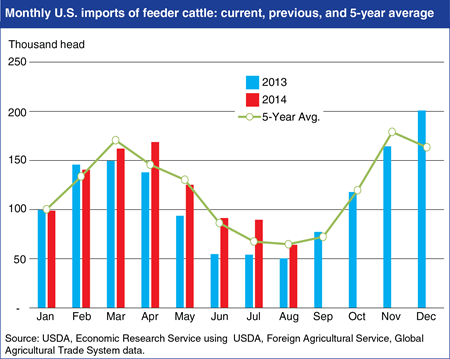
U.S. cattle imports have increased from both Canada and Mexico in 2014, totaling 1.413 million head through August. Imports are up 14 percent from Mexico and 12 percent from Canada due to stronger U.S. demand for feeder cattle. U.S producers are seeking to rebuild animal inventories reduced by several years of dry weather and take advantage of the low U.S. feed prices stemming from record 2014 U.S. corn and soybean harvests. U.S. feeder cattle demand is reflected in the sharp increase in the average price for Nebraska feeder steers (7-8 hundredweight [cwt]) from $149.45/cwt during the first three quarters of 2013 to $205.57/cwt during the same period of 2014. Imports over the summer months, typically the slowest season, were well above last year’s levels, and there are indications that increased shipments continued into September 2014. U.S. cattle imports are now forecast at 2.200 million head in 2014 and 2.225 million head in 2015. Although both Canada and Mexico have relatively low cattle inventories, strong U.S. prices are expected to continue to pull cattle across the border. Find this chart and additional analysis in Livestock, Dairy, and Poultry Outlook: October 2014.
Tuesday, September 16, 2014
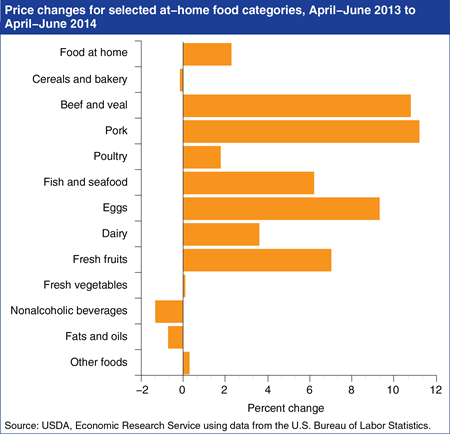
Retail food-at-home prices in the second quarter of 2014 were 2.3 percent higher than a year ago, as most at-home food categories increased in price. Retail beef and veal prices were up 10.8 percent as the supply of beef is strained by historically low herd sizes. Over the same time period, pork prices increased 11.2 percent, partially the result of the Porcine Epidemic Diarrhea virus, which has reduced litter sizes and increased piglet mortality. Egg prices are also up, in part due to increasing exports and a strong domestic demand for eggs and egg products. The increases in beef and veal, pork, and egg prices are the largest year-over-year increases since the fourth quarter of 2011. This chart appears in the Food Prices and Spending section of ERS’s Ag and Food Statistics: Charting the Essentials data product, updated September 10, 2014. More information on ERS’s food price forecasts can also be found in ERS’s Food Price Outlook data product.
Tuesday, September 2, 2014
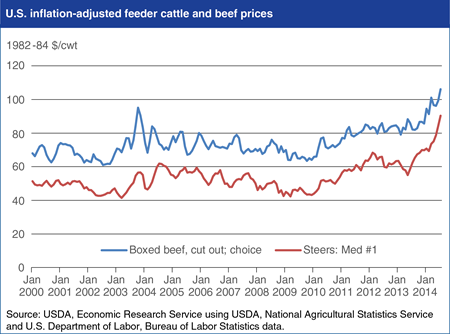
U.S. cattle and beef prices have moved into record territory since mid-2013, primarily due to drought impacts on U.S. cattle inventories. In addition to the widespread U.S. drought in 2012, drought conditions have affected important U.S. cattle raising regions, particularly in the Plains and Southwest, since 2010. The dry weather degraded pasture conditions and forage supplies, leading cow-calf operators to liquidate herds. Increases in U.S. imports of feeder cattle from Mexico and Canada have been insufficient to maintain or build U.S. inventories, in part because Mexican producers are trying to build their herds to supply more beef to the U.S. market. U.S. feed and forage supplies have improved in 2014, but herd rebuilding, as indicated by retention of heifers for breeding, is progressing slowly because some growers are selling animals while prices are high, rather than retaining them for herd rebuilding. Reduced beef supplies and high prices have led to an estimated 5 percent decline in U.S. per capita beef disappearance (a measure of consumption), as well as a sharp reduction in U.S. net beef exports, between 2011 and 2014. Find additional analysis in Livestock, Dairy, and Poultry Outlook: August 2014.
Tuesday, May 27, 2014
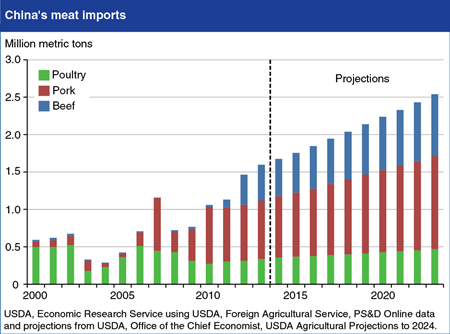
While USDA projects robust increases in China’s meat production and imports of feed grains, China’s meat imports are also projected to rise. Pork imports are projected to show the most growth, rising from about 750,000 tons in 2013 to 1.2 million tons by 2023. The United States, Canada, and European Union are the main suppliers of pork to China. China’s meat consumption is expected to expand at a pace similar to the trend of the past decade. Pork will continue to play a central role in China’s meat economy (China accounts for half of world production and consumption), however, poultry is gaining in popularity, largely because it is cheaper than pork. Restaurants, fast food chains, and cafeterias play a key role in diversifying meat consumption, since many feature specific kinds of meat or chicken. Beef and mutton are important parts of popular ethnic cuisines becoming popular among the broader population. Although China is expected to continue producing most of its own meat, China’s livestock sector is under pressure from rising costs, disease, environmental regulations, and resource constraints, which could lead to China’s meat imports rising even further if production cannot sustain its current pace of growth. Find this chart and more analysis in the April Amber Waves feature article "China in the Next Decade: Rising Meat Demand and Growing Imports of Feed."
Monday, April 21, 2014
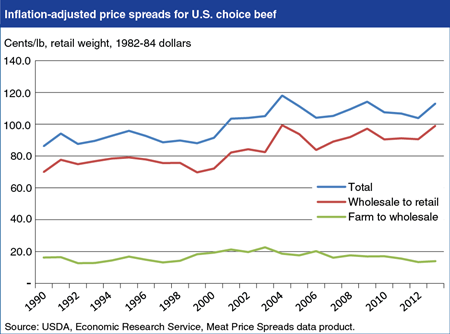
The spread between farm prices and retail prices of U.S. choice beef has been rising in real terms since 2000 because of an increasing spread between wholesale and retail prices. The spread between wholesale and retail choice beef prices averaged 75.5 cents/lb during the 1990s, but averaged 93.7 cents/lb during 2009-13. The ERS price spread calculations standardize the farm, wholesale, and retail product values over time, so the expanding wholesale-to-retail spread suggests rising costs in that segment of the supply chain, rather than changes in product mix or quality at each price point. In contrast, the farm-to-wholesale price spread has tended to decline slightly since 2000. These trends in price spreads may arise from differences in cost inflation in key inputs in the farm-to-wholesale and wholesale-to-retail segments of the supply chain, differences in productivity growth in each segment, and changes in the degree of market competition in each segment. This chart is based on data from the Meat Price Spreads data product.
Thursday, April 17, 2014
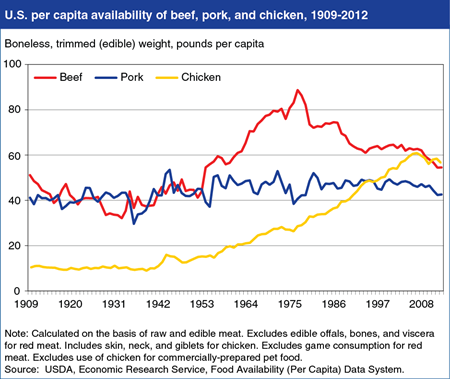
According to ERS's 2012 food availability data, the per capita supply of chicken available to eat in the United States continues to outpace that of beef. In 2012, 56.6 pounds of chicken per person on a boneless, edible basis were available for Americans to eat, compared to 54.5 pounds of beef. Although down from its peak of 60.9 pounds per person in 2006, chicken availability has been higher than that of beef for the past three years. Chicken began its upward climb in the 1940s, overtaking pork in 1996 as the second-most-consumed meat and overtaking beef for the No. 1 spot in 2010. Pork availability, which fluctuated between 49.9 and 46.6 pounds per person over the 1981 to 2009 period, dropped to 42.6 pounds per person in 2012. This chart is from the Summary Findings in ERS’s data product, the Food Availability (Per Capita) Data System.
Thursday, November 7, 2013
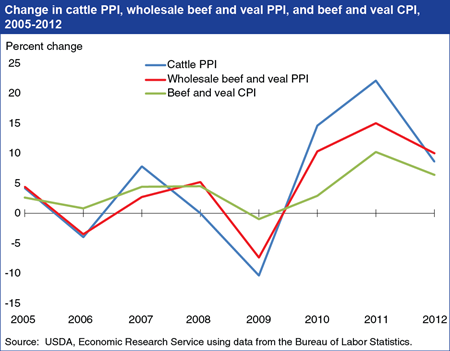
Meat prices were expected to rise sharply in the wake of the 2012 drought, but this has not been the case. Higher feed prices, due in part to the 2012 drought, prompted ranchers to reduce herd sizes and send more animals to slaughterhouses than usual. This influx of livestock caused cattle prices, and in turn wholesale beef and veal prices, to increase less in 2012 than in 2011, as measured by the Bureau of Labor Statistics’ Producer Price Index (PPI). In 2012, the cattle PPI and wholesale beef and veal PPI increased by 8.6 and 10 percent, respectively, below the increases of 22.1 and 15 percent in 2011. While retail prices, as measured by the Consumer Price Index (CPI), track changes in the PPI, the swings are typically smaller. The beef and veal CPI rose by 6.4 percent in 2012 versus 10.2 percent in 2011. More information on food prices can be found in ERS’s Food Price Outlook data product, updated November 5, 2013.
Wednesday, May 22, 2013
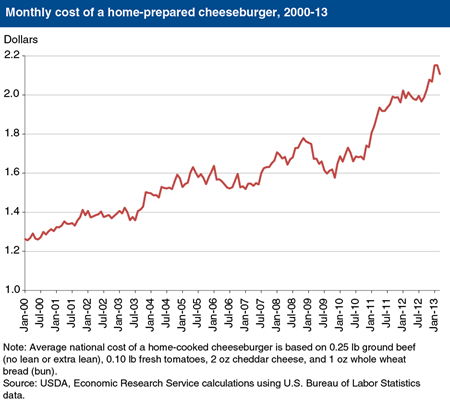
Memorial Day weekend kicks off the barbecue season for many Americans, and a grilled burger topped with cheese is a holiday staple. Using price data from the U.S. Bureau of Labor Statistics, ERS calculated the average national cost of a home-cooked cheeseburger. The cost was found to vary seasonally, usually decreasing in February, May, and June while reaching annual peaks in November or December. Most of the seasonal variation is due to the changes in beef prices. The April 2013 cost of $2.07 for a home-prepared cheeseburger is up 61 percent since 2000, while overall food-at-home prices have increased 41 percent in that time. Much of that difference is due to the strong beef price inflation of recent years resulting from low cattle inventories and high feed prices. More information on food price changes and forecasts can be found in ERS’s Food Price Outlook data product.
Thursday, April 4, 2013
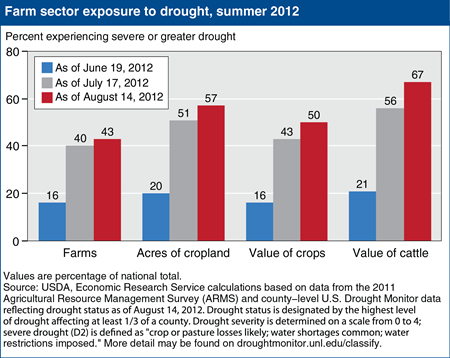
As of mid-August 2012, 43 percent of farms in the United States were experiencing severe or greater levels of drought and another 17 percent were facing moderate levels of drought (for a description of severity levels, see droughtmonitor.unl.edu/classify). A striking aspect of the 2012 drought was how the drought rapidly increased in severity in early July, during a critical time of crop development for corn and other commodities. The chart shows the progression from mid-June to mid-August of severe or greater drought within the agricultural sector. While drought conditions eased some during early September, for most crop production, exposure to drought during June-August determined the drought’s impact on agricultural production. From mid-June to mid-August, the share of farms under severe or greater drought increased from 16 to 43 percent of all farms. Total cropland under severe or greater drought increased from 20 to 57 percent, while total value of crops exposed increased from 16 to 50 percent. As of mid-July, areas with over half of the value of cattle production were already exposed to severe drought; by mid-August, almost two-thirds were exposed. This chart is based on the table found in U.S. Drought 2012: Farm and Food Impacts on the ERS website, updated March 2013.
Monday, April 1, 2013
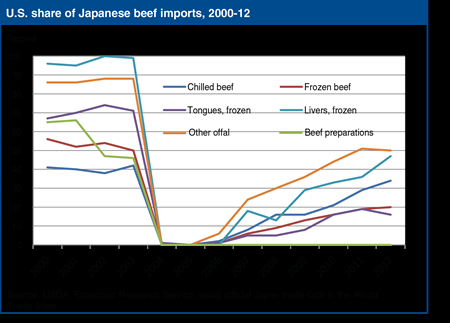
Effective February 1, 2013, Japan has permitted imports of beef from all U.S. cattle less than 30 months of age, a decision that removes most of the restrictions imposed on imports of U.S. beef at the end of 2003. In late 2003, Japan banned U.S. beef in reaction to the discovery of bovine spongiform encephalopathy (BSE) in the United States. In 2005, Japan reopened its market to U.S. beef imports from cattle slaughtered at less than 21 months of age. However, U.S. beef exports to Japan, as well as Japanese beef consumption, have not recovered to the levels they reached in 2003 and earlier. The latest action is expected to lead to a further rebound in the volume of U.S. beef and byproducts exported to Japan; to allow somewhat lower prices in Japan for U.S. beef; and to raise the value of beef carcasses in the United States. This chart appears in Japan Announces New Rules for Imports of U.S. Beef.
Friday, March 8, 2013
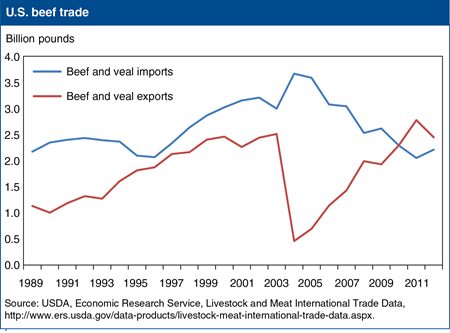
The United States exported 2.45 billion pounds of beef in 2012 (in carcass weight equivalents), 12 percent below the record 2.78 billion pounds exported in 2011. The decline interrupted the steady recovery of U.S. beef exports after the discovery of a U.S. case of bovine spongiform encephalopathy (BSE) in 2003 led to a sharp drop in U.S. shipments. While global export demand for U.S. beef remained robust, the decline in 2012 occurred primarily because tightening domestic cattle inventories reduced exportable supplies. U.S. beef imports have trended downward since 2003, when Canada reported the discovery of BSE. Canadian beef imports resumed quickly thereafter on a restricted basis, but imports from Australia and New Zealand were limited in subsequent years by tight supplies and domestic herd rebuilding. In 2012, U.S. beef imports were 8 percent higher, driven by tightening U.S. supplies and strong demand. Increased U.S. imports were mostly from Oceania, as herd rebuilding in the region allowed more beef to be exported to the United States. This chart appears on the ERS Cattle and Beef topic page.
Tuesday, February 19, 2013
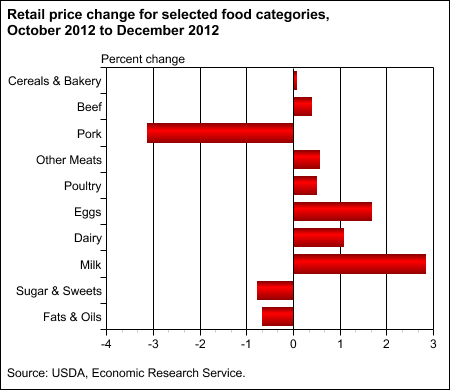
In the final three months of 2012, higher field corn prices resulting from the Midwest drought began to show up on supermarket shelves. From October to December, while the all-items CPI fell 0.8 percent and overall food-at-home prices increased only 0.2 percent, prices rose for most foods that rely heavily on corn-based animal feed—beef, pork, poultry, other meats, eggs, and dairy products. Milk prices rose nearly 3 percent while egg prices increased 1.7 percent. Prices for beef, poultry, and other meats all rose by about 0.5 percent. The only animal-based category defying this trend is pork, where rising inventories and falling exports have caused retail prices to drop from historically high levels in early 2012. ERS forecasts prices for all meat and animal-based products to increase steadily through the first half of 2013. More information on food price changes and forecasts can be found in the Food Price Outlook data product, updated January 2013.
Wednesday, January 30, 2013
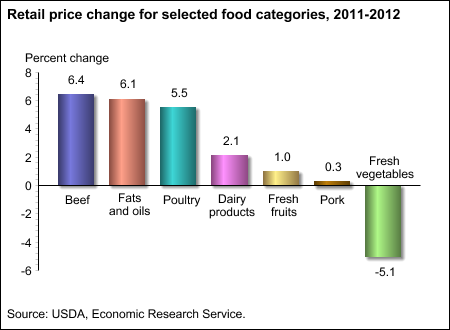
Overall food-at-home prices rose 2.6 percent in 2012, but this masked a great deal of variation across food categories. For the second consecutive year, beef and fats and oils showed the biggest percentage increases. Beef prices increased due to record low cattle inventories, while surging soybean prices pushed up prices for fats and oils. Poultry prices also increased substantially in 2012, due to a shift in demand away from high-priced beef and pork coupled with higher costs for broiler feed resulting from the Midwest drought. Pork prices, which saw major inflation in 2011, were flat in 2012 as wholesale prices fell due to rising hog inventories and falling exports. Vegetable prices fell 5.1 percent in 2012 as the unusually warm weather led to bumper crops for lettuce, tomatoes, and other vegetables, in sharp contrast to the poor harvests and high vegetable prices of 2011. More information on food price changes and forecasts can be found in the Food Price Outlook data product, updated January 24, 2013.
Thursday, November 29, 2012
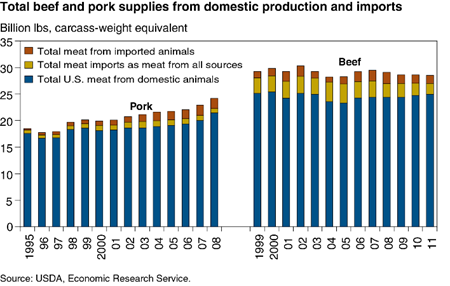
While it is relatively easy to track U.S. meat and livestock imports, it is more difficult to estimate the amount of meat produced in the United States from animals that originated abroad. Foreign-born cattle accounted for an average of 8.1 percent of total monthly U.S. beef production over the last 13 years. When that amount is added to the annual average of 2.9 billion pounds of beef and veal imported from all foreign sources, almost 16 percent of annual U.S. beef and veal supplies is estimated to originate abroad. From 1995 through 2008, Canadian hogs contributed about 93 million pounds per year to U.S. pork supplies. When this amount is combined with the 895 million pounds of pork imported by the U.S. each year, foreign sources are estimated to account for about 8.4 percent of total U.S. pork supplies. This chart appears in "How Much U.S. Meat Comes From Foreign Sources?" in the September 2012 issue of ERS's Amber Waves magazine.
Friday, November 9, 2012
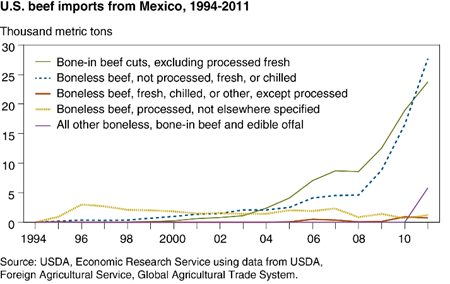
Mexico has historically been a top export market for U.S. beef, but in 2003, it emerged as an important source of beef imports for the United States. In 2011, Mexico exported 59,000 metric tons of beef to the U.S., making it the fourth largest source of U.S. beef imports. The volume of boneless, fresh, or frozen meat cuts exported from Mexico to the U.S. increased by nearly 68 percent from 2010 to 2011, while the volume of exports of Mexican bone-in beef cuts increased by nearly 59 percent. The increase in exports of Mexican beef to the U.S. is partly due to an increase in the number of TIF (Tipo Inspeccion Federal) plants inspected by Mexico's Federal Government. Such plants must meet standards similar to those in the U.S. and must inspect meat that is moved across State borders in Mexico or exported to the U.S. In the last 60 years, the number of operational TIF establishments increased from 15 to 365 across 27 States in Mexico and has grown rapidly in the last few years. This chart appears in "Mexico Emerges as an Exporter of Beef to the United States" in the September 2012 issue of ERS's Amber Waves magazine.
Friday, September 21, 2012
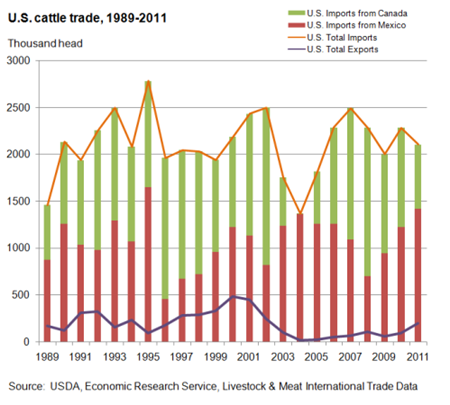
The United States imports significantly greater numbers of cattle than it exports. U.S. cattle imports contribute an estimated monthly average of 8.1 percent of production to the U.S. beef supply. Because of concerns with animal health issues in originating countries, the United States restricts cattle imports from most countries. Cattle imports to the United States originate, almost exclusively, from Mexico and Canada because of these countries geographic proximity to U.S. markets and the complementarity of their cattle and beef sectors to that of the United States. Cattle imported from Mexico tend to be lighter-weight cattle intended for U.S. stocker or feeder operations, while at least three-fourths of cattle imports from Canada are destined for immediate slaughter. Cattle imports from Mexico have increased year-over-year since 2008, while imports from Canada have trended downward. Total cattle imports have also trended downward since 2007 due to a declining total North American cattle herd. The data for this chart come from ERS's Livestock and Meat International Trade Data.
Monday, February 27, 2012
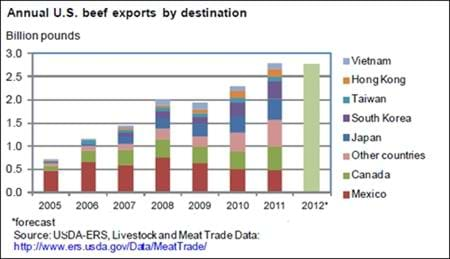
U.S. beef exports posted strong gains in 2011. Total beef exports were 2.79 billion pounds, 21 percent higher than the previous year's total. The strongest gains were to Russia (up 85 percent) South Korea (37 percent), Japan (30 percent), Canada (27 percent), and Hong Kong (21 percent). Canada, Mexico, Japan, and Korea were the top four export destinations for U.S. beef. Together, these countries imported 65 percent of total U.S. beef exports. U.S. beef exports for 2012 are forecast to decline slightly, to 2.76 billion pounds. This chart is found in Livestock, Dairy, and Poultry Outlook, LDP-M-212, February 2012.
Tuesday, February 7, 2012
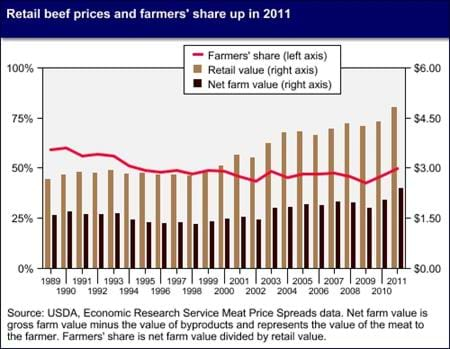
Retail prices for Choice beef and for all fresh beef set records in December 2011. For the fourth month in a row, the Choice price set a new nominal high, reaching $5.02/lb in December, and an annual average $4.83/lb for 2011. Farmers' share (net farm value divided by retail value) was 49.9% in 2011; the last time it was this high was in 1994 when it was 51%. The data for this chart are found in the ERS data product Meat Price Spreads, published January 19, 2012, on the ERS website.
Thursday, February 2, 2012
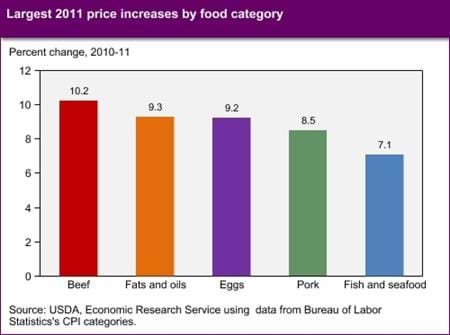
Grocery store food prices were up 4.8 percent in 2011, as food inflation picked up again for the first time since 2008. 2011's higher food-at-home price inflation reflected higher energy and commodity prices, combined with a weaker U.S. dollar that boosted international demand for U.S. foods. Specific food categories posted especially large increases: beef up 10.2 percent, fats and oils up 9.3 percent, and eggs up 9.2 percent. Beef prices were up in 2011 due to higher input costs, low inventories, and strong international demand. Drought conditions throughout the South contributed to higher 2011 egg prices, while the jump in prices for fats and oils was due in large part to surging soybean prices. More information on ERS's analysis and forecasts of food price inflation can be found in the Food Prices, Expenditures and Costs topic on the ERS website.


