ERS Charts of Note
Subscribe to get highlights from our current and past research, Monday through Friday, or see our privacy policy.
Get the latest charts via email, or on our mobile app for  and
and 
Friday, October 29, 2021
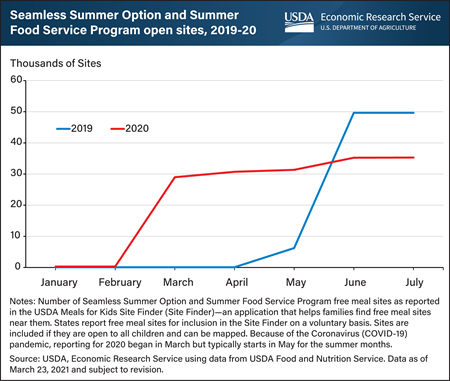
Beginning in March 2020, the Coronavirus (COVID-19) pandemic caused school and childcare provider closures, disrupting the distribution of meals through USDA’s largest child nutrition programs: The National School Lunch Program (NSLP), School Breakfast Program (SBP), and Child and Adult Care Food Program. In response, USDA expanded the scope and coverage of the NSLP’s and SBP’s Seamless Summer Option (SSO) and the Summer Food Service Program (SFSP). The SSO and SFSP typically provide meals to children and teens in low-income areas during unanticipated school closures between October and April or when schools are not in session, such as during summer break. USDA waived these requirements, allowing qualifying organizations to serve free meals to children and teens in all areas throughout the year. As a result, the number of free meal sites open to all children as reported by States grew rapidly in the early months of the pandemic. At least 28,987 sites were operating in March 2020, and at least 31,347 by May 2020, well above the 6,254 sites reported in May 2019. In June and July of 2020, the number of reported free meal sites open to all children was lower compared to the same months in 2019. Although fewer free meal sites were reported as operating, more children received meals through the SSO and SFSP during June and July of 2020 compared with the same months in the previous year. This chart is based on data presented in the USDA, Economic Research Service’s COVID-19 Working Paper: Filling the Pandemic Meal Gap: Disruptions to Child Nutrition Programs and Expansion of Free Meal Sites in the Early Months of the Pandemic, released October 12, 2021.
Friday, October 22, 2021
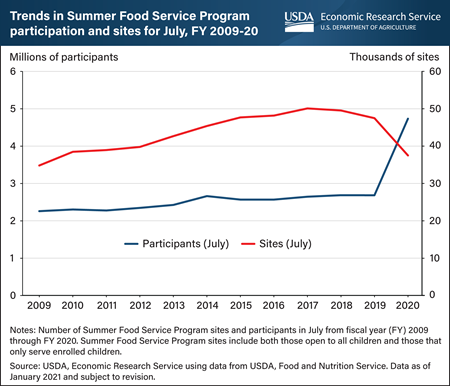
The USDA Summer Food Service Program (SFSP) typically provides free nutritious meals to children and teens in low-income areas through qualifying organizations during unanticipated school closures from October through April or when schools are not in session, such as during summer break. In response to school and childcare provider closures caused by the Coronavirus (COVID-19) pandemic, USDA expanded the scope and coverage of the SFSP by allowing qualifying organizations to serve free meals throughout the year and in all areas through the program. As a result, the program set a record in fiscal year 2020 for number of meals served. In July 2020, participation in the program reached a historical high of 4.7 million. However, the increase in participation was not matched by an increase in SFSP sites. The number of SFSP free meal sites, including sites open to all children and sites serving only enrolled children, had steadily increased over much of the last decade, peaking at 50,080 in July 2017 before declining to 47,471 by July 2019 and 37,498 in July 2020. This chart is based on a chart in the USDA, Economic Research Service’s COVID-19 Working Paper: Filling the Pandemic Meal Gap: Disruptions to Child Nutrition Programs and Expansion of Free Meal Sites in the Early Months of the Pandemic, released October 12, 2021.
Friday, October 8, 2021
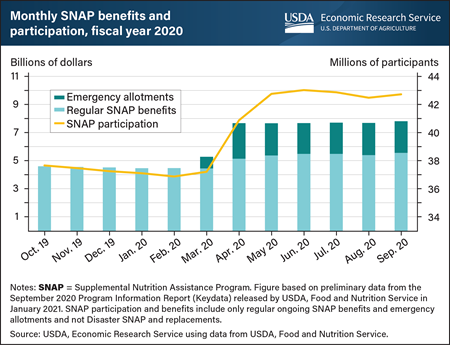
The Coronavirus (COVID-19) pandemic increased the need for U.S. nutrition assistance in fiscal year (FY) 2020. To help meet this need, States with emergency or disaster declarations related to COVID-19 were allowed several flexibilities in administering the USDA’s Supplemental Nutrition Assistance Program (SNAP), including the option to provide emergency allotments to supplement regular benefits. Regular SNAP benefits are provided monthly and vary based on household size, income, and expenses. In FY 2020, emergency allotments supplemented the benefits of SNAP households receiving less than the maximum benefit, effectively raising all participating households’ monthly benefit amount to the maximum allowed for their size. The first States began issuing emergency allotments in late March 2020, and almost all States issued emergency allotments monthly through the end of the fiscal year in September 2020. SNAP participation rose to an average 42.5 million people per month in the second half of FY 2020 (April to September 2020), a 14-percent increase from 37.3 million in the first half (October 2019 to March 2020). Total SNAP benefits jumped to an average $7.7 billion a month in the second half of FY 2020, up 66 percent from $4.6 billion a month in the first half. Emergency allotments accounted for 30 percent of total benefits in the second half of FY 2020, or $2.3 billion a month. Together, these changes caused average monthly benefits per person to increase from about $125 in the first half of FY 2020 to about $181 in the second. This chart is based on a chart in the USDA, Economic Research Service’s Food and Nutrition Assistance Landscape: Fiscal Year 2020 Annual Report, released August 24, 2021.
Wednesday, September 15, 2021
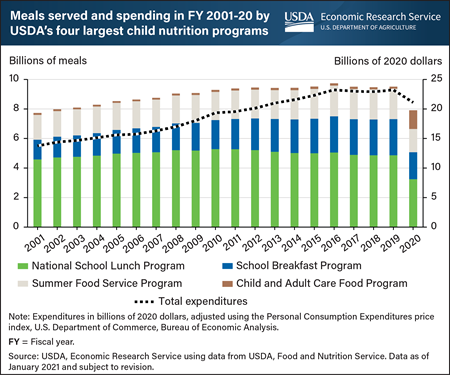
The USDA’s largest child nutrition programs—the National School Lunch Program (NSLP), School Breakfast Program (SBP), Child and Adult Care Food Program (CACFP), and Summer Food Service Program (SFSP)—served about 7.9 billion meals in fiscal year (FY) 2020, the lowest number of meals served since FY 2001. This was a 17 percent decline from the average of 9.5 billion meals served annually by the programs from FY 2015 through FY 2019. The decrease is primarily attributable to the Coronavirus (COVID-19) pandemic, which disrupted in-person attendance at schools and childcare providers—through which NSLP, SBP, and CACFP typically operate—nationwide beginning in March 2020. To help facilitate the continued provision of meals to children and adolescents during these disruptions, USDA issued waivers allowing for greater flexibility in the administration of the child nutrition programs and expanded the scope and coverage of its summer feeding programs, including SFSP. Despite the overall decline in meals served, the number of meals served through SFSP rose substantially in FY 2020. The SFSP’s share of total meals served increased to 16.0 percent in FY 2020 from 1.5 percent in FY 2019. Comparatively, NSLP’s share of meals shrank to 41.0 percent in FY 2020 from 51.2 percent in FY 2019. Though less drastic, SBP’s and CACFP’s share of all meals served also decreased, to 23.1 percent in FY 2020 from 25.8 percent in FY 2019 for SBP and 19.8 percent in FY 2020 from 21.6 percent in FY 2019 for CACFP. Because of disruptions and changes to the child nutrition landscape in FY 2020, total spending on all four programs amounted to $21.1 billion, down from average annual expenditures of $22.9 billion in the previous five fiscal years. This chart is based on a chart in the USDA, Economic Research Service’s The Food and Nutrition Assistance Landscape: Fiscal Year 2020 Annual Report.
Wednesday, August 25, 2021
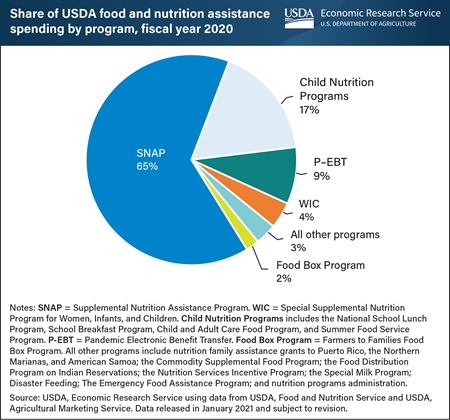
Total spending on USDA’s food and nutrition assistance programs increased 32 percent from $92.5 billion in fiscal year (FY) 2019 to $122.1 billion in FY 2020. The way spending was distributed reflects changes to the food assistance landscape in FY 2020 resulting from the Coronavirus (COVID-19) pandemic and subsequent economic downturn and Federal response. Spending on the Supplemental Nutrition Assistance Program (SNAP) increased because of greater participation and additional benefit issuance, accounting for 65 percent of total spending. Combined spending on the four largest child nutrition programs fell in FY 2020, as did spending on the Special Supplemental Nutrition Program for Women, Infants, and Children (WIC). Together these programs accounted for 21 percent of total spending. As part of the Federal response to the pandemic, two new assistance programs were created: Pandemic Electronic Benefit Transfer (P-EBT) and the Farmers to Families Food Box Program. In FY 2020, P-EBT benefits totaled $10.7 billion, and Food Box Program spending totaled $2.5 billion. Together, these two programs accounted for 11 percent of overall food and nutrition assistance spending. This chart is based on data available as of January 2021 that is subject to revision and on a chart in the USDA, Economic Research Service’s Food and Nutrition Assistance Landscape: Fiscal Year 2020 Annual Report, released August 24, 2021.
Friday, July 16, 2021
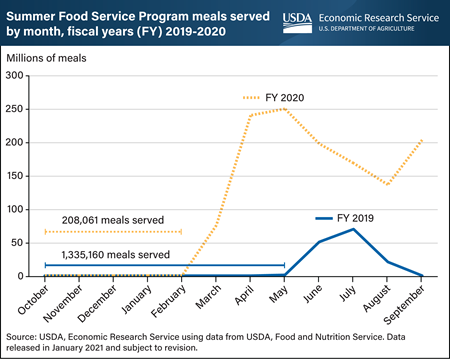
USDA’s Summer Food Service Program (SFSP) typically provides nutritious meals to children and teens in low-income areas during unanticipated school closures between October and April or when schools are not in session, such as during summer break. In fiscal year (FY) 2020, the program served a record number of nearly 1.3 billion meals to children and teens, 8.9 times more than in FY 2019. Whereas participation in the program typically peaks in July, the SFSP in 2020 provided the most meals in May and continued to serve more than 200 million meals in September. The Government spent $4.1 billion on the program in FY 2020, up from $475 million in FY 2019. This increase reflects the expanded need for food assistance during the Coronavirus (COVID-19) pandemic and the Federal response to meet that need. The closure of schools and childcare providers beginning in March 2020 disrupted the distribution of meals through what are typically the largest of USDA’s Child Nutrition Programs: the National School Lunch Program, the School Breakfast Program, and the Child and Adult Care Food Program. In response, USDA issued waivers expanding the scope and coverage of the SFSP by allowing qualifying organizations to serve free meals throughout the year and in all areas, among other changes. This chart is based on data available as of January 2021 that is subject to revision and made available on the USDA, Economic Research Service’s (ERS) Summer Food Service Program section of the Child Nutrition Programs topic page, updated July 2021.
Monday, June 7, 2021
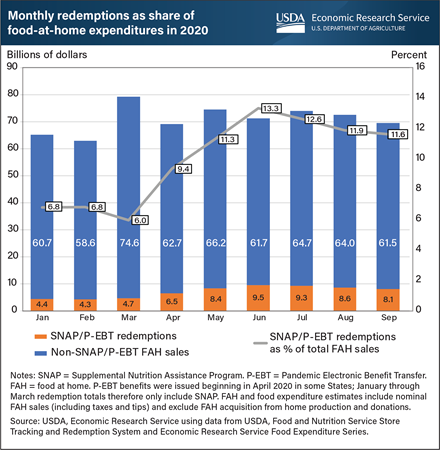
Shutdowns, stay-at-home orders, and the need for social distancing led households to buy more food for consumption at home during the Coronavirus (COVID-19) pandemic. In response to the economic downturn and pandemic conditions, supplemental emergency allotments were issued to Supplemental Nutrition Assistance Program (SNAP) households and Pandemic Electronic Benefit Transfer (P-EBT) benefits were distributed to households with children missing free and reduced-price school meals. This expansion of nutrition assistance led to a rapid increase in the dollar amount of these benefits issued to households and redeemed for food at home (FAH). In January and February 2020, SNAP benefit redemptions accounted for 6.8 percent of total FAH expenditures as estimated by the Food Expenditure Series. In March 2020, FAH spending spiked, causing SNAP’s share of FAH spending to fall. From March to June 2020, the introduction of P-EBT and increase in SNAP benefits led to rapid growth in these programs’ share of FAH spending. In June 2020, redemptions of these benefits peaked at $9.5 billion—making up 13.3 percent of FAH spending that month. This share fell the following three months. Overall, the share of total FAH spending attributable to SNAP and P-EBT from April through September 2020 was 11.7 percent—more than one in nine dollars and nearly 5 percentage points higher than SNAP’s share over the same months in 2019. This chart is based on a chart in the USDA, Economic Research Service’s COVID-19 Working Paper: Supplemental Nutrition Assistance Program and Pandemic Electronic Benefit Transfer Redemptions during the Coronavirus Pandemic, released March 2021.
Wednesday, April 28, 2021
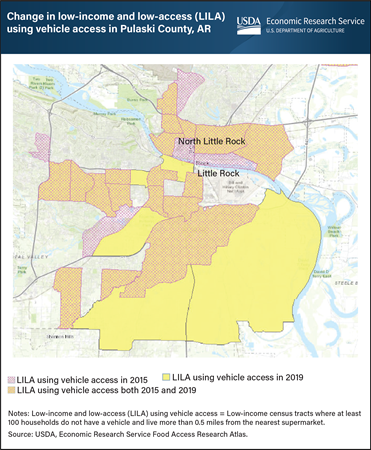
The USDA, Economic Research Service’s (ERS) Food Access Research Atlas provides a map of neighborhoods with limited access to nutritious, affordable food for the entire United States. Limited access to high-quality, low-cost food may impede some consumers from achieving a healthy diet. The updated Atlas allows users to map low-income and low-supermarket access census tracts for 2019 and compare the results with those for 2015. Individuals can choose to display one or several of the measures of low-supermarket access that are based on residents’ distances from the nearest supermarket (more than 0.5 or 1 mile in urban areas or more than 10 or 20 miles in rural areas) and whether a substantial number of households have access to a vehicle. One measure considers a tract to be low-income and low-access (LILA) if it is low-income and contains a substantial number of vehicle-less households that live more than 0.5 miles from the nearest supermarket. Using this measure, the number of low-income and low-access census tracts in Pulaski County, Arkansas, for example, rose 4 percent from 2015 to 2019. Twenty-three percent of Pulaski County households lived in these tracts in 2019, including 6 percent who lived more than 0.5 miles from a supermarket and did not have a vehicle. This map was created using ERS’s Food Access Research Atlas, updated April 27, 2021.
Friday, April 23, 2021
Errata: On June 3, 2022, the text and chart notes were revised to correctly identify the Special Supplemental Nutrition Program for Women, Infants, and Children (WIC).
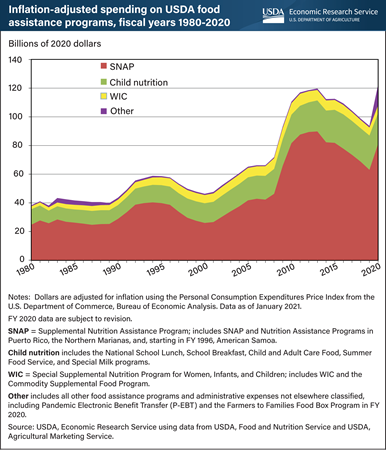
Spending on USDA’s food and nutrition assistance programs jumped 30 percent in fiscal year (FY) 2020 to an inflation-adjusted record of $122.1 billion, abruptly reversing a six-year decline. This increase reflects the expanded need for food assistance during the COVID-19 pandemic and the subsequent Federal response to meet that need. This response included USDA waivers allowing flexibility in the administration of the Department’s 15 existing food and nutrition assistance programs and the creation of two programs, Pandemic Electronic Benefit Transfer (P-EBT) and the Farmers to Families Food Box Program (Food Box Program). The rise in FY 2020 expenditures was driven by increased spending on these two new programs, as well as the Supplemental Nutrition Assistance Program (SNAP). Special Supplemental Nutrition Program for Women, Infants, and Children (WIC) expenditures remained relatively unchanged while pandemic-induced disruptions in the operation of schools, childcare centers and daycare homes led to declines in child nutrition spending. This chart is based on data available on the USDA, Economic Research Service’s (ERS) General Overview of Food Assistance and Nutrition Programs webpage, updated April 2021.
Friday, April 16, 2021
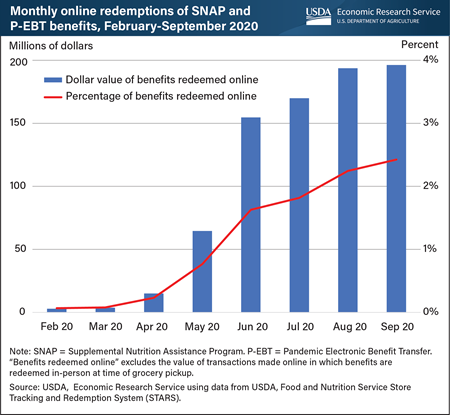
The Supplemental Nutrition Assistance Program (SNAP) Online Purchasing Pilot began in 2019 as mandated by the 2014 Farm Act and was quickly expanded in 2020 in response to the COVID-19 pandemic. The pilot allows households in participating States to use their SNAP benefits to purchase groceries online from a limited number of authorized retailers. Households can similarly use Pandemic Electronic Benefit Transfer (P-EBT) benefits, which were issued in 2020 to households with children missing free and reduced-price school meals during the pandemic. Online transactions using benefits are subject to the same requirements as in-person transactions and cannot be spent on tips or fees. The number of States where SNAP and P-EBT benefits could be redeemed online grew from just one State at the beginning of 2020 to 46 States by the end of September 2020. As availability increased and the pandemic necessitated continued social distancing, the value of SNAP and P-EBT benefits redeemed online increased. In February 2020, households redeemed less than $3 million in benefits online, accounting for less than 0.1 percent of all benefits redeemed. By September, this amount grew to $196 million — 67 times its value in February. Overall, households redeemed $801 million in benefits online from February to September 2020. Despite this rapid growth, online redemptions accounted for only 2.4 percent of all benefits redeemed in September. This chart is based on a chart in the USDA, Economic Research Service’s COVID-19 Working Paper: Supplemental Nutrition Assistance Program and Pandemic Electronic Benefit Transfer Redemptions during the Coronavirus Pandemic, released March 2021.

Thursday, April 8, 2021
The U.S. Government expanded existing food assistance programs and introduced new ones in response to the COVID-19 pandemic and subsequent economic contraction in the United States in 2020. Some States began issuing monthly supplemental emergency allotments to Supplemental Nutrition Assistance Program (SNAP) households in March 2020, with the rest beginning to do so in April 2020. All States issued Pandemic Electronic Benefit Transfer (P-EBT) benefits to households with children who missed free or reduced-price school meals during the 2019-20 school year; the earliest States began issuing P-EBT benefits in April 2020. This led to a rapid increase in the dollar amount of food assistance benefits issued to households and redeemed for groceries during the pandemic. The value of total monthly redemptions roughly doubled from $4.7 billion in March 2020 to $9.5 billion in June 2020. Most P-EBT benefits for the 2019-20 school year were issued in May and June 2020, leading total redemptions to peak in June and decline over the next three months. By September, redemptions amounted to $8.1 billion. Overall, an average of $8.4 billion per month in combined SNAP and P-EBT benefits were redeemed from April through September 2020—an increase of 74 percent compared with the average value of benefits redeemed during the same 6 months in 2017-19. This chart is based on a chart in the USDA, Economic Research Service’s COVID-19 Working Paper: Supplemental Nutrition Assistance Program and Pandemic Electronic Benefit Transfer Redemptions during the Coronavirus Pandemic, released March 2021.
Wednesday, March 10, 2021
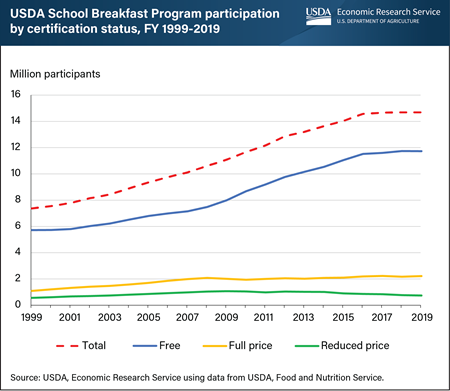
Between 1999 and 2019, participation in USDA’s School Breakfast Program roughly doubled, increasing from 7.4 million children on a typical school day in fiscal year (FY) 1999 to 14.7 million in FY 2019. The Federal program makes healthy breakfasts available to all students in participating schools, with children from low-income households receiving the meals for free or at a reduced price. Most of the growth in participation over the last 2 decades has been among students receiving free breakfasts. Free breakfast participation rose from 5.7 million children in FY 1999 to 11.7 million in FY 2019, an increase of 5 million children. In FY 2019, 80 percent of breakfasts served were free, 5 percent were provided at a reduced price, and 15 percent were full price. Federal spending for the program totaled $4.5 billion in FY 2019—3 percent more than in the previous year. These data were collected before the COVID-19 pandemic and therefore do not account for pandemic-related conditions, including school closures and economic conditions. FY 2020 data that would reflect those circumstances are expected to be released during summer 2021. The data for this chart are from the USDA, Economic Research Service’s Child Nutrition Programs topic page.
Friday, August 21, 2020
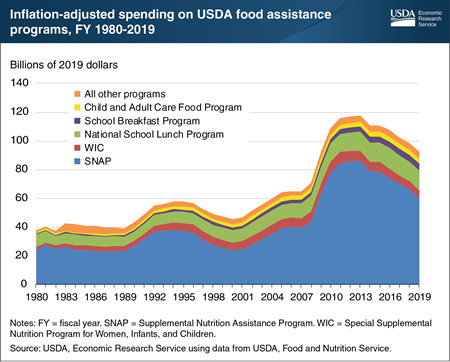
USDA administers 15 domestic food and nutrition assistance programs that together form a nutritional safety net for millions of children and low-income adults. Federal expenditures on these programs totaled $92.4 billion in fiscal year (FY) 2019, their lowest level since FY 2009 and 22 percent less than the inflation-adjusted historical high of $117.9 billion set in FY 2013. The decline in spending between 2013 and 2019 was likely largely due to continued improvement in the U.S. economy, as the unemployment rate declined from 7.4 to 3.7 percent over that time period. Spending for the Supplemental Nutrition Assistance Program (SNAP), which accounted for almost two-thirds (65.3 percent) of Federal food and nutrition assistance spending in FY 2019, totaled $60.4 billion, or 8 percent less than in FY 2018 and 30 percent less than the inflation-adjusted historical high of $86.3 billion set in FY 2013. Expenditures fell for both SNAP and the Special Supplemental Nutrition Program for Women, Infants, and Children (WIC) between FYs 2018 and 2019, but increased between 2 and 3 percent for each of the three largest child nutrition programs—the National School Lunch Program, the School Breakfast Program, and the Child and Adult Care Food Program. A version of this chart appears in the Economic Research Service report, The Food Assistance Landscape: Fiscal Year 2019 Annual Report, July 2020.
Wednesday, May 13, 2020
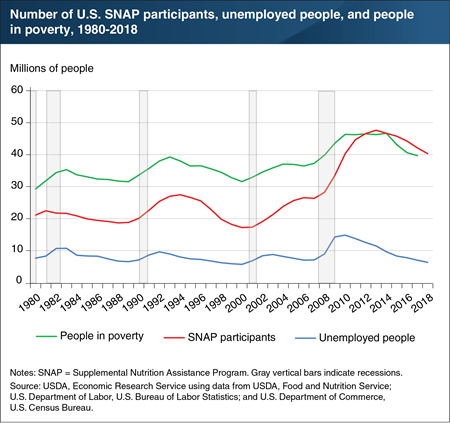
USDA’s Supplemental Nutrition Assistance Program (SNAP) is the Nation’s largest food and nutrition assistance program. SNAP is available to most needy households with limited incomes and assets, subject to certain work and immigration status requirements. As a means-tested program, the number of people eligible for SNAP is inherently linked to the health of the economy, making it one of the Nation’s primary countercyclical assistance programs—contracting during periods of economic growth and expanding during economic downturns. National statistics from 1980 to 2018 on employment, poverty, and SNAP participation provide historical context for current U.S. economic conditions. Historical statistics reveal that the number of SNAP participants generally tracks the number of unemployed people and the number of people in poverty in the United States. Improvement in economic conditions during the early stages of an economic recovery may take longer to be felt by the low-wage workers who are more likely to receive SNAP benefits, resulting in a lagged response of SNAP participation to a reduction in the unemployment rate. This chart appears in the Economic Research Service report, The Food Assistance Landscape: FY 2018 Annual Report, April 2019.
Wednesday, April 29, 2020
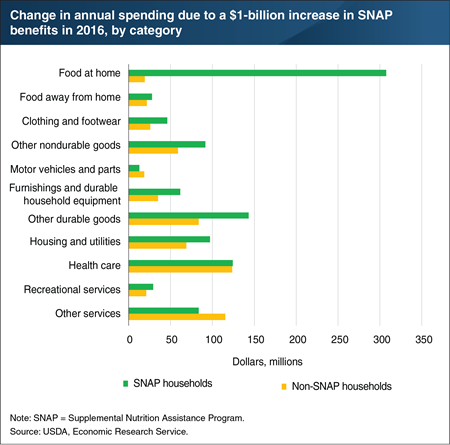
When participants in USDA’s Supplemental Nutrition Assistance Program (SNAP) spend their benefits, the spending “multiplies” throughout the economy because businesses—and their employees—supplying food and other goods purchased by SNAP households receive additional funds to make purchases of their own. In a 2019 study, Economic Research Service (ERS) researchers estimated how a hypothetical $1-billion increase in SNAP benefits in 2016 would have affected spending by SNAP and non-SNAP households. Most SNAP participants spend their own cash in addition to SNAP benefits to purchase adequate food. Thus, SNAP households would spend the full amount of the increased benefits at authorized food stores, but they also would redirect some of the cash that they had been spending on food at home to other goods or services. ERS researchers estimated that the additional SNAP benefits would have the largest effect on SNAP households’ spending on food at home and durable goods. Income is generated for those involved in producing, transporting, and marketing the food and other goods purchased by SNAP recipients, which has a cascading effect of more spending and income. The top categories toward which non-SNAP households would direct this new income were savings, health care, and other services. Because of their low incomes, most SNAP households are likely to spend the entire income increase rather than save a portion of it. These estimates do not take into account current economic conditions and the effect that the COVID-19 pandemic is having on spending behaviors. The data in the chart are part of the analysis found in the ERS report, The Supplemental Nutrition Assistance Program (SNAP) and the Economy: New Estimates of the SNAP Multiplier, and the Amber Waves article, “Quantifying the Impact of SNAP Benefits on the U.S. Economy and Jobs,” released July 18, 2019.
Tuesday, December 17, 2019
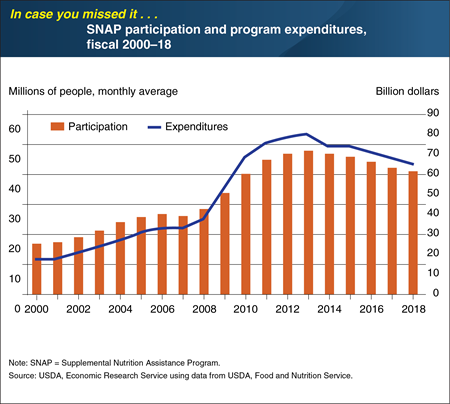
The Supplemental Nutrition Assistance Program (SNAP) is the cornerstone of USDA’s food and nutrition assistance programs, accounting for 68 percent of all Federal food and nutrition assistance spending in fiscal 2018. An average of 40.3 million people per month participated in the program in fiscal 2018, 4 percent fewer than in fiscal 2017. As the fifth consecutive year of declining participation, fiscal 2018’s caseload was 15 percent less than the historical high average of 47.6 million participants per month in fiscal 2013. The decrease in SNAP participation in 2018 was likely associated with the country’s continued economic improvement in recent years. Federal spending for SNAP fell by 5 percent in fiscal 2018 to $65.0 billion—19 percent less than the historical high of $79.9 billion set in fiscal 2013. This chart appears in the ERS report, The Food Assistance Landscape: FY 2018 Annual Report, released on April 18, 2019. This Chart of Note was originally published May 7, 2019.
Friday, November 8, 2019
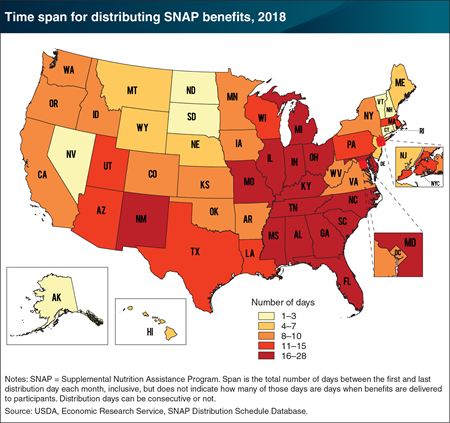
Households participating in USDA’s Supplemental Nutrition Assistance Program (SNAP) receive their benefits in a lump-sum on a single day each month. The majority of benefits are redeemed within a week after households receive them. When benefits are distributed on a single day or over a few days each month, this can produce a surge in demand, followed by a large drop in demand—making it difficult for food retailers to adequately stock and staff stores throughout the month. States have the option to stagger benefit deliveries over the month, with a portion of SNAP recipients receiving benefits each distribution day. These distribution days can be consecutive or not. Benefit distribution schedules differ by State, and many have changed over time. A new ERS database documents monthly distribution schedules for each State, the District of Columbia, and New York City for 1998–2018. The number of States that distribute SNAP over 16 days or more each month has increased from 2 States in 1998 to 16 States in 2018. Most of the States with the longest span in their SNAP distribution schedule are in the South and Midwest. This map appears in the August 2019 Amber Waves article, “ERS’s SNAP Distribution Schedule Database Allows for New Research on Program Impacts.”
Tuesday, November 5, 2019
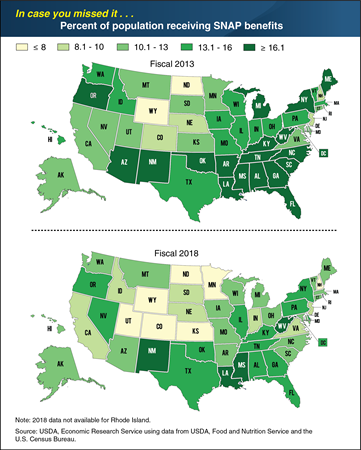
USDA’s Supplemental Nutrition Assistance Program (SNAP) provides benefits for purchasing food in authorized food stores to needy households with limited incomes and assets. In fiscal 2018, an average of 40.3 million low-income individuals per month received SNAP benefits in the United States. The percent of Americans participating in the program declined from 15.0 percent in 2013 to 12.3 percent in 2018, marking the fifth consecutive year of a decline in the percent of the population receiving SNAP. In seven States—Colorado, Kansas, Minnesota, New Hampshire, North Dakota, Utah, and Wyoming—8 percent or fewer of residents received SNAP benefits in 2018. Between 2013 and 2018, 46 States and the District of Columbia saw a decrease in the share of residents receiving SNAP benefits, while 4 States experienced increases. Idaho showed the largest decline in percent of residents participating in SNAP—a 36-percent decline from 14.1 to 9.0 percent of residents. Eighteen States and the District of Columbia had declines in participation shares of at least 25 percent between 2013 and 2018. Nevada had the largest increase in participation share, growing from 12.9 to 14.5 percent of residents. The fiscal 2018 map appears in the "Food Security and Nutrition Assistance" section of the ERS data product, “Ag and Food Statistics: Charting the Essentials,” updated in June 2019. This Chart of Note was originally published July 18, 2019.
Wednesday, October 9, 2019
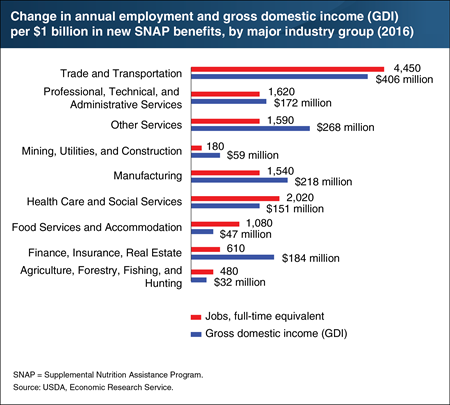
As participants in USDA’s Supplemental Nutrition Assistance Program (SNAP) spend their benefits, income is generated for those involved in producing, transporting, and marketing the food and other goods purchased by SNAP recipients. ERS researchers recently compiled a new social accounting matrix to quantify the effect of additional SNAP benefits on employment and gross domestic income (GDI) for various sectors of the U.S. economy. They found that a hypothetical new $1 billion in SNAP benefits would have a relatively large effect on manufacturing industries and the trade and transportation industries. The new SNAP benefits would generate $218 million in GDI and 1,540 full-time equivalent jobs for manufacturing industries, including food and beverage processors. For the trade and transportation industries, new income totaling $406 million and 4,450 jobs would be generated. These industries include grocery stores, food and other wholesalers, plus the trucking and rail freight industries, among others. The hypothetical new $1 billion in SNAP benefits would generate an additional $32 million in GDI going to agriculture, forestry, fishing, and hunting and 480 jobs in these industries. This chart appears in the ERS report, The Supplemental Nutrition Assistance Program (SNAP) and the Economy: New Estimates of the SNAP Multiplier, and the Amber Waves article, “Quantifying the Impact of SNAP Benefits on the U.S. Economy and Jobs,” released in July 2019.
Wednesday, September 25, 2019
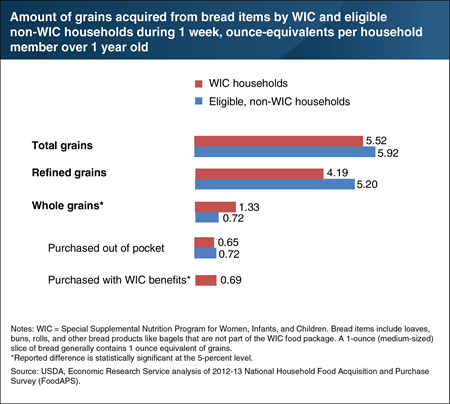
In 2009, USDA’s Special Supplemental Nutrition Program for Women, Infants, and Children (WIC) added whole-grain bread and other whole-grain options, such as brown rice and whole-grain tortillas, to its supplemental food packages for pregnant women, breastfeeding women, and children ages 1 through 4 years old. Most Americans underconsume whole grains relative to Federal dietary recommendations. ERS researchers used USDA’s National Household Food Acquisition and Purchase Survey (FoodAPS) to compare the amounts of whole and refined grains acquired from bread by WIC and eligible non-WIC households. During the FoodAPS survey week, WIC households acquired about the same amount of total grains from bread as eligible non-participants. However, they bought more whole grain bread. WIC households acquired 1.33 ounce-equivalents of whole grains from bread per member, on average, versus 0.72 ounce-equivalents for eligible non-WIC households. This difference can be attributed to purchases of whole grain bread made with WIC benefits. This chart appears in the ERS report, USDA Special Supplemental Nutrition Program for Women, Infants, and Children (WIC): A New Look at Key Questions 10 Years After USDA Added Whole-Grain Bread to WIC Food Packages in 2009, August 2019.


