ERS Charts of Note
Subscribe to get highlights from our current and past research, Monday through Friday, or see our privacy policy.
Get the latest charts via email, or on our mobile app for  and
and 
Wednesday, August 16, 2017
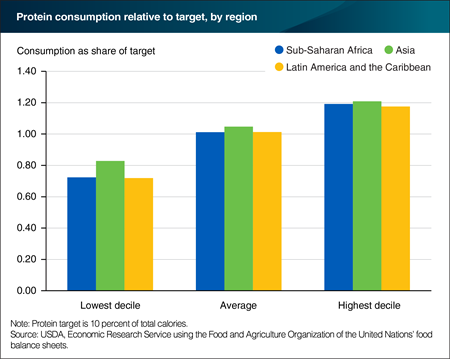
Improvements in average diets are welcome developments, but lower income households continue to fall short of nutritional targets. A closer look at consumption of protein, fat, and fruits and vegetables for the three most food-insecure regions—Sub-Saharan Africa (SSA), Latin America and Caribbean (LAC), and Asia (minus the Commonwealth of Independent States countries)—reveals insufficient food access for the lowest income groups in all regions. The disparity between low-income versus high-income intake levels within each region is particularly pronounced in the case of proteins. Here, average daily consumption in all three regions studied is close to the recommended level of 10 percent of total diets, with SSA’s consumption falling slightly below the threshold. While the highest income decile has a protein share 20 percent above the target, the lowest income consumers are 20-30 percent below, with the lowest level in LAC, followed by SSA. This example illustrates that food security is not only linked to a country’s average income levels, but also, importantly, to how this income is distributed within the country. While average incomes in LAC are higher than in SSA and Asia, income distribution is more unequal, leaving the lowest income households more vulnerable to food insecurity. This chart appears in the ERS International Food Security Assessment, 2017-27 report, released on June 30, 2017.
Wednesday, July 19, 2017
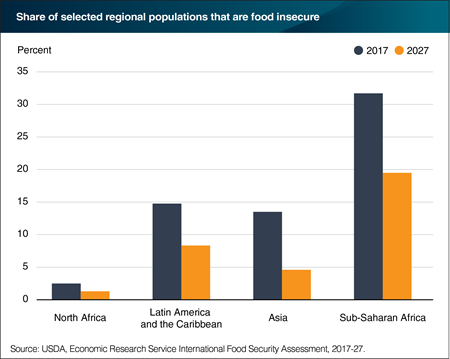
Given projections for low food prices and rising incomes, food security is expected to improve through 2027 for 76 low- and middle-income countries covered by ERS’s International Food Security Assessment, 2017-27. The share of the population in the 76 countries that is food insecure, defined as not having access to at least 2,100 calories per day, is projected to fall from 17.7 percent in 2017 to 8.9 percent in 2027, with the number of food-insecure people declining from just below 650 million to about 370 million. Food security indicators differ greatly by region. Sub-Saharan Africa has the highest share of food-insecure people, with 31.7 percent of the population food insecure in 2017. That share is projected to drop to around 20 percent of the region by 2027 as incomes rise. Asia is projected to significantly reduce its share of food insecure people by 2027 to less than 5 percent, a near three-fold decrease from the current 13.5 percent. Latin America and the Caribbean are expected to improve as well, but to a lesser degree. The most food secure region included in the study remains North Africa, which is expected to have only 1.3 percent of its population experiencing food insecurity by 2027. This chart appears in the ERS International Food Security Assessment, 2017-27 report, released on June 30, 2017.
Thursday, June 8, 2017
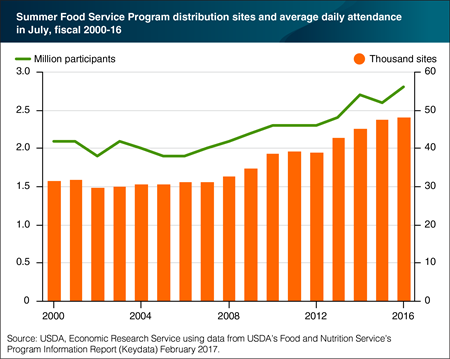
In 2016, USDA’s Summer Food Service Program provided meals to 2.8 million children on an average operating day in July, the peak month for program operations. This was a 7.7-percent increase from 2015’s July participation. Meals are served at a wide variety of USDA-approved sites including schools, camps, parks, playgrounds, housing projects, community centers, churches, and other public sites where children gather in the summer. Sites are eligible to offer free USDA-funded meals and snacks if the sites operate in areas where at least half of the children come from families with incomes at or below 185 percent of the Federal poverty level, or if more than half of the children served by the site meet this income criterion. In 2016, 47,981 sites offered summer meals, about 400 more than in 2015. Many low-income children also obtain free meals while school is out through the Seamless Summer Option of the National School Lunch and Breakfast Programs. This chart is from the Child Nutrition Programs: Summer Food Service Program topic page on the ERS Web site, updated May 22, 2017.
Monday, April 24, 2017
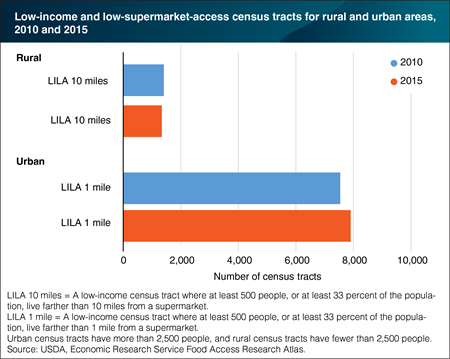
Efforts to encourage Americans to improve their diets presume that a wide variety of nutritious foods are available to all. But, for some areas and people, access to healthy food may be limited by the lack of supermarkets and financial resources. ERS’s Food Access Research Atlas allows users to map low-income and low-supermarket-access (LILA) census tracts in 2010 and 2015. One access measure considers a low-income tract to be LILA if at least 500 people, or at least 33 percent of the population, live more than 1 mile from the nearest supermarket in urban tracts or more than 10 miles in rural tracts. Between 2010 and 2015, the number of urban LILA tracts increased by 5 percent, while the number of rural LILA tracts decreased by 5 percent. Much of the increase in urban LILA tracts is attributed to a rise in the number of low-income areas—perhaps a casualty of the 2007-09 recession—rather than reduced access. This chart is from "Low-Income Areas With Low Supermarket Access Increased in Urban Areas, But Not in Rural Areas, Between 2010 and 2015" in ERS’s Amber Waves magazine, April 2017.
Wednesday, January 25, 2017
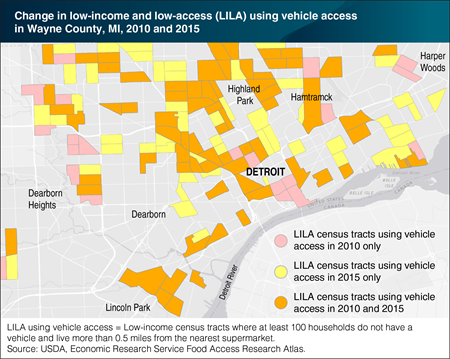
Limited access to healthy and affordable food may impede some Americans from achieving a healthy diet. ERS’s Food Access Research Atlas provides a common measure of neighborhood access to healthy, affordable food for the entire Nation. The Atlas allows users to map low-income and low-supermarket access census tracts for 2015 and compare the results with those for 2010. Individuals can choose four measures of low-supermarket access based on residents’ distances from the nearest supermarket (more than 0.5 or 1 mile in urban areas or more than 10 or 20 miles in rural areas) and vehicle access. One measure considers a tract to be low-income and low-access if it is low-income and contains a substantial number of vehicle-less households that live more than 0.5 miles from the nearest supermarket. Using this measure, the number of low-income and low-access census tracts in Wayne County, Michigan, rose 35 percent from 2010 to 2015. Twenty-two percent of Wayne County households lived in these tracts in 2015, and 4 percent of them lived more than 0.5 miles from a supermarket and did not have a vehicle. This map was created using ERS’s Food Access Research Atlas, updated January 17, 2017.
Monday, August 1, 2016
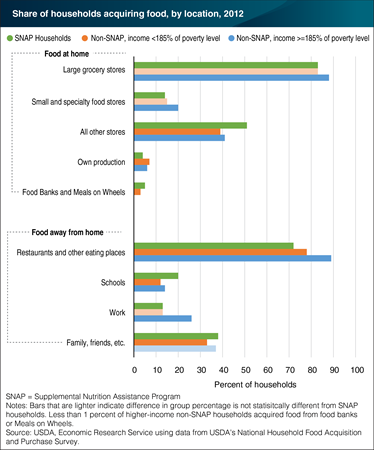
Understanding where U.S. households acquire food, what they acquire, and what they pay is essential to identifying which food and nutrition policies might improve diet quality. USDA’s National Household Food Acquisition and Purchase Survey (FoodAPS) provides a complete picture of these key aspects during a 7-day period in 2012 by including both food at home and food away from home acquisitions. Higher-income households are more likely to visit large grocery stores (88 versus 83 percent) and small or specialty food stores (20 versus 14-15 percent) than households that participate in USDA’s Supplemental Nutrition Assistance Program (SNAP) and lower-income non-SNAP households. SNAP households are more likely to report an acquisition in the ‘all other stores’ category compared with both non-SNAP groups (51 versus 39-41 percent), which includes convenience stores, gas stations, and pharmacies. Considering food away from home, SNAP households are least likely to visit restaurants/other eating places when compared to lower-income non-SNAP and higher-income households. In addition, a larger share of SNAP households obtain food from schools (20 percent) than lower-income non-SNAP households (12 percent) and higher-income households (14 percent). Finally, higher-income households are twice as likely to get food from work than the other two groups, which is not surprising given their greater employment rates. The data for this chart can be found in the ERS report, Where Households Get Food in a Typical Week: Findings from USDA’s FoodAPS, released on July 27, 2016.
Friday, December 11, 2015
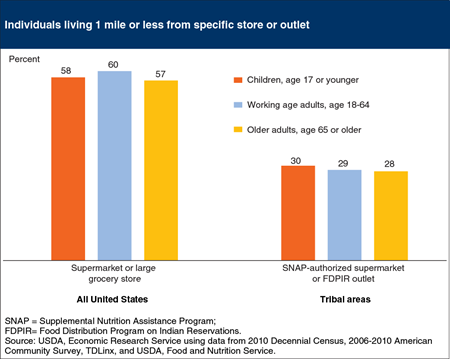
USDA provides healthful foods to low-income households in Native American tribal areas through its Food Distribution Program on Indian Reservations (FDPIR). Due to access reasons, some households participate in FDPIR as an alternative to USDA’s Supplemental Nutrition Assistance Program (SNAP). Warehouses, tribal stores, and local sites are used to distribute the USDA foods. Households living on tribal lands that qualify for food assistance can switch between SNAP and FDPIR on a month-to-month basis. ERS researchers calculated distances to SNAP-authorized supermarkets and FDPIR outlets in American Indian Tribal Areas, Oklahoma Tribal Statistical Areas, and Alaska Native Village Statistical Areas. They found that 30 percent of children, 29 percent of working-age adults, and 28 percent of older adults in these tribal areas lived 1 mile or less from a SNAP-authorized supermarket or a FDPIR outlet in 2010. Nationally, 58 percent of children and 57 to 60 percent of adults lived 1 mile or less from a supermarket or large grocery store in 2010. This chart appears in “Measuring the Food Access Gap in Native American Tribal Areas” in ERS’s December 2015 Amber Waves magazine.
Tuesday, October 20, 2015
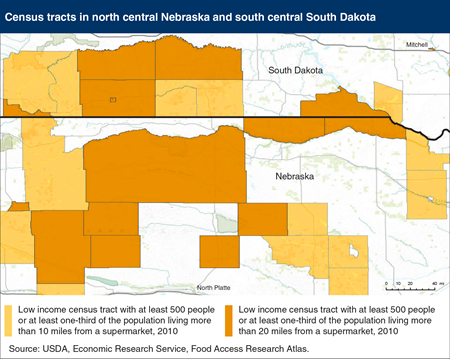
Limited access to sources of healthy and affordable food may make it harder for some Americans to eat a healthy diet. Distance from one’s home to a retailer offering a wide variety of fresh, canned, and frozen foods is an often-used measure of food access. USDA’s Food Access Research Atlas maps several measures of food access, including low-income census tracts where a large number or share of the residents live 10 miles or more from a supermarket or large grocery store. In the example map of north central Nebraska and south central South Dakota, low-income tracts shaded light orange contained at least 500 people or at least one-third of the population who lived more than 10 miles from the nearest supermarket in 2010. Low-income tracts shaded dark orange contained a significant number or share of residents who lived more than 20 miles from a supermarket. Nationally, about 2.1 million people lived in low-income census tracts and were at least 10 miles from the nearest supermarket in 2010 and over 300,000 lived more than 20 miles from the nearest supermarket. This map is from the Food Access Research Atlas on the ERS website.
Tuesday, August 11, 2015
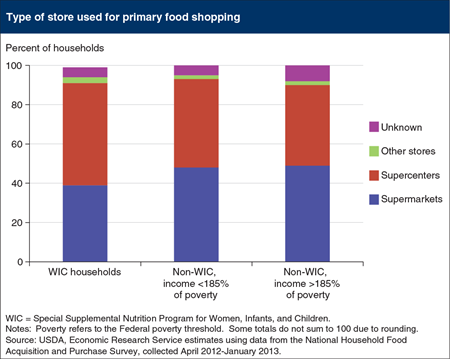
Data from a new USDA-funded survey, National Household Food Acquisition and Purchase Survey (FoodAPS), show that households that participate in USDA’s Special Supplemental Nutrition Program for Women, Infants, and Children (WIC) are more likely to use supercenters for their primary food shopping than non-WIC comparison households (non-participating households that contain either a pregnant woman or a child under the age of 5). Over half of WIC households (52 percent) used a supercenter for their main food shopping, compared with 45 percent of non-WIC comparison households with incomes below 185 percent of the poverty threshold and 41 percent of higher-income non-WIC comparison households. Because WIC households are larger and more likely to contain multiple young children compared with non-WIC comparison households, WIC households may be more enticed to shop at supercenters in order to purchase larger-sized products or take advantage of one-stop shopping. This chart appears in “Most U.S. Households Do Their Main Grocery Shopping at Supermarkets and Supercenters Regardless of Income” in the August 2015 issue of ERS’s Amber Waves magazine.
Wednesday, July 15, 2015
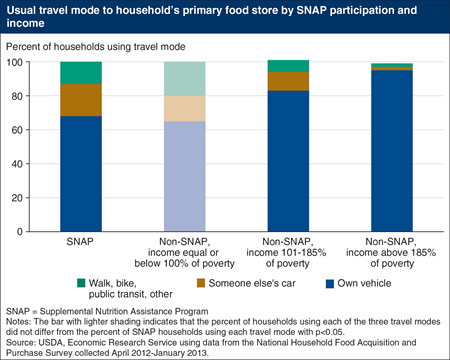
Data from USDA’s new National Household Food Acquisition and Purchase Survey (or FoodAPS) show that most U.S. households use their own vehicles for their primary food shopping. However, households that participate in USDA’s Supplemental Nutrition Assistance Program (SNAP) are more likely to rely on someone else’s car, walk, bike, or take public transit than households with incomes above the poverty thresholds. Sixty-eight percent of SNAP participants used their own cars for food shopping, compared to 83 percent of non-SNAP households with incomes between 101 and 185 percent of poverty and 95 percent of households with incomes above 185 percent of poverty. Travel modes of non-participants with income below the poverty line are similar to those of SNAP households. Among SNAP households, 19 percent reported using someone else’s car to do their primary shopping, and 13 percent walked, biked, or used a shuttle or public transportation. How one travels to a grocery store can influence what gets purchased; traveling by bus or walking limits purchases to what can be carried or pulled in a cart. A person needing to borrow someone else’s car—or share a ride to a store—may not be able to shop as frequently or at the times when food supplies are running low. This chart is from the ERS report, Where Do Americans Usually Shop for Food and How Do They Travel to Get There?, March 2015.
Wednesday, April 29, 2015
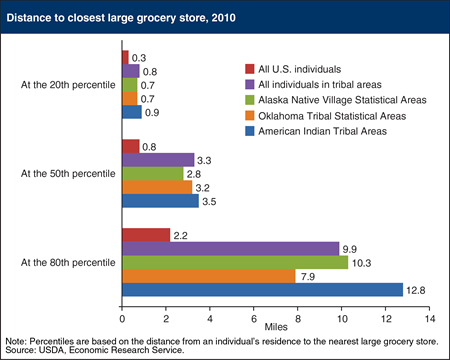
A recent ERS study used 2010 data to compute distances to the nearest large grocery store (annual sales of $2 million or more) for individuals living in 3 types of U.S. tribal areas: Alaska Native Village Statistical Areas, Oklahoma Tribal Statistical Areas, and American Indian Tribal Areas. Individuals were ordered by how far they lived from a large grocery store. Upon ranking individuals across the United States in this way, researchers found that the median distance to the closest large grocery store was 0.8 miles, compared to 3.3 miles for individuals living in tribal areas. At the 20th percentile, the distance from an individual’s residence to the nearest large grocery store was 0.3 miles for all U.S. individuals and 0.8 miles for tribal area individuals. More remote U.S. households, those at the 80th percentile, were 2.2 miles away from a large grocery store compared to 9.9 miles for the similar percentile of households living in tribal areas. This chart appears in “Native Americans Living in Tribal Areas Face Longer Trips to the Grocery Store” in the April 2015 issue of ERS’s Amber Waves magazine.
Tuesday, March 31, 2015
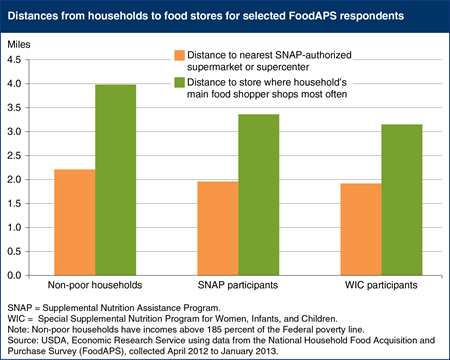
A new survey funded by USDA, the National Household Food Acquisition and Purchase Survey (or FoodAPS), asked the main food shopper of the household where they did most of their food shopping. Researchers compared the distance to this store to the distance to the nearest supermarket or supercenter authorized to accept benefits from USDA’s Supplemental Nutrition Assistance Program (SNAP-SM/SC). Researchers found that on average, all households—those receiving food assistance and those not—bypass the SNAP-SM/SC closest to their home to shop at another store, which may or may not be SNAP authorized, for their main grocery purchases. The average SNAP participant lived 1.96 miles from the nearest SNAP-SM/SC, but traveled 3.36 miles to their primary store for food shopping. WIC-participating households were 1.92 miles from the nearest SNAP-SM/SC, but traveled 3.15 miles to do their main grocery shopping. Non-poor households traveled 3.98 miles, while the closest SNAP-SM/SC was 2.21 miles from their home. Store proximity may be important, but price, quality, and selection also affect where households shop. In addition, households may food shop on their way home from work or other activities. The statistics for this chart are from the ERS report, Where Do Americans Usually Shop for Food and How Do They Travel to Get There?, released on March 23, 2015.
Thursday, January 29, 2015
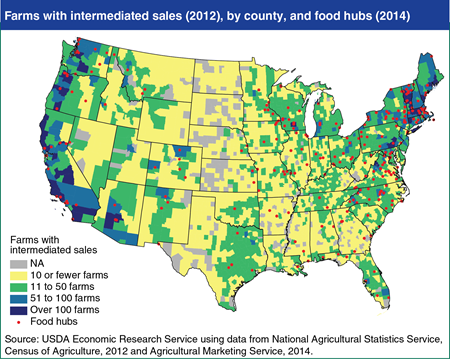
Farmers have two main channels through which to sell their food locally: directly to consumers (at farmers' markets, roadside stands, farm stores, etc.) and through intermediated marketing channels (defined to include sales to grocers, restaurants, schools, universities, hospitals, and regional distributors). In 2012, 163,675 farmers sold an estimated $6.1 billion in local foods overall, with an estimated $4.8 billion sold by 48,371 farmers through these intermediated marketing channels. The number of dedicated local food distributors, brokers, and aggregators serving these intermediated marketing channels, known as regional food hubs, increased by 288 percent between 2007 and 2014, to a total of 302. By engaging in market outreach activities and offering technical services to producers, food hubs provide markets for midsized farmers, and opportunities for small and beginning farmers to scale-up local food sales without increasing the time farm operators and their households spend on marketing activities. Most food hubs are located in metropolitan areas, and where farms with intermediated sales are most numerous. This map is found in the ERS report, Trends in U.S. Local and Regional Food Systems: Report to Congress, January 2015.
Wednesday, December 3, 2014
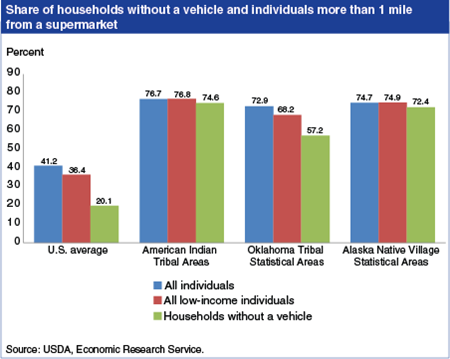
Native Americans living in tribal areas experience high rates of obesity, diabetes, and heart disease that may be due to poor diets. Prior studies cite limited access to supermarkets and other sources of affordable and nutritious foods as contributing factors to less healthful food choices by U.S. consumers. Low population density and limited incomes create disincentives for supermarkets to locate in many tribal areas. In 2010, 74.4 percent of the people in the 545 U.S. tribal areas examined in a recent ERS study lived more than 1 mile from a supermarket, compared with 41.2 percent of the U.S. population. Similarly, among low-income individuals, shares were higher for tribal populations than the national average. Regular access to a car can make traveling to supermarkets easier. However, the share of tribal households without access to a vehicle who lived more than 1 mile from a supermarket ranged from 57.2 to 74.6 percent, versus the 20.1-percent U.S. average. This chart appears in the ERS report, Measuring Access to Healthful, Affordable Food in American Indian and Alaska Native Tribal Areas, released on December 1, 2014.
Monday, August 4, 2014
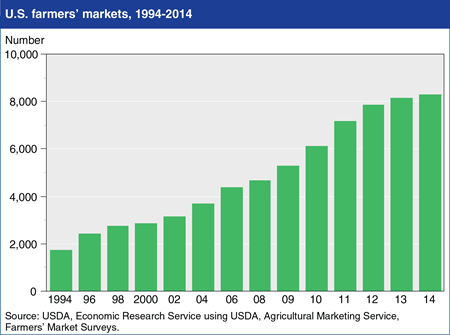
A farmers’ market is a common area where several farmers gather on a recurring basis to sell a variety of fresh fruits, vegetables, and other farm products directly to consumers. The number of farmers’ markets rose to 8,284 in 2014, up from 3,706 in 2004 and 1,755 in 1994, according to USDA’s Agricultural Marketing Service. Farmers’ markets tend to be concentrated in densely populated areas of the Northeast, Midwest, and West Coast. Generally, farmers’ markets feature items from local food systems, although depending on the definition of “local,” some vendors may come from outside the local region, and some local vendors may not sell locally-produced products. The growing number of farmers’ markets could reflect increased demand for local and regional food products based on consumer perceptions of their freshness and quality, support for the local economy, environmental benefits, or other perceived attributes relative to food from traditional marketing channels. This chart updates one found in the ERS report, Local Food Systems: Concepts, Impacts, and Issues, ERR-97, May 2010.
Wednesday, April 16, 2014
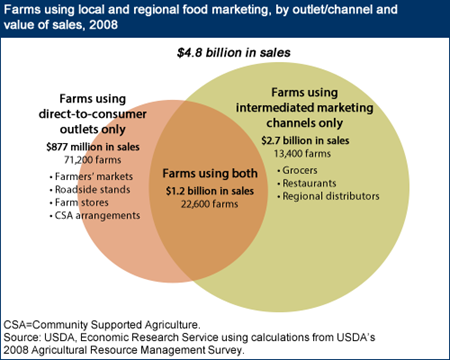
The 2014 Farm Act provides support for local and regional foods across several titles, including nutrition, horticulture, credit, and rural development. Support includes increased consumer access to and marketing of locally and regionally produced food, both via farmer direct-to-consumer outlets and intermediated outlets (e.g., regional distributors, local retailers, or restaurant sales). In particular, the Farmers’ Market and Local Food Promotion Program’s increase in mandatory funding could increase opportunities in the entire local and regional food-supply chain now that intermediaries, including food hubs, can participate. In 2008 (the latest year of analysis available), most local and regional foods were marketed through intermediated channels. Prior to the 2014 Farm Act, support was aimed at local and regional food producers participating in direct-to-consumer sales, rather than those relying on intermediated marketing channels. This chart was adapted from one appearing in the Local and Regional Foods page of Agricultural Act of 2014: Highlights and Implications on the ERS website.
Tuesday, April 30, 2013
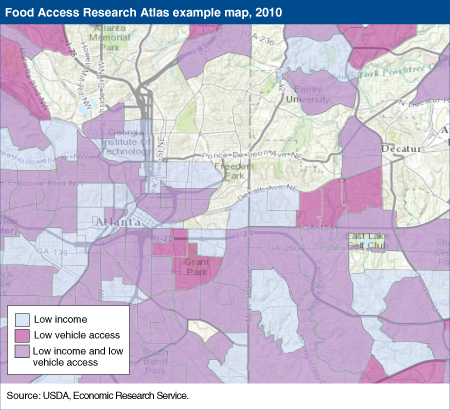
In addition to proximity of supermarkets, income and access to a vehicle both may be important indicators of whether individuals or families are able to attain a healthy and balanced diet. Shoppers who face the combined challenges of low incomes and no vehicle access may find traveling to a store that sells an affordable variety of nutritious foods to be more difficult for them than it is for shoppers who have higher incomes and access to a vehicle. In 2010, about 40 percent of U.S. census tracts were low income tracts, defined as having a poverty rate greater than 20 percent or a median family income less than 80 percent of the surrounding region’s median family income. Twenty-two percent had low vehicle access in which at least 100 households have no access to a vehicle. About 14 percent of all tracts faced the dual problems of low incomes and low vehicle access. In this example map of Atlanta, GA, and the surrounding region from ERS’s Food Access Research Atlas, the light blue areas indicate low income neighborhoods, and areas shaded in dark pink are those with low vehicle access. Some residents of the purple areas face a combination of low incomes and low vehicle access. This map and others showing different indicators of food access can be found on ERS’s Food Access Research Atlas.
Wednesday, April 3, 2013
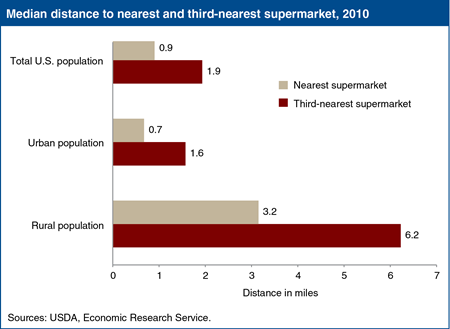
Distance to the nearest supermarket or large grocery store is often used as a measure of access to the foods necessary for a varied and healthful diet. However, because product quality, selection, and price can vary among supermarkets, measuring distance to multiple stores may provide a better picture of whether shoppers can obtain a wide selection of healthful foods at affordable prices. In 2010, half of the U.S. population lived within 2 miles of three supermarkets, while 80 percent lived within 5 miles. Individuals in rural areas had to travel farther than their urban counterparts to the third-nearest store—the median distance to the third nearest supermarket was 6.2 miles for rural residents compared with 1.6 miles for urban residents. This chart appears in “Different Measures of Food Access Inform Different Solutions” in the March 2013 issue of ERS’s Amber Waves magazine.
Friday, March 15, 2013
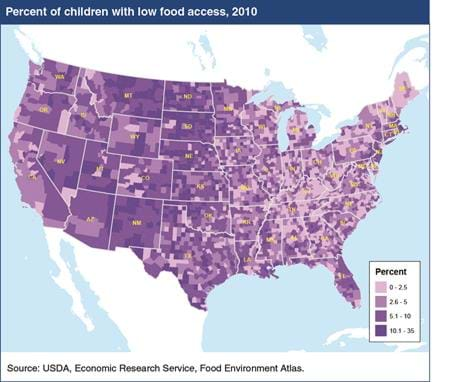
Ready access to healthy, affordable foods can help parents and children make better food choices and can play a role in children’s nutrition and health. One commonly used measure of access to nutritious, affordable foods (food access) is distance to the nearest supermarket, supercenter, or large grocery store. In ERS’s online mapping tool—the Food Environment Atlas—low food access is defined as living more than 1 mile from one of these types of food retailers. In 89 percent of U.S. counties, 10 percent or less of children (birth to age 17) had low food access in 2010. While using 1 mile to delineate low access provides a uniform national measure, it also may overestimate access problems in rural areas, where people are more likely to have access to vehicles, making traveling farther to supermarkets easier. This map and others showing measures of food access can be found in ERS's Food Environment Atlas.
Tuesday, January 22, 2013
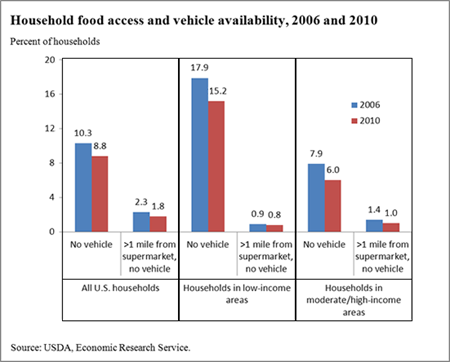
Access to nutritious, affordable food is often measured by the distance a household must travel to the nearest supermarket. Between 2006 and 2010, the number of individuals living more than one mile from a supermarket increased, but more individuals had access to vehicles in 2010 to travel to and from stores. In 2006, 10.3 percent of all U.S. households had no access to a vehicle, dropping to 8.8 percent by 2010. The percentage of households both without a vehicle and farther than a mile from a supermarket also dropped from 2.3 percent in 2006 to 1.8 percent in 2010. A greater share of households in low-income areas does not have vehicles. However, because low-income areas tend to be more densely populated, households in these areas often live closer to supermarkets than in higher-income areas. The statistics for this chart can be found in the ERS report, Access to Affordable and Nutritious Food: Updated Estimates of Distance to Supermarkets Using 2010 Data, ERR-143, November 2012.


