ERS Charts of Note
Subscribe to get highlights from our current and past research, Monday through Friday, or see our privacy policy.
Get the latest charts via email, or on our mobile app for  and
and 
Thursday, March 10, 2016
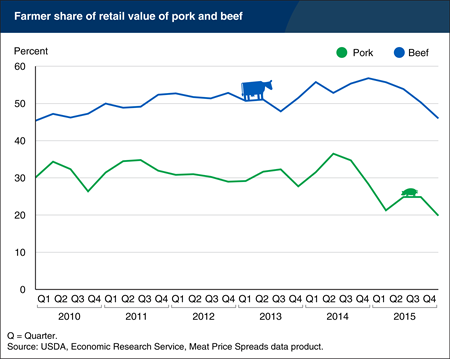
The spreads between farm prices for hogs and cattle and retail prices for pork and beef have widened over the past 18 months, leading to a decline in the farmer share of retail red meat prices. Growing cattle inventories and increased pork production are pushing cattle and hog prices lower. For the fourth quarter of 2015, hog prices (51-52% lean) averaged about $45 per hundredweight, down about 33 percent from a year earlier and nearly 50 percent below the prices received in the second quarter of 2014. Similarly, cattle prices (5-market steer price) averaged $128 per hundredweight in the last quarter of 2015, down nearly 23 percent from the fourth quarter 2014. Retail prices for both beef and pork are down as well, but by a smaller magnitude as they tend to adjust more slowly to changes in the farm price due to the wide variety of other costs—including labor, packaging, storage, and transportation—that also contribute to retail prices. This chart is based on the ERS Meat Price Spreads data product.
Tuesday, February 2, 2016
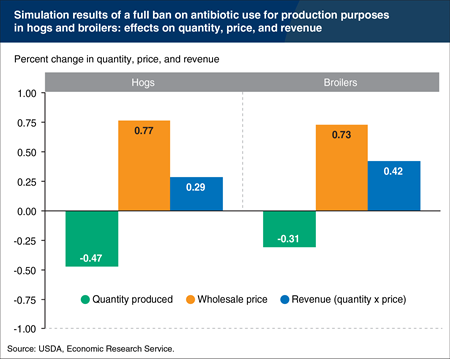
Livestock farmers use antibiotics to treat, control, and prevent disease, and also for production purposes, such as increasing growth and feed efficiency. A new U.S. Food and Drug Administration initiative seeks to eliminate the use of medically important antibiotics for production purposes. ERS research shows that only a portion of hog and broiler producers use antibiotics for production purposes, and the productivity increases from such uses are 1-3 percent. Modelling the effect of production-specific antibiotic restrictions suggests that such a policy would have a modest effect on wholesale prices and quantities produced of chicken and pork—less than a 1-percent increase in wholesale prices and a net decline in production of less than 0.5 percent. Because prices increase more than quantities decrease, gross revenues (price times quantity) would increase slightly. This chart is based on the table found in the Amber Waves feature, “Restrictions on Antibiotic Use for Production Purposes in U.S. Livestock Industries Likely To Have Small Effects on Prices and Quantities,” November 2015.
Thursday, January 28, 2016
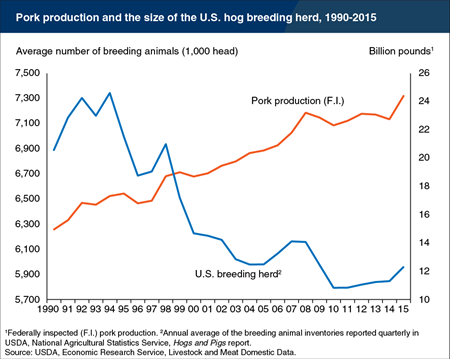
U.S. annual pork production has grown by more than 63 percent since 1990, and in 2015 it reached an all-time record of more than 24.3 billion pounds. Over the same period, the size of the U.S. hog breeding herd declined by more than 13 percent, reflecting strong productivity increases in hog production. Technical innovation in breeding and genetic research has yielded larger numbers of piglets per sow: U.S. average litter rates grew from fewer than 8 pigs per litter in 1990 to more than 10 today. At the same time, improvements in nutrition and barn management practices, together with heavier slaughter weights, have allowed the hog industry to reduce the size of its breeding herd while expanding production of pork. This chart is based on the ERS Livestock & Meat Domestic Data and the January 2016 Livestock, Dairy, and Poultry Outlook report.
Monday, January 25, 2016
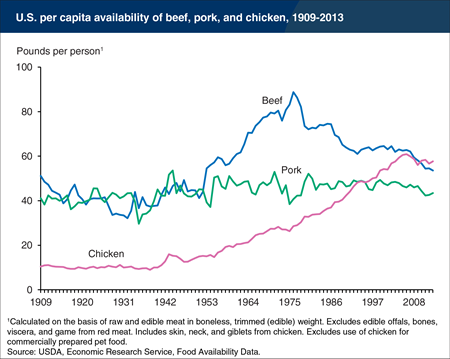
In 2013, 57.7 pounds of chicken per person on a boneless, edible basis were available for Americans to eat, compared to 53.6 pounds of beef and 43.4 pounds of pork, according to ERS’s food availability data. From 1909 to the early 1940s, chicken availability had been around 10 pounds per person a year, while yearly per-person beef and pork availability had ranged from between 30 and 50 pounds. Chicken began its upward climb in the 1940s, as innovations in breeding, mass production, and processing made chicken more plentiful, affordable, and convenient for the dining-out market and for cooking at home. By 1996, chicken had overtaken pork as the second-most-consumed meat, and in 2010, chicken overtook beef for the No. 1 spot. Beef availability rose during the second half of the last century, peaking at 88.8 pounds per capita in 1976. Pork availability, which had fallen in 2010 and 2011, was up in 2012 and again in 2013. This chart appears in ERS’s Ag and Food Statistics: Charting the Essentials data product.
Monday, November 30, 2015
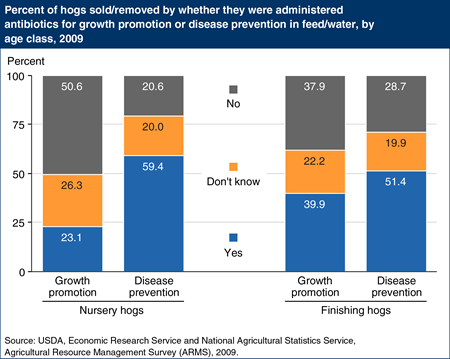
Hog producers use Hog producers use antibiotic drugs to treat/control animal diseases, but they also feed them to their hogs to prevent disease and to promote faster growth through improved absorption of feed. There is growing concern that widespread use of antibiotics in humans and animals may encourage microbial resistance and make the drugs less effective for maintaining their health, and the U.S. Food and Drug Administration (FDA) is moving to end the growth-promotion uses of medically important antibiotics in animal agriculture. Antibiotic use varies across the hog sector, according to a USDA survey of hog producers, and the FDA’s action will affect some but not all producers. Over half of pigs in the nursery stage do not receive antibiotics for growth promotion, and that figure could be as high as 75 percent, because 26 percent of hogs were raised by growers that stated they did not know if antibiotics are in the feed. Some contract growers don’t know if antibiotics are in the feed provided by the company for whom they raise hogs. Antibiotics are more likely to be used for growth promotion in finishing hogs (those being fed to market weight), but even here at least 40 percent of hogs did not receive the drugs for growth promotion. This chart is found in the ERS report, Economics of Antibiotic Use in U.S. Livestock Production, ERR-200, November 24, 2015. antibiotic drugs to treat/control animal diseases, but they also feed them to their hogs to prevent disease and to promote faster growth through improved absorption of feed. There is growing concern that widespread use of antibiotics in humans and animals may encourage microbial resistance and make the drugs less effective for maintaining their health, and the U.S. Food and Drug Administration (FDA) is moving to end the growth-promotion uses of medically important antibiotics in animal agriculture. Antibiotic use varies across the hog sector, according to a USDA survey of hog producers, and the FDA?s action will affect some but not all producers. Over half of pigs in the nursery stage do not receive antibiotics for growth promotion, and that figure could be as high as 75 percent, because 26 percent of hogs were raised by growers that stated they did not know if antibiotics are in the feed. Some contract growers don?t know if antibiotics are in the feed provided by the company for whom they raise hogs. Antibiotics are more likely to be used for growth promotion in finishing hogs (those being fed to market weight), but even here at least 40 percent of hogs did not receive the drugs for growth promotion. This chart is found in the ERS report, Economics of Antibiotic Use in U.S. Livestock Production, ERR-200, November 24, 2015.
Monday, February 9, 2015
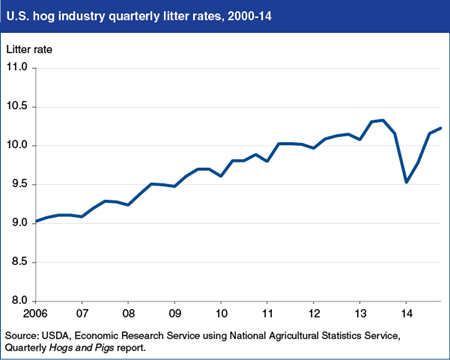
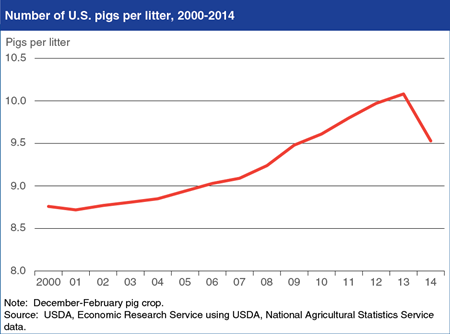
The litter rate (pigs per litter) is an efficiency indicator of the U.S. hog industry. Litter rates have been steadily increasing over time due to improvements in genetics, diet, and animal care and management. The emergence of Porcine Epidemic Diarrhea virus (PEDv) in the U.S. swine herd in the spring of 2013 caused a sharp—but temporary—drop in litter rates. PEDv afflicts young piglets in particular, and caused millions of newborn pigs to die as the disease spread to herds in 33 States. The virus flourishes in cold, damp climates, so its effect on litter rates was strong in the fall and winter months of late 2013 and early 2014. The pigs-per-litter rate began to decline in the fourth quarter of 2013, and then dropped sharply in the first quarter of 2014. Litter rates rebounded in the spring of 2014, responding to the warmer, dryer climates and to aggressive actions by producers, including increased biosecurity measures and vaccination. These measures contributed to lower disease incidence and limited losses of newborn pigs from PEDv; they are also expected to limit the incidence of the disease this winter and will help to minimize the impact of future outbreaks. This chart is based on information in the January 2015 Livestock, Dairy and Poultry Outlook.
Monday, January 12, 2015
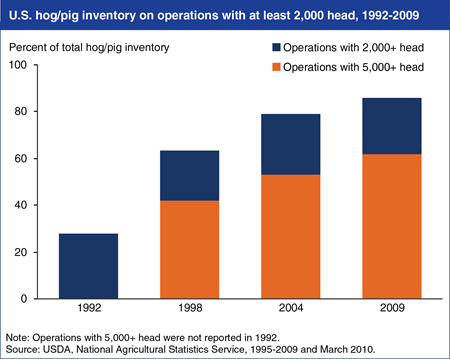
While the number of all farms in the United States remained fairly constant, the number of hog farms fell by about 70 percent between 1992 and 2009, from over 240,000 to about 71,000. Despite fewer hog farms, the Nation’s hog inventory was stable during the period, averaging about 60 million head, with cyclical fluctuations between 56 and 68 million head. Thus, hog production consolidated as fewer, larger farms accounted for an increased share of total output. From 1992 to 2009, the share of the U.S. hog and pig inventory on farms with 2,000 head or more increased from less than 30 percent to 86 percent. In 2009, farms with 5,000 head or more accounted for 61 percent of all hogs and pigs. This chart is found in the ERS report, U.S. Hog Production From 1992 to 2009: Technology, Restructuring, and Productivity Growth, ERR-158, October 2013.
Tuesday, December 16, 2014
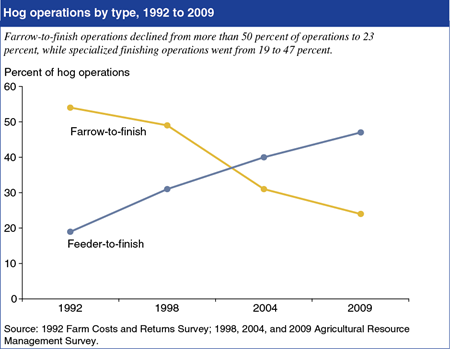
The traditional approach of farrow-to-finish hog production in the U.S.—where breeding and gestation, farrowing, nursery, and finishing to market weight are performed on one operation—is being replaced by operations that specialize in a single production phase. In 1992, more than 50 percent of U.S. hog operations used the farrow-to-finish approach. By 2009, less than 25 percent were farrow-to-finish producers. In contrast, hog operations specializing in raising feeder pigs weighing 30-80 pounds to market weights of 225-300 pounds (feeder-to-finish) accounted for less than 20 percent of hog producers in 1992, but nearly 50 percent in 2009. Specialized operations produced more than 70 percent of U.S. finished hog output in 2009, and were more likely to be producing hogs under contract than were farrow-to-finish farms. This chart is found in the ERS report, U.S. Hog Production From 1992 to 2009: Technology, Restructuring, and Productivity Growth, ERR-158, October 2013.
Tuesday, September 16, 2014
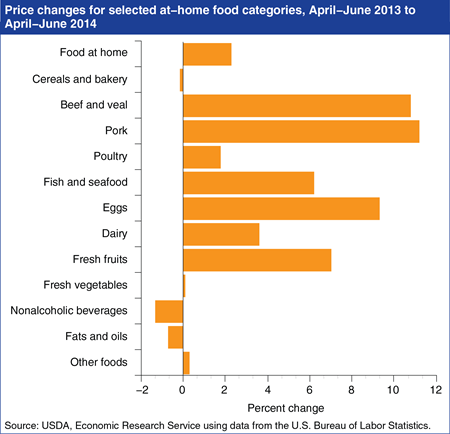
Retail food-at-home prices in the second quarter of 2014 were 2.3 percent higher than a year ago, as most at-home food categories increased in price. Retail beef and veal prices were up 10.8 percent as the supply of beef is strained by historically low herd sizes. Over the same time period, pork prices increased 11.2 percent, partially the result of the Porcine Epidemic Diarrhea virus, which has reduced litter sizes and increased piglet mortality. Egg prices are also up, in part due to increasing exports and a strong domestic demand for eggs and egg products. The increases in beef and veal, pork, and egg prices are the largest year-over-year increases since the fourth quarter of 2011. This chart appears in the Food Prices and Spending section of ERS’s Ag and Food Statistics: Charting the Essentials data product, updated September 10, 2014. More information on ERS’s food price forecasts can also be found in ERS’s Food Price Outlook data product.
Friday, August 8, 2014
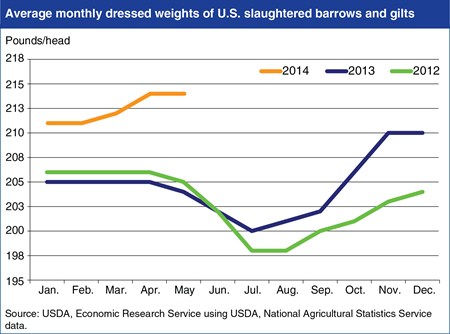
U.S. hog producers are responding to inventory losses associated with the spread of the Porcine Epidemic Diarrhea virus (PEDv) by increasing the average slaughter weights of their remaining inventory, thus mitigating the likely impacts of PEDv on 2014 pork production. The PEDv outbreak reduced the average litter rates for the December 2013-February 2014 and March-May 2014 pig crops by about 5.5 percent and 5.1 percent, respectively, contributing to a 5 percent decline in the June 2014 U.S. hog inventory compared with a year earlier. However, lower U.S. corn prices, combined with excess barn space created by the PEDv losses have allowed producers to respond by holding surviving animals longer on cheaper corn-based rations, thus boosting average dressed weights. During January-May 2014, dressed weights averaged 3.7 percent higher than the same period in 2013. The heavier animals continue to partially offset production losses from PEDv-related deaths. For 2014, USDA forecasts a 5.2 percent drop in hog slaughter, but only a 1.9 percent reduction in pork production. Dressed weights are expected to average more than 214 pounds this year, more than 7 pounds greater than in 2013. Find this chart and additional analysis in Livestock, Dairy, and Poultry Outlook: July 2014.
Thursday, June 26, 2014
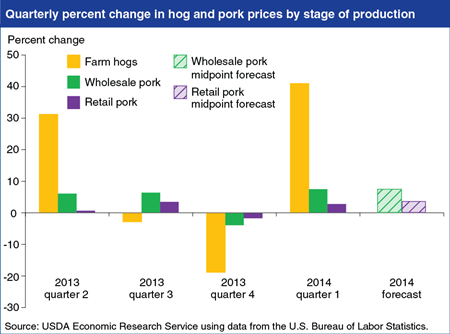
Retail pork prices have been rising in recent months, increasing 2.8 percent in the first quarter of 2014. Higher prices at the meat counter are partly due to increasing farm prices for hogs, which rose 41 percent over the same time period. Higher hog prices to date are, in part, the result of strong demand, particularly in export markets, as well as the high price of pork substitutes such as beef and poultry. In addition, the outbreak of Porcine Epidemic Diarrhea virus (PEDv) has increased piglet mortality, reduced litter sizes, and lowered forecasts for U.S. hog slaughter and pork production later in 2014. Farm prices provide early indications of changes at the wholesale and retail levels, although price swings at those levels are dampened by processing, transportation, and retailing costs. The recent increases in hog prices indicate that the current inflation in retail pork prices can be expected to gain momentum in coming months. ERS forecasts wholesale pork prices to increase 7 to 8 percent in 2014 and retail pork prices to rise by 3 to 4 percent. More information on ERS’s food price forecasts can be found in the Food Price Outlook data product, updated June 25, 2014.
Monday, June 16, 2014
The spread of the Porcine Epidemic Diarrhea virus (PEDv) in the U.S. hog sector since the fall of 2013 has contributed to reduced market hog inventories and higher hog prices in early 2014 and forecasts for lower pork production and higher prices later in the year. PEDv is a coronavirus particularly lethal to pre-weaned piglets. The first U.S. case was formally diagnosed in May 2013 and, according to the American Association of Swine Veterinarians, the disease continued to spread through the fall of 2013, and the number of new cases accelerated early in 2014. The potential effects of PEDv on pork production are first signaled by USDA survey estimates of pigs per litter. Because of the high mortality rate of very young piglets from PEDv, the latest report showed a lower average pigs-per-litter estimate for the December 2013-February 2014 pig crop. As a result, the forecast for the December-February 2014 pig crop is down 2.8 percent compared with 2013, leading to lower expected pork supplies in the summer of 2014. The North American pork industry is fighting the disease through enhanced biosecurity measures, supportive care of affected piglets, and controlled exposure of healthy animals to the disease to help them develop protective immunity. Find additional analysis in Livestock, Dairy, and Poultry Outlook: May 2014.
Tuesday, May 27, 2014
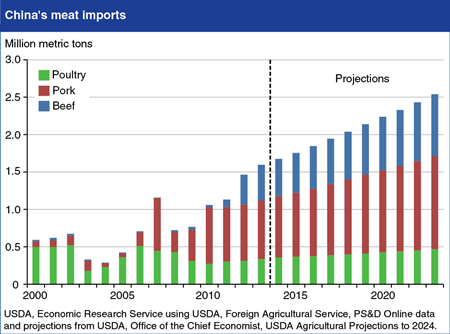
While USDA projects robust increases in China’s meat production and imports of feed grains, China’s meat imports are also projected to rise. Pork imports are projected to show the most growth, rising from about 750,000 tons in 2013 to 1.2 million tons by 2023. The United States, Canada, and European Union are the main suppliers of pork to China. China’s meat consumption is expected to expand at a pace similar to the trend of the past decade. Pork will continue to play a central role in China’s meat economy (China accounts for half of world production and consumption), however, poultry is gaining in popularity, largely because it is cheaper than pork. Restaurants, fast food chains, and cafeterias play a key role in diversifying meat consumption, since many feature specific kinds of meat or chicken. Beef and mutton are important parts of popular ethnic cuisines becoming popular among the broader population. Although China is expected to continue producing most of its own meat, China’s livestock sector is under pressure from rising costs, disease, environmental regulations, and resource constraints, which could lead to China’s meat imports rising even further if production cannot sustain its current pace of growth. Find this chart and more analysis in the April Amber Waves feature article "China in the Next Decade: Rising Meat Demand and Growing Imports of Feed."
Friday, May 2, 2014
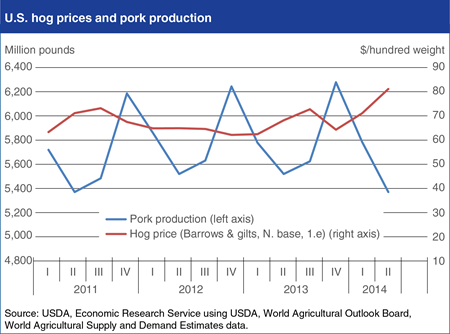
Piglet losses from Porcine Epidemic Diarrhea (PEDv) have reduced USDA’s forecast for 2014 pork production and sparked a recent increase in U.S. hog prices. The 2014 winter pig crop—which will be slaughtered in the summer of 2014—was almost 3 percent lower than a year ago due to pre-weaned piglet deaths associated with PEDv. The impact of the piglet losses on total 2014 pork production and prices is expected to be reduced as producers adjust to the changing market conditions. While fewer hogs will be available for slaughter this year, producers are expected to increase slaughter weights in response to the year-over-year rise in hog prices, lower feed costs, and the excess barn space resulting from fewer hogs moving through the production chain. Average dressed hog weights for 2014 are expected to rise by almost 5 pounds above those in 2013, partially offsetting lower slaughter numbers, limiting the annual production decline to about 2 percent compared with 2013, and leading to some easing of hog prices later in 2014. This chart is based on data in Livestock and Meat Domestic Data, with additional analysis in Livestock, Dairy, and Poultry Outlook: April 2014.
Thursday, April 17, 2014
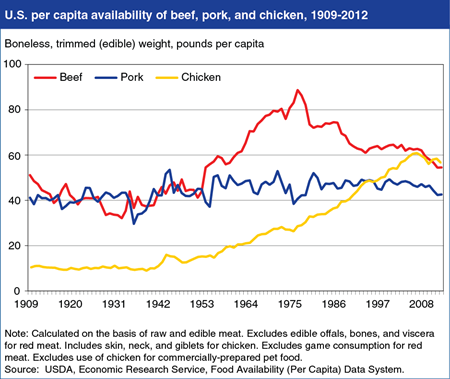
According to ERS's 2012 food availability data, the per capita supply of chicken available to eat in the United States continues to outpace that of beef. In 2012, 56.6 pounds of chicken per person on a boneless, edible basis were available for Americans to eat, compared to 54.5 pounds of beef. Although down from its peak of 60.9 pounds per person in 2006, chicken availability has been higher than that of beef for the past three years. Chicken began its upward climb in the 1940s, overtaking pork in 1996 as the second-most-consumed meat and overtaking beef for the No. 1 spot in 2010. Pork availability, which fluctuated between 49.9 and 46.6 pounds per person over the 1981 to 2009 period, dropped to 42.6 pounds per person in 2012. This chart is from the Summary Findings in ERS’s data product, the Food Availability (Per Capita) Data System.
Friday, March 7, 2014
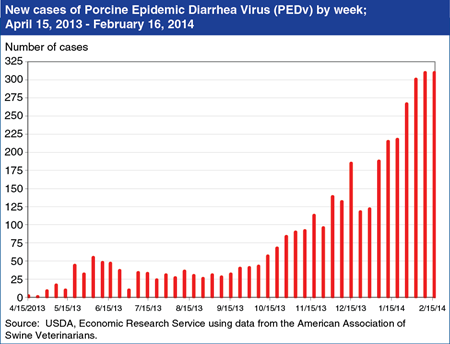
In recent weeks there is evidence indicating acceleration in the rate of Porcine Epidemic Diarrhea Virus (PEDv) cases in the U.S. swine herd, currently leading to modest impacts on USDA forecasts of 2014 U.S. pork production. The presence of PEDv was confirmed in the United States on May 17, 2013. While animals older than 7 days typically recover from the virus, mortality rates for pre-weaned piglets are often 100 percent. There is no effective vaccination to protect animals from the virus. PEDv spreads via the fecal-oral route and via contaminated footwear, clothing, farm supplies, and vehicles. The disease is only infectious to swine, and as such there are no associated food safety concerns. The available data likely understates the incidence of the disease because not every outbreak site is sampled and tested for PEDv, and because PEDv is not a disease that the World Organization of Animal Health (OIE) or USDA requires to be reported. Due to the continued spread of the disease and the likely losses of young animals, in February USDA made a 0.7 percent reduction in the forecast of 2014 pork production. Production losses from PEDv-related animal deaths in 2014 are expected to be partially offset by continued increases in slaughter weights. Find this chart and additional analysis is Livestock, Dairy, and Poultry Outlook: February 2014.
Tuesday, February 19, 2013
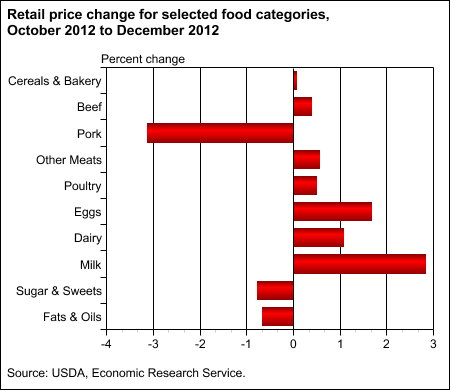
In the final three months of 2012, higher field corn prices resulting from the Midwest drought began to show up on supermarket shelves. From October to December, while the all-items CPI fell 0.8 percent and overall food-at-home prices increased only 0.2 percent, prices rose for most foods that rely heavily on corn-based animal feed—beef, pork, poultry, other meats, eggs, and dairy products. Milk prices rose nearly 3 percent while egg prices increased 1.7 percent. Prices for beef, poultry, and other meats all rose by about 0.5 percent. The only animal-based category defying this trend is pork, where rising inventories and falling exports have caused retail prices to drop from historically high levels in early 2012. ERS forecasts prices for all meat and animal-based products to increase steadily through the first half of 2013. More information on food price changes and forecasts can be found in the Food Price Outlook data product, updated January 2013.
Thursday, February 7, 2013
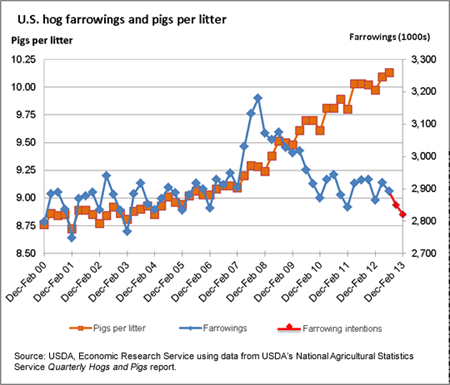
The U.S. pork industry registered another year of strong productivity gains in 2012. Since 1990, pork production has increased by more than 52 percent, while the U.S. inventory of breeding sows has decreased by more than 15 percent. A primary source of pork industry productivity gains is increasing litter rates, which have more than offset declining sow numbers. Because of the growth in sow efficiency, the industry can produce the same or greater number of pigs with fewer sows. The dramatic increase in litter rates beginning in 2007 is mostly attributed to advances in breeding herd genetics and improvements in the management and care for sows during gestation and farrowings. Since 2007, the hog industry has enhanced its selective breeding methods to develop sows that produce and nurture more piglets. At the same time, a larger share of swine producers utilized the latest housing technologies and labor practices, improving the comfort and survivability of sows and their piglets, hence contributing to larger hog production. This is an update of a chart from Livestock, Dairy, and Poultry Outlook, LDPM-220, October 2012.
Thursday, November 29, 2012
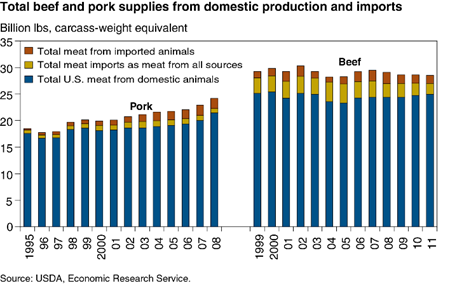
While it is relatively easy to track U.S. meat and livestock imports, it is more difficult to estimate the amount of meat produced in the United States from animals that originated abroad. Foreign-born cattle accounted for an average of 8.1 percent of total monthly U.S. beef production over the last 13 years. When that amount is added to the annual average of 2.9 billion pounds of beef and veal imported from all foreign sources, almost 16 percent of annual U.S. beef and veal supplies is estimated to originate abroad. From 1995 through 2008, Canadian hogs contributed about 93 million pounds per year to U.S. pork supplies. When this amount is combined with the 895 million pounds of pork imported by the U.S. each year, foreign sources are estimated to account for about 8.4 percent of total U.S. pork supplies. This chart appears in "How Much U.S. Meat Comes From Foreign Sources?" in the September 2012 issue of ERS's Amber Waves magazine.
Friday, June 15, 2012
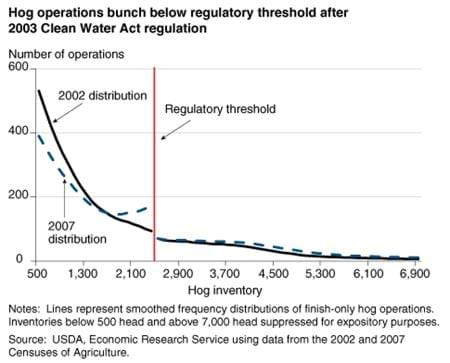
In 2003, the U.S. Environmental Protection Agency strengthened Federal Clean Water Act (CWA) regulations governing the handling and application of manure by livestock operations. An important and unchanging feature of these CWA regulations is that operations confining more than a specific number of livestock face more stringent rules. Using U.S. Census of Agriculture data from 2002 and 2007, changes in the size distribution of hog farm operations in years before and after the stricter 2003 regulations can be identified. The distribution varies smoothly across the regulatory threshold of 2,500 hogs prior to the 2003 CWA rules, but shows a sharp discontinuity at the 2,500 head threshold by 2007. The unexpectedly large number of farms located just below the regulatory threshold in 2007 suggests that some livestock facility operators may be controlling the size of their hog inventories to avoid the costs of regulation. This chart is found in the June 2012 issue of Amber Waves magazine.


