ERS Charts of Note
Subscribe to get highlights from our current and past research, Monday through Friday, or see our privacy policy.
Get the latest charts via email, or on our mobile app for  and
and 
Monday, June 7, 2021
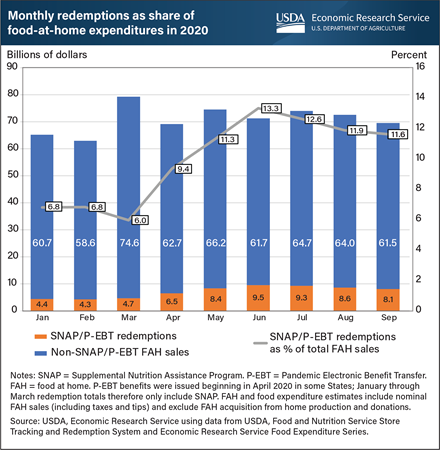
Shutdowns, stay-at-home orders, and the need for social distancing led households to buy more food for consumption at home during the Coronavirus (COVID-19) pandemic. In response to the economic downturn and pandemic conditions, supplemental emergency allotments were issued to Supplemental Nutrition Assistance Program (SNAP) households and Pandemic Electronic Benefit Transfer (P-EBT) benefits were distributed to households with children missing free and reduced-price school meals. This expansion of nutrition assistance led to a rapid increase in the dollar amount of these benefits issued to households and redeemed for food at home (FAH). In January and February 2020, SNAP benefit redemptions accounted for 6.8 percent of total FAH expenditures as estimated by the Food Expenditure Series. In March 2020, FAH spending spiked, causing SNAP’s share of FAH spending to fall. From March to June 2020, the introduction of P-EBT and increase in SNAP benefits led to rapid growth in these programs’ share of FAH spending. In June 2020, redemptions of these benefits peaked at $9.5 billion—making up 13.3 percent of FAH spending that month. This share fell the following three months. Overall, the share of total FAH spending attributable to SNAP and P-EBT from April through September 2020 was 11.7 percent—more than one in nine dollars and nearly 5 percentage points higher than SNAP’s share over the same months in 2019. This chart is based on a chart in the USDA, Economic Research Service’s COVID-19 Working Paper: Supplemental Nutrition Assistance Program and Pandemic Electronic Benefit Transfer Redemptions during the Coronavirus Pandemic, released March 2021.
Friday, April 16, 2021
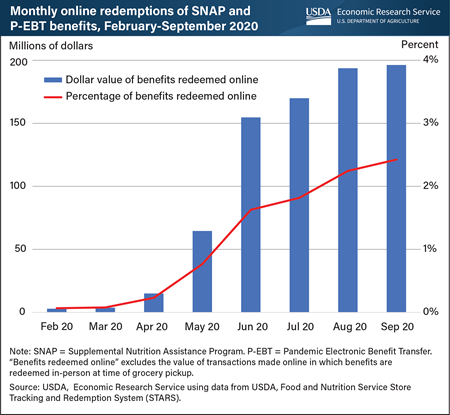
The Supplemental Nutrition Assistance Program (SNAP) Online Purchasing Pilot began in 2019 as mandated by the 2014 Farm Act and was quickly expanded in 2020 in response to the COVID-19 pandemic. The pilot allows households in participating States to use their SNAP benefits to purchase groceries online from a limited number of authorized retailers. Households can similarly use Pandemic Electronic Benefit Transfer (P-EBT) benefits, which were issued in 2020 to households with children missing free and reduced-price school meals during the pandemic. Online transactions using benefits are subject to the same requirements as in-person transactions and cannot be spent on tips or fees. The number of States where SNAP and P-EBT benefits could be redeemed online grew from just one State at the beginning of 2020 to 46 States by the end of September 2020. As availability increased and the pandemic necessitated continued social distancing, the value of SNAP and P-EBT benefits redeemed online increased. In February 2020, households redeemed less than $3 million in benefits online, accounting for less than 0.1 percent of all benefits redeemed. By September, this amount grew to $196 million — 67 times its value in February. Overall, households redeemed $801 million in benefits online from February to September 2020. Despite this rapid growth, online redemptions accounted for only 2.4 percent of all benefits redeemed in September. This chart is based on a chart in the USDA, Economic Research Service’s COVID-19 Working Paper: Supplemental Nutrition Assistance Program and Pandemic Electronic Benefit Transfer Redemptions during the Coronavirus Pandemic, released March 2021.
Thursday, April 8, 2021
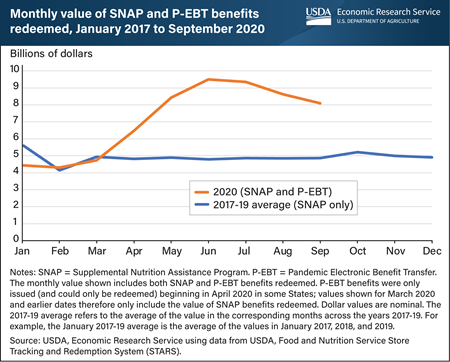
The U.S. Government expanded existing food assistance programs and introduced new ones in response to the COVID-19 pandemic and subsequent economic contraction in the United States in 2020. Some States began issuing monthly supplemental emergency allotments to Supplemental Nutrition Assistance Program (SNAP) households in March 2020, with the rest beginning to do so in April 2020. All States issued Pandemic Electronic Benefit Transfer (P-EBT) benefits to households with children who missed free or reduced-price school meals during the 2019-20 school year; the earliest States began issuing P-EBT benefits in April 2020. This led to a rapid increase in the dollar amount of food assistance benefits issued to households and redeemed for groceries during the pandemic. The value of total monthly redemptions roughly doubled from $4.7 billion in March 2020 to $9.5 billion in June 2020. Most P-EBT benefits for the 2019-20 school year were issued in May and June 2020, leading total redemptions to peak in June and decline over the next three months. By September, redemptions amounted to $8.1 billion. Overall, an average of $8.4 billion per month in combined SNAP and P-EBT benefits were redeemed from April through September 2020—an increase of 74 percent compared with the average value of benefits redeemed during the same 6 months in 2017-19. This chart is based on a chart in the USDA, Economic Research Service’s COVID-19 Working Paper: Supplemental Nutrition Assistance Program and Pandemic Electronic Benefit Transfer Redemptions during the Coronavirus Pandemic, released March 2021.
Wednesday, March 24, 2021
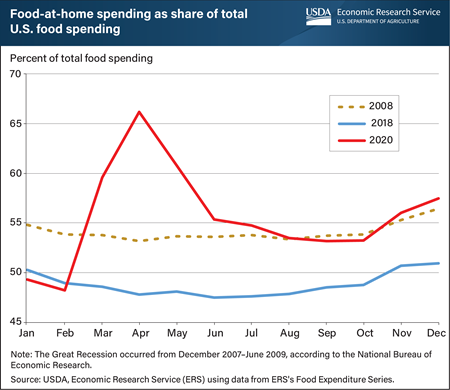
The share of food dollars spent at grocers, supercenters, and other food-at-home (FAH) retailers in the United States rose in 2020 above Great Recession levels in 2008 as the COVID-19 pandemic disrupted the way people consumed food. The share of spending at FAH establishments began a sharp climb from 48 percent in February 2020, and by April 2020, 66 percent of food spending was devoted to at-home consumption. Shifts to greater FAH spending occurred as states issued stay-at-home mandates and people generally avoided public gatherings. The economic recession likely exacerbated this shift as FAH purchases are more cost-efficient. Even after its April 2020 peak, the share of FAH spending reached the same level in August 2020 as it was in August 2008, during the Great Recession. After that, food spending shares generally followed typical seasonal patterns, although at a level more like the Great Recession than 2018, remaining stable with a slight increase in FAH spending in the colder, winter months. ERS researchers will continue to examine food expenditure data to determine whether this change will endure beyond the pandemic and recession. The data for this chart come from the USDA, Economic Research Service’s Food Expenditure Series data product.
Friday, December 18, 2020
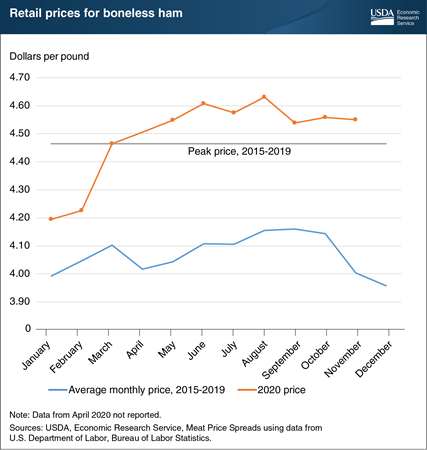
Ham is often served as a centerpiece on the holiday table. Grocery stores frequently feature hams in November and December, and consumers may choose between bone-in or boneless hams. Those who opt for the convenience of boneless hams may be paying higher prices than they have in recent years. Retail ham prices are generally lower in November and December than in other months of the year, but retail ham prices have been high throughout most of 2020. The March 2020 boneless ham price of $4.46 per pound as reported by the Bureau of Labor Statistics (BLS) tied the highest reported price from 2015 to 2019. While BLS did not report a boneless ham price in April, the reported prices for the rest of 2020 were above that previous high. USDA’s Economic Research Service uses prices like these from BLS to report on price spreads—the difference between what consumers pay for a certain type of meat at a retail store and what producers actually receive for that meat. These spreads are used to analyze the demand for meat products such as ham, and consequently, the value of hogs and other livestock. This chart is drawn from Economic Research Service’s Meat Price Spread Data, December 2020.
Wednesday, October 28, 2020
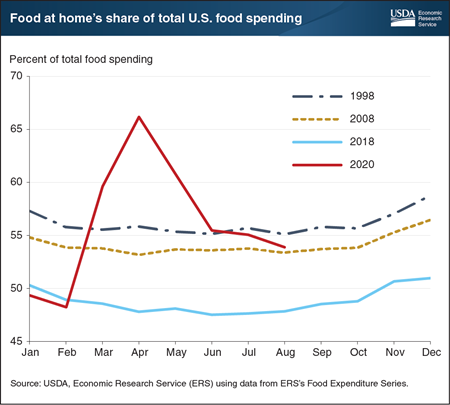
The share of U.S. food expenditures occurring at grocery stores, supercenters, and other food-at-home retailers typically displays a consistent seasonal pattern. U.S. consumers devote relatively more money to food-at-home spending in the winter months—a time of Thanksgiving and holiday gatherings. The summer months see the highest share of spending at food-away-from-home places such as restaurants, cafeterias, and other eating-out places. While seasonal patterns have stayed constant until 2020, the share of total food spending dedicated to food at home has not. In 1998, food at home’s share was above 55 percent of total food spending throughout the year. Ten years later, 2008 saw the share of food spending devoted to food at home decrease a few percentage points despite the Great Recession of 2007-2009. In 2018, food at home’s share was below 50 percent in all but the winter months. The COVID-19 pandemic has upended past seasonal trends and expanded food at home’s share of total food spending. Food at home in August 2020 accounted for 54 percent of total food spending, after peaking at 66 percent in April 2020. The data for this chart come from the Economic Research Service’s Food Expenditure Series data product, updated October 16, 2020.
Thursday, November 21, 2019
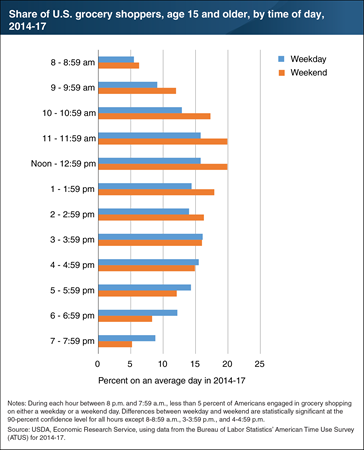
In a recently released report, ERS researchers used data for 2014-17 from the Bureau of Labor Statistics’ annual American Time Use Survey (ATUS) to provide a snapshot of when Americans grocery shop on weekdays versus weekends. Saturdays and Sundays are somewhat more popular days for grocery shopping than weekdays. Over an average weekday in 2014-17, 13 percent of Americans age 15 and older engaged in grocery shopping, and 16 percent grocery shopped over an average weekend in 2014-17. The peak times for grocery shopping during a weekday were 11 am to 12:59 p.m. and 3 p.m. to 3:59 p.m. Of those grocery shopping on a weekday, 16 percent did so in each of those 3 hours. On weekends, grocery shopping peaked during 11 a.m. to 12:59 p.m., with 20 percent of those shopping on a Saturday or Sunday doing so during each of these 2 hours. A version of this chart appears in the ERS report, Food-Related Time Use: Changes and Demographic Differences, November 2019.
Tuesday, September 24, 2019
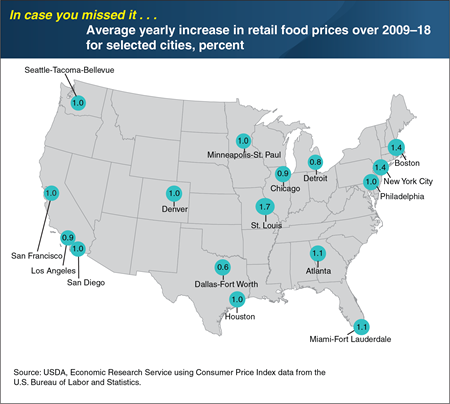
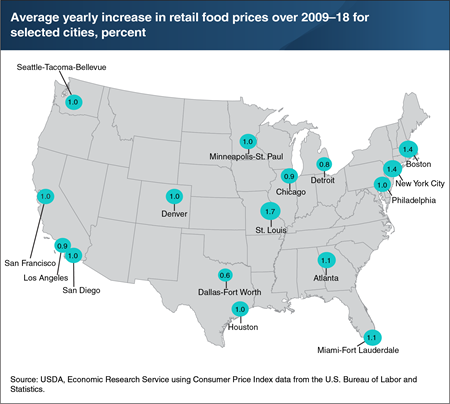
Between 2009 and 2018, retail food prices rose an average of 1.2 percent per year nationally. However, food-at-home price inflation varies by geographic location. Over the same 10-year period, retail food prices rose an average of 1.7 percent per year in St. Louis, while prices in Dallas rose on average 0.6 percent per year. Averaging 10 years of annual data smooths out year-to-year “noise”—volatile price swings that obscure the bigger picture of relative food price increases by city. Different rates of change in transportation costs and retail overhead expenses, such as labor and rent, can explain some of the variation among cities because cost increases are often passed along to the consumer in the form of higher grocery prices. Furthermore, differences in consumer food preferences among cities for specific foods may help explain variation in inflation rates. For example, a city whose residents strongly preferred foods with little price inflation (such as pork and poultry at 1.4 and 1.5 percent per year, respectively, in 2009–2018) might have had a lower 10-year average inflation level than a city whose residents purchased more beef or veal, which increased an average of 3.4 percent per year in 2009–2018. This chart appears in an ERS data visualization, Food Price Environment: Interactive Visualization, released March 2019. This Chart of Note was originally published March 28, 2019.
Thursday, March 28, 2019
Between 2009 and 2018, retail food prices rose an average of 1.2 percent per year nationally. However, food-at-home price inflation varies by geographic location. Over the same 10-year period, retail food prices rose an average of 1.7 percent per year in St. Louis, while prices in Dallas rose on average 0.6 percent per year. Averaging 10 years of annual data smooths out year-to-year “noise”—volatile price swings that obscure the bigger picture of relative food price increases by city. Different rates of change in transportation costs and retail overhead expenses, such as labor and rent, can explain some of the variation among cities because cost increases are often passed along to the consumer in the form of higher grocery prices. Furthermore, differences in consumer food preferences among cities for specific foods may help explain variation in inflation rates. For example, a city whose residents strongly preferred foods with little price inflation (such as pork and poultry at 1.4 and 1.5 percent per year, respectively, in 2009–2018) might have had a lower 10-year average inflation level than a city whose residents purchased more beef or veal, which increased an average of 3.4 percent per year in 2009–2018. This chart appears in an ERS data visualization, Food Price Environment: Interactive Visualization, released March 2019.
Tuesday, November 27, 2018
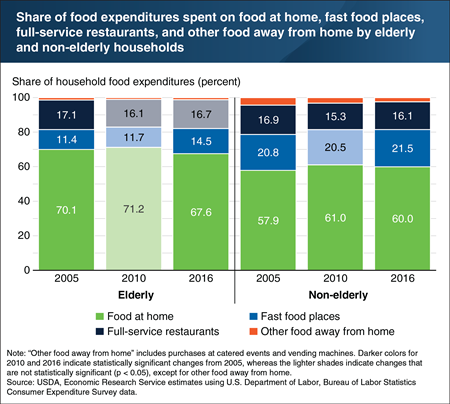
Elderly households (those with at least one individual age 65 or older) tend to be less affected by economic downturns, possibly because they have more fixed incomes from Social Security or pensions that do not depend on employment. Using data from the Bureau of Labor Statistics’ Consumer Expenditure Survey, ERS researchers found that from 2005 to 2010, elderly households did not significantly change their share of food spending allocated to grocery stores and other food-at-home retailers or their share allocated to eating-out options. By 2016, elderly households had reduced their share of food-at-home expenditures by about 3 percentage points and increased their share of spending at fast-food places, although the fast-food share remained below that of non-elderly households. In contrast to elderly households, non-elderly households spent less of their food budgets at full-service restaurants and more on food at home in 2010 and 2016 than in 2005. This chart appears in “Food Spending of Middle-Income Households Hardest Hit by the Great Recession” from ERS’s Amber Waves magazine, September 2018.
Tuesday, June 19, 2018
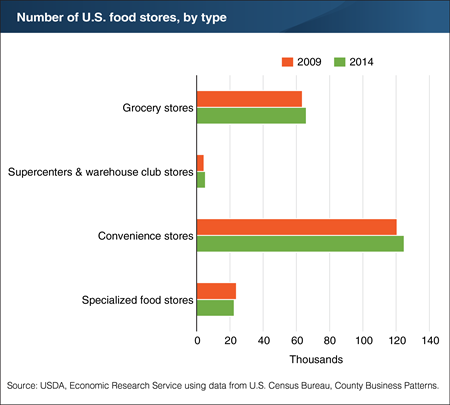
The numbers of different types of food stores and changes in those numbers over time have implications for the economic well-being of communities for reasons related to employment opportunities, tax revenues, and business development. Between 2009 and 2014, the number of grocery stores in the United States grew by 4 percent to 65,975, and the number of convenience stores grew by 4 percent as well to 124,879. Supercenters and warehouse club stores saw their numbers jump by 18 percent to 5,307 stores in 2014, while specialized food stores (bakeries, seafood markets, dairy stores, etc.) saw a 6-percent decline in store numbers. Preference for one-stop shopping by some consumers may be influencing the increase in supercenters and warehouse club stores and the decline in specialized food stores. ERS’s Food Environment Atlas provides a spatial overview of a county’s food retailing landscape by mapping the number and density of these four store types. This chart is from “County-Level Data Show Changes in the Number and Concentration of Food Stores” in the May 2018 issue of ERS’ Amber Waves magazine.
Wednesday, February 28, 2018
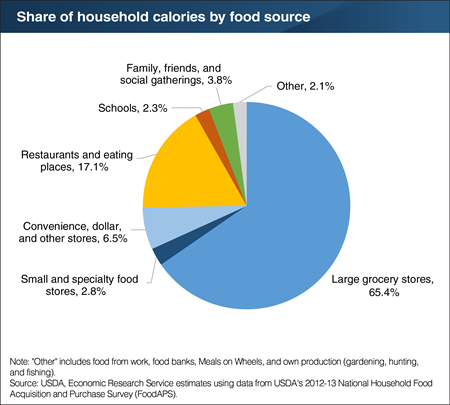
Americans acquire food from many sources—supermarkets, convenience stores, fast food outlets, and more. But in practice, large grocery stores dominate. A recent ERS analysis of household-level data from USDA’s National Household Food Acquisition and Purchase Survey (FoodAPS) found that three-quarters of U.S. households’ calories came from retail stores, with supermarkets, supercenters, and other large grocers providing 65 percent of calories by themselves. Small and specialty food stores like bakeries and farmers’ markets supplied 3 percent of calories and 6.5 percent came from convenience stores, dollar stores, and other stores. Restaurants and other eating places provided 17 percent of household calories. ERS researchers used the detailed FoodAPS data to calculate the nutrient value of food acquisitions and found that the overall nutritional quality of foods purchased at large grocery stores was higher than that of foods purchased at other retail outlets or restaurant and fast-food establishments. A version of this chart appears in the ERS report, Nutritional Quality of Foods Acquired by Americans: Findings from USDA’s National Household Food Acquisition and Purchase Survey, released on February 21, 2018.
Friday, February 9, 2018
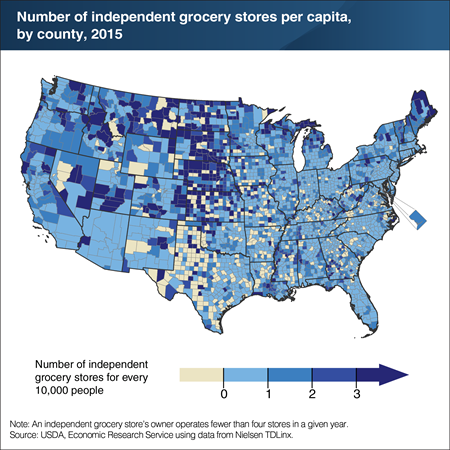
To examine the number and location of independent grocery stores, a recent ERS study used Nielsen’s TDLinx data on grocery stores—stores with a full line of major food departments and at least $1 million in sales. Independent grocery stores are those whose owners operate fewer than four stores. In 2015, 21,510 independent grocery stores generated $70 billion in sales, or 11 percent of U.S. grocery sales. The study found that independent grocery stores outnumber chain grocery stores in remote rural counties not adjacent to urban counties. In 2015, remote rural counties had an average of 2.1 independent grocery stores compared with 1.9 chain grocery stores. Of the 319 U.S. counties with more than three independent grocery stores for every 10,000 residents, 91 percent of them were remote rural counties or rural counties adjacent to an urban county. Close to half of these 319 counties were located in Nebraska, Kansas, South Dakota, North Dakota, and Montana. This map appears in "Despite Slow Growth From 2005 to 2015, Independent Grocery Stores Remain Important for Rural Communities" from the February 2018 issue of ERS’s Amber Waves magazine.
Thursday, January 11, 2018
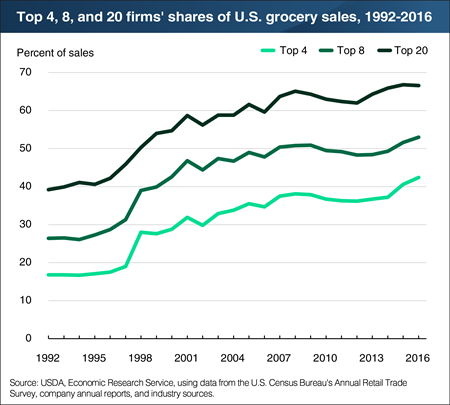
In 2016, the share of U.S. grocery sales held by the largest four and eight food retailers rose for the fourth consecutive year. Sales by the 20 largest food retailers totaled $515.3 billion in 2016 and accounted for nearly two-thirds of U.S. grocery sales. The shares of food industry retail sales recorded by the largest 4, 8, and 20 supermarket and supercenter retailers resumed their long-term trend of increased sales concentration in 2013 after decreasing slightly following the 2007-09 recession. Publix lost its spot in the top four food retailers in 2016 to Ahold Delhaize, which joined Walmart, Kroger, and Albertson’s. Much of the change in industry structure during the last few years was largely due to the impact of two big mergers—the acquisitions of Safeway by Albertson’s in 2015 and of Delhaize by Ahold the following year. Kroger has maintained its ranking, in part, by acquiring a number of smaller retailers such as Harris Teeter and Roundy’s during the last few years. Since 2013, 3 regional food retailers have joined the ranks of the top 20 due to mergers and A&P exiting the industry. A version of this chart appears on the Retailing and Wholesaling topic page on the ERS Web site, updated December 7, 2017.
Tuesday, November 28, 2017
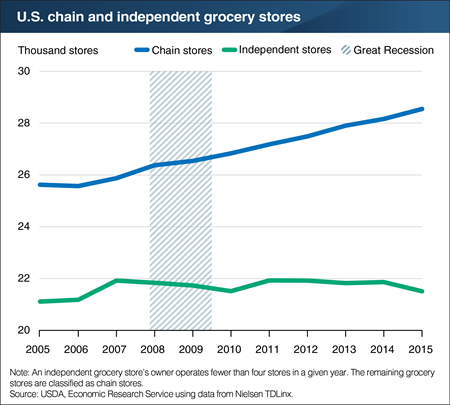
From 2005 to 2015, according to Nielsen’s TDLinx data, the number of grocery stores in the United States grew from 46,735 to 50,056—an increase of 7.1 percent. Grocery stores are defined as self-service stores with a full line of major food departments and at least $1 million in sales. At the onset of the Great Recession of 2007-09, the number of independent grocery stores—those whose owners operate fewer than four stores at one time—flattened out at around 21,800 stores. The remaining grocery stores, or chain stores, grew in number by about 2,700 stores to 28,546 in 2015. As a result, independent stores’ share of total stores declined from 46 percent in 2007 to 43 percent in 2015. Independent grocery stores are generally smaller than chain stores but are often the only grocery stores found in underserved areas. ERS analysis found that over the decade, both independent and chain stores increased in counties with population growth, although chain stores were more responsive. This chart is from the ERS report, Independent Grocery Stores in the Changing Landscape of the U.S. Food Retail Industry, released on November 22, 2017.
Monday, May 8, 2017
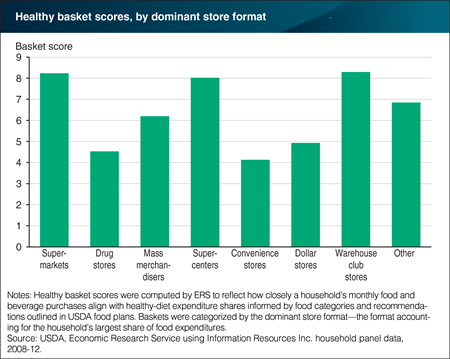
Over the past two decades, some store formats—including supercenters, dollar stores, and warehouse club stores—have increased their share of Americans’ spending on “at-home food”—food and beverages purchased from retail stores. Shifts between store formats could have implications for shopping patterns. A recent ERS study computed “healthy basket” scores for monthly at-home food and beverage purchases. The higher the score, the closer a household’s purchases aligned with healthy-diet expenditure shares. Baskets were categorized by the format accounting for the household’s largest share of food expenditures. Scores were highest for households predominantly shopping at warehouse club stores (8.3), supermarkets (8.2), and supercenters (8.0). Household food baskets dominated by purchases from drug stores, convenience stores, and dollar stores had the least healthful purchases. Over 2008-12, an average of 67 percent of households in the data predominantly shopped at supermarkets, 17 percent at supercenters, and 6 percent at warehouse club stores. The other 10 percent shopped predominately at drug, dollar, convenience, and other store formats. This chart appears in "Households Purchase More Produce and Low-Fat Dairy at Supermarkets, Supercenters, and Warehouse Club Stores" in ERS’s Amber Waves magazine, May 2017.
Tuesday, May 2, 2017
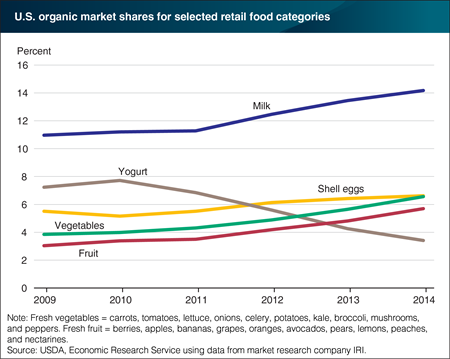
While U.S. organic food sales account for a small share of the country’s total food sales, they exhibited double-digit growth during all but 3 years (2009-11) during 2000-14. ERS analysis of U.S. organic sales data for five retail food categories shows that the organic market share increased for four of the five categories between 2009 and 2014. The highest organic market share in 2014 was for milk (14 percent of total organic and nonorganic sales), followed by eggs and fresh vegetables (both at nearly 7 percent). Foods frequently fed to children, like milk, tend to have higher organic market share than other foods. Industry estimates find that the organic fresh fruit and vegetable category has the highest sales of all organic categories, but their share of total produce sales is smaller than for milk. The decline in market share of organic yogurt between 2010 and 2014 may reflect growing nonorganic sales of Greek-style yogurt and yogurt drinks—products that were not readily available in organic forms. This chart appears in "Growing Organic Demand Provides High-Value Opportunities for Many Types of Products" in the February 2017 issue of ERS’s Amber Waves magazine.
Monday, April 10, 2017
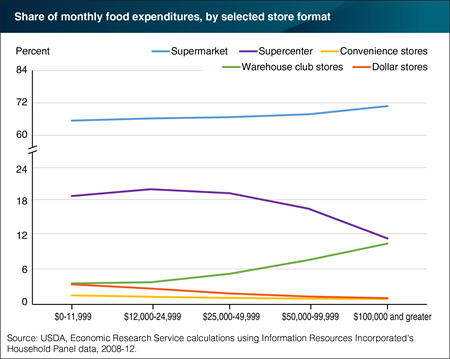
The U.S. food retailing sector offers a variety of store formats for purchasing at-home foods and beverages. A recent ERS analysis of 2008-12 data found that some formats are more popular with lower or higher income consumers than others. The study found that as income rose, households spent a larger share of their at-home food expenditures at supermarkets and warehouse club stores. Supermarkets accounted for 65.4 percent of food expenditures for consumers with annual incomes below $12,000 compared with 70.8 percent for consumers with incomes of $100,000 and above. Warehouse club stores, with membership fees and large package sizes, accounted for 10.2 percent of food spending for the highest income group, but only 3 percent of expenditures for the lowest income group. Supercenters, which sell a wide range of products and have a full supermarket, accounted for 18.9 percent of the lowest income group’s food expenditures, compared with 11.2 percent for the highest income group. Convenience and dollar stores—small segments of at-home food spending—also accounted for a larger share of food expenditures by lower income consumers. This chart appears in the ERS report, Store Formats and Patterns in Household Grocery Purchases, released March 22, 2017.
Friday, November 18, 2016
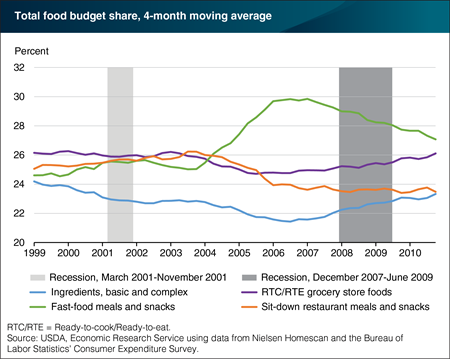
A recent ERS analysis found that between 1999 and 2006, the share of the average household food budget allocated to basic and complex ingredients fell steadily from around 24.7 to 20.8 percent, but then began to climb reaching 24.2 percent in 2010. Basic ingredients, such as milk and fresh meats, and complex ingredients, such as mayonnaise and bread, are grocery store foods used to prepare a meal or snack. The food budget share—defined as total expenditures at grocery stores and eating-out places—spent on ready-to-cook and ready-to-eat grocery store foods followed a somewhat similar, but muted, pattern. The upturn in food budget share devoted to ingredients and ready to eat/cook grocery foods began almost a year before the 2007-09 recession and its aftermath—a time when many consumers cut back on eating out, especially fast food meals and snacks. The share of the total food budget spent in fast-food outlets where customers order and pay at a counter grew until 2007 to 30.6 percent, then declined to 25.7 percent in 2010. This chart appears in “Purchases of Foods by Convenience Type Driven by Prices, Income, and Advertising” in the November 2016 issue of ERS’s Amber Waves magazine.
Monday, August 1, 2016
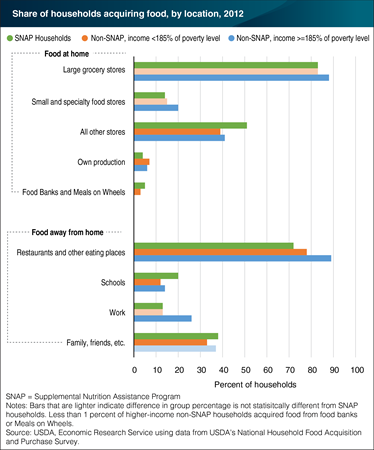
Understanding where U.S. households acquire food, what they acquire, and what they pay is essential to identifying which food and nutrition policies might improve diet quality. USDA’s National Household Food Acquisition and Purchase Survey (FoodAPS) provides a complete picture of these key aspects during a 7-day period in 2012 by including both food at home and food away from home acquisitions. Higher-income households are more likely to visit large grocery stores (88 versus 83 percent) and small or specialty food stores (20 versus 14-15 percent) than households that participate in USDA’s Supplemental Nutrition Assistance Program (SNAP) and lower-income non-SNAP households. SNAP households are more likely to report an acquisition in the ‘all other stores’ category compared with both non-SNAP groups (51 versus 39-41 percent), which includes convenience stores, gas stations, and pharmacies. Considering food away from home, SNAP households are least likely to visit restaurants/other eating places when compared to lower-income non-SNAP and higher-income households. In addition, a larger share of SNAP households obtain food from schools (20 percent) than lower-income non-SNAP households (12 percent) and higher-income households (14 percent). Finally, higher-income households are twice as likely to get food from work than the other two groups, which is not surprising given their greater employment rates. The data for this chart can be found in the ERS report, Where Households Get Food in a Typical Week: Findings from USDA’s FoodAPS, released on July 27, 2016.


