ERS Charts of Note
Subscribe to get highlights from our current and past research, Monday through Friday, or see our privacy policy.
Get the latest charts via email, or on our mobile app for  and
and 
Thursday, February 18, 2021
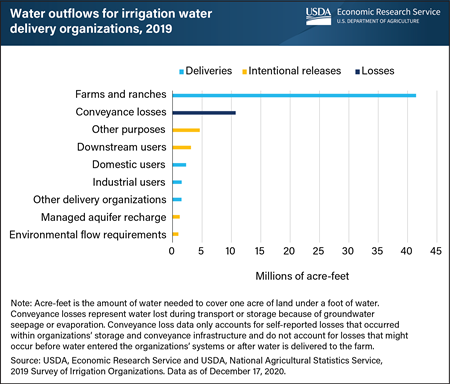
According to USDA’s 2019 Survey of Irrigation Organizations, irrigation delivery organizations such as irrigation districts and ditch companies supplied an estimated 41.4 million acre-feet of off-farm water to U.S. farms and ranches in 2019. These organizations also delivered water to other customers: 2.3 million acre-feet to domestic users, 1.5 million acre-feet to industrial users, and 1.5 million acre-feet to other irrigation organizations. In addition, organizations intentionally released water from their systems for other purposes, including 3.1 million acre-feet for downstream users, 1.2 million acre-feet for managed groundwater recharge, and 1.0 million acre-feet to meet environmental requirements. Beyond these intentional deliveries and releases, a total of 10.7 million acre-feet of water left organization systems as conveyance losses, which represents water lost to groundwater seepage or evaporation during transport or storage. This implies an average conveyance loss rate of 16 percent. As the second largest outflow from water delivery systems, reducing conveyance losses is an important focus for water conservation efforts. However, hydrologic systems are complex natural systems, so conveyance losses in many cases provide benefits elsewhere in the environment. For example, conveyance losses may provide unmanaged groundwater recharge or indirect flows into surface water systems that can support wildlife habitat. This chart is based on data found in USDA’s Survey of Irrigation Organizations, updated December 17, 2020.
Monday, February 8, 2021
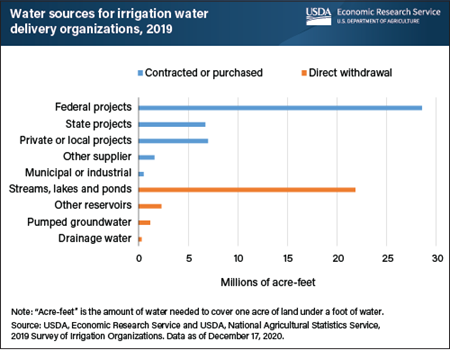
USDA’s 2019 Survey of Irrigation Organizations identified 2,543 irrigation organizations that delivered off-farm water directly to U.S. farms and ranches, including irrigation districts, ditch companies, acequias, and similar entities. Water is measured in “acre-feet,” or the amount of water needed to cover one acre of land under a foot of water. Irrigation delivery organizations obtained their water supplies, which totaled more than 70 million acre-feet, from a variety of sources. About 29 million acre-feet came from Federal water projects, which are large water storage and distribution systems built and maintained by the Bureau of Reclamation, the Army Corps of Engineers, and the Bureau of Indian Affairs. Irrigation organizations diverted an additional 22 million acre-feet directly from natural water bodies, such as rivers, streams, lakes, and ponds. The next largest sources of water were State water projects and private or local water projects, which delivered a combined 14 million acre-feet of water to organizations in 2019. Other water sources include water from other reservoirs, often owned by the organizations themselves (2 million acre-feet); water purchased or contracted from other suppliers (2 million acre-feet); groundwater pumped from well fields into water conveyance infrastructure (1 million acre-feet); water obtained directly from municipal and industrial suppliers (0.5 million acre-feet); and water captured from agricultural drainage systems (0.3 million acre-feet). This chart is based on data found in USDA’s Survey of Irrigation Organizations, updated December 17, 2020.
Friday, January 15, 2021
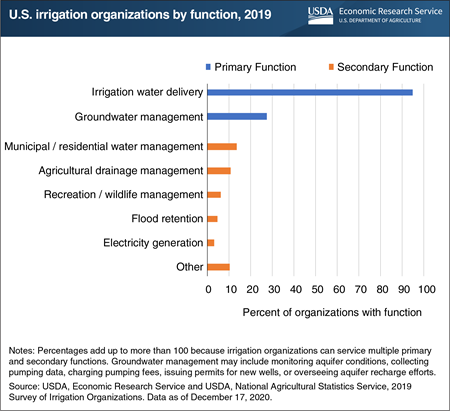
The 2019 Survey of Irrigation Organizations (SIO), jointly conducted by USDA’s Economic Research Service and National Agricultural Statistics Service, collected information about different types of organizations involved in the local management of water supplies for irrigated farms and ranches. Irrigation organizations directly influence on-farm water use through delivery of irrigation supplies and management of groundwater withdrawals. According to the survey’s data, in 2019, there were an estimated 2,677 irrigation organizations in the 24 States where most U.S. irrigation occurred. About 95 percent of these organizations—such as irrigation districts and ditch companies—had a primary function of delivering water directly to farms, typically through a system of irrigation storage facilities, canals, pipelines, acequias, and ditches. About 27 percent of organizations were involved in at least some aspect of groundwater management as a primary function, with 23 percent of organizations engaging in both water delivery and groundwater management. Groundwater management may include monitoring aquifer conditions, collecting pumping data, charging pumping fees, issuing permits for new wells, or overseeing aquifer recharge efforts. Some irrigation organizations perform secondary functions, such as delivering water to municipal and residential users (14 percent of organizations); managing agricultural water drainage (11 percent); and generating electricity (3 percent). This chart is based on data found in USDA’s Survey of Irrigation Organizations, updated December 17, 2020.
Wednesday, October 21, 2020
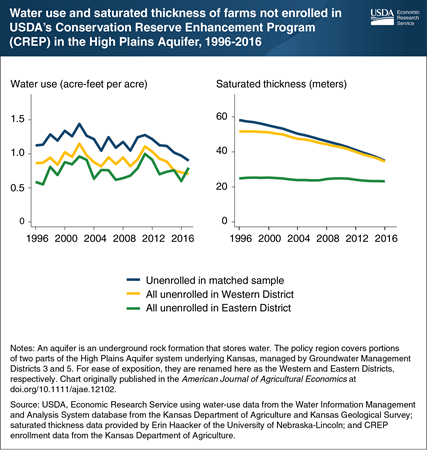
Agriculture in the semi-arid region overlying the High Plains Aquifer, which spans parts of eight states, relies on groundwater. In several areas, significantly more groundwater is extracted than is returned to the aquifer each year, leading to declining water levels. In Kansas, USDA’s Conservation Reserve Enhancement Program (CREP) specifically focuses on retiring irrigated cropland to reduce stress on limited water resources. To represent the amount of water that retired rights would have used in the absence of CREP, in effect the amount of use reduced by the program, ERS researchers used a group of 98 unenrolled farmers similar to 98 enrolled farmers based on factors like farm size, crops grown, and soil quality. Trends of unenrolled matched farmers are largely representative of the average unenrolled farmer in the Western District, where most enrollments have occurred, and which has experienced the most significant aquifer depletion. From 1996 to 2017, unenrolled matched farmers decreased their water use by 0.94 percent a year relative to 1996 levels, compared to 0.64 percent a year for the average unenrolled farmer in the Western District. Furthermore, although unenrolled matched farmers initially experienced more rapid depletion, declines in saturated thickness have been very similar for the two groups since 2008. This chart appears in the October 2020 Amber Waves feature, “Incentives to Retire Water Rights Have Reduced Stress on the High Plains Aquifer.”
Wednesday, August 12, 2020
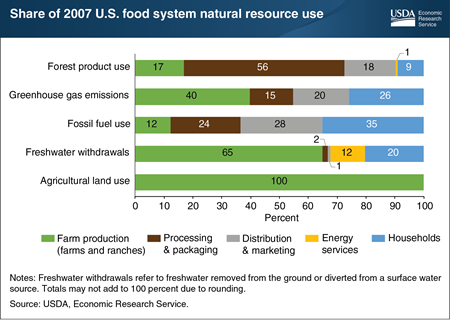
Knowing where natural resource use accumulates is fundamental to understanding what factors influence resource-use decisions. A recent Economic Research Service (ERS) study estimated natural resource use by the U.S. food system in 2007 (2007 data were the latest available with the level of detail needed for the analysis). Farm production was the smallest user of fossil fuels (12 percent of fossil fuel use); households were the largest users (35 percent). Over 40 percent of greenhouse gas emissions in food production were from farms and ranches, followed by households, and then companies that distribute and market food. For forest products, the greatest use occurred during food processing and packaging, with paper-based packaging accounting for most of this use. Farm production was the dominant user of freshwater withdrawals due to irrigation, but slightly over a third of water use by the food system in 2007 occurred after the farm, including in household kitchens (20 percent) and in the energy industry (12 percent). This chart appears in the ERS report, Resource Requirements of Food Demand in the United States, and Amber Waves article, “A Shift to Healthier Diets Likely To Affect Use of Natural Resources,” May 2020.
Thursday, May 28, 2020
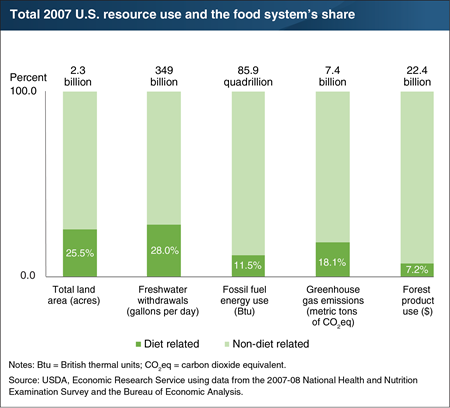
Conserving natural resources starts with identifying where they are used. A recent Economic Research Service (ERS) study examined how much of 5 of the Nation’s natural resources were used in 2007 to feed Americans aged 2 and above. (2007 data were the latest available with the level of detail needed for the analysis.) The researchers looked at the entire U.S. food system from production of farm inputs—such as fertilizers and feed—through points of consumer purchases in grocery stores and eating-out places to home kitchens. Their estimates show that agricultural land use in the U.S. food system was 25.5 percent of the country’s 2.3 billion acres of total land. Although the study does not account for other food-related land use, such as by forestry and mining industries serving the food system, it does show that about half of agricultural land is dedicated to food production for the U.S. market, and the other half was devoted to nonfood crops, like cotton and corn for producing ethanol, and to export crops, like soybeans. The U.S. food system also accounted for an estimated 28 percent of 2007’s freshwater withdrawals, 11.5 percent of the fossil fuel budget, and 7.2 percent of marketed forest products. Air is a natural resource that is degraded by the addition of greenhouses gases. The food system accounted for an estimated 18.1 percent of U.S. greenhouse gas emissions in 2007. A version of this chart appears in the ERS report, Resource Requirements of Food Demand in the United States, May 2020 and the Amber Waves feature article, “A Shift to Healthier Diets Likely To Affect Use of Natural Resources.”
Tuesday, August 27, 2019
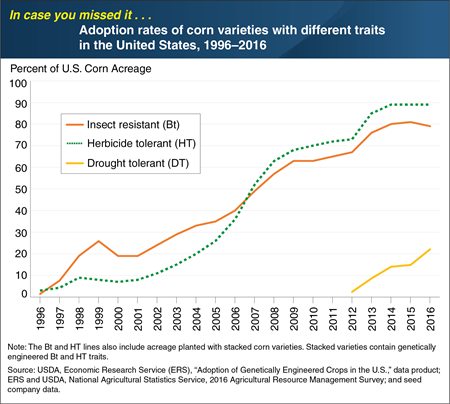
Droughts are among the most frequent causes of crop yield losses, failures, and subsequent crop revenue losses across the world. Genetically engineered (GE) and non-GE drought tolerance became broadly available in corn varieties between 2011 and 2013. By 2016, 22 percent of total U.S. corn acreage was planted with DT varieties. To better understand this growth rate, ERS researchers compared it to the adoption of GE herbicide-tolerant (HT) and insect-resistant (Bt) corn. Between 1996 and 2000, HT corn acreage increased from 3 to 7 percent of total U.S. corn acreage, while Bt corn acreage increased from just over 1 percent to 19 percent. By 2012, nearly 75 percent of U.S. corn acres were planted to varieties with at least one GE trait. In 2016, 91 percent of DT corn fields also had HT or Bt traits. Some evidence suggests that these three traits are complementary. For example, a corn crop will generally be less vulnerable to drought if it is not competing with weeds for water, and if its roots and leaves are not damaged by insect pests. This chart appears in the January 2019 ERS report, Development, Adoption, and Management of Drought-Tolerant Corn in the United States. This Chart of Note was originally published March 21, 2019.
Monday, July 29, 2019
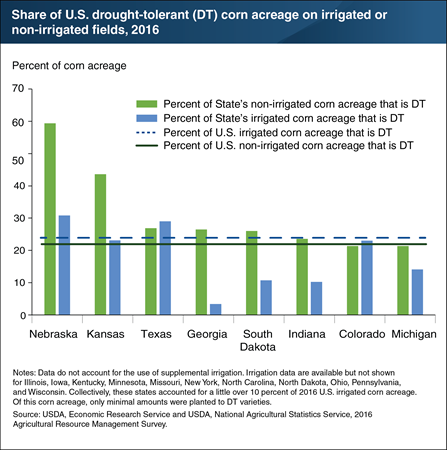
Droughts are among the most frequent causes of crop yield losses, failures, and subsequent crop revenue losses across the world. Farmers with access to ample sources of irrigation water can, at least partially, mitigate drought stress. Farmers can also plant drought-tolerant (DT) crop varieties—in 2016, DT varieties made up 22 percent of total U.S. corn acreage. DT traits improve the plant’s ability to take water up from soils and convert water into grain under a range of drought conditions. The use of irrigation does not preclude the use of DT corn. For example, nearly 31 percent of Nebraska’s irrigated fields were planted with DT varieties. Farmers’ decisions to irrigate their DT corn fields are influenced by many factors, including the extent of soil moisture deficits (if any), amount and timing of rainfall throughout the growing season, and irrigation expenses. However, most of the main U.S. corn producing States generally had higher levels of DT use on dryland fields. For example, 60 percent of non-irrigated fields in Nebraska were planted with DT varieties. This chart appears in the January 2019 ERS report, Development, Adoption, and Management of Drought-Tolerant Corn in the United States. Also see the article “Drought-Tolerant Corn in the United States: Research, Commercialization, and Related Crop Production Practices” from the March 2019 edition of ERS’s Amber Waves magazine.
Monday, June 10, 2019
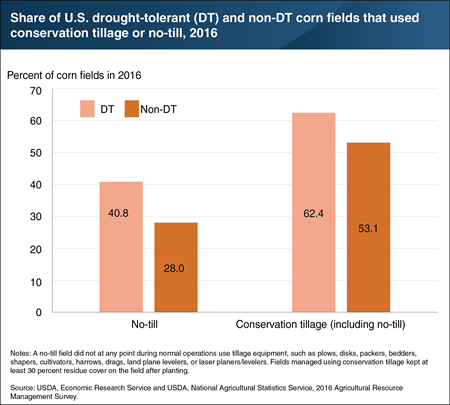
Droughts are among the most frequent causes of crop yield losses, failures, and subsequent crop revenue losses across the world. In 2016, 22 percent of total U.S. corn acreage was planted with drought-tolerant (DT) varieties. DT traits improve the plant’s ability to take water up from soils and convert water into plant matter. This creates a natural link between DT corn adoption and use of other water-management practices in corn production, such as conservation tillage and irrigation. Minimal disturbance of soils through conservation tillage makes more water available to the crop by reducing evaporation. No-till management—a conservation practice in which farmers do not disturb soils using tillage operations—was used on 41 percent of DT corn fields in 2016, compared to 28 percent of non-DT corn fields. Overall, conservation tillage (including no-till) was used on 62 percent of DT corn fields and 53 percent of non-DT corn fields that year. The higher adoption rates for DT corn suggest that producers may be using conservation tillage to complement the DT corn’s ability to conserve water. This chart appears in the January 2019 ERS report, Development, Adoption, and Management of Drought-Tolerant Corn in the United States. Also see the article “Drought-Tolerant Corn in the United States: Research, Commercialization, and Related Crop Production Practices” from the March 2019 edition of ERS’s Amber Waves magazine.
Thursday, March 21, 2019
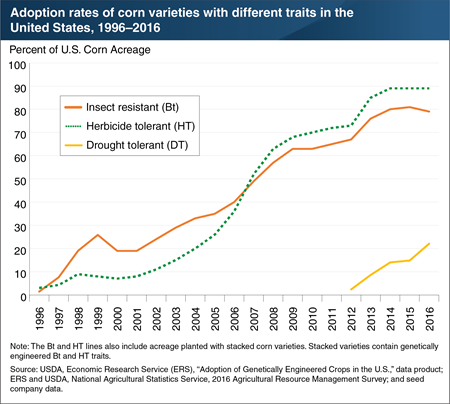
Droughts are among the most frequent causes of crop yield losses, failures, and subsequent crop revenue losses across the world. Genetically engineered (GE) and non-GE drought tolerance became broadly available in corn varieties between 2011 and 2013. By 2016, 22 percent of total U.S. corn acreage was planted with DT varieties. To better understand this growth rate, ERS researchers compared it to the adoption of GE herbicide-tolerant (HT) and insect-resistant (Bt) corn. Between 1996 and 2000, HT corn acreage increased from 3 to 7 percent of total U.S. corn acreage, while Bt corn acreage increased from just over 1 percent to 19 percent. By 2012, nearly 75 percent of U.S. corn acres were planted to varieties with at least one GE trait. In 2016, 91 percent of DT corn fields also had HT or Bt traits. Some evidence suggests that these three traits are complementary. For example, a corn crop will generally be less vulnerable to drought if it is not competing with weeds for water, and if its roots and leaves are not damaged by insect pests. This chart appears in the January 2019 ERS report, Development, Adoption, and Management of Drought-Tolerant Corn in the United States.
Monday, February 4, 2019
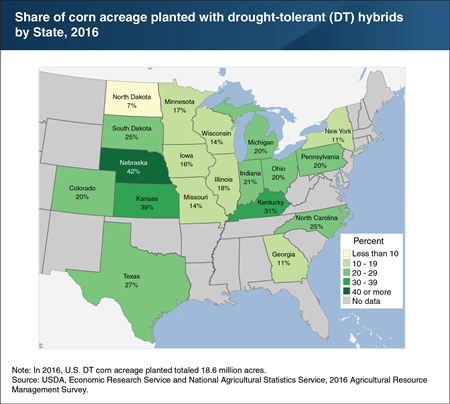
Droughts have been among the most significant causes of crop yield reductions and losses for centuries. Most crop farmers have limited options to reduce the damaging physical effects of drought. Although Federal disaster program and crop insurance payments tend to be higher during droughts, they typically do not fully compensate farmers for drought-related losses. Farmers with access to ample sources of irrigation water can, at least partially, mitigate drought stress: irrigation both provides water and cools the crop. However, many water-intensive crops, including corn, are mostly grown on non-irrigated cropland. Drought-tolerant (DT) corn was commercially introduced in 2011. By 2016, DT corn acreage made up 22 percent of total U.S. planted corn acreage, with the highest shares in drought-prone Nebraska (42 percent) and Kansas (39 percent). Regional differences in drought severity and how recently farmers had experienced drought significantly influenced the adoption of DT corn. For example, States with counties that had experienced at least one severe-or-worse drought between 2011 and 2015 had adoption rates of at least 25 percent. Northern corn-producing States—such as Minnesota, Wisconsin, and Michigan—experienced less severe droughts during this time period and had lower adoption rates, ranging from 14 to 20 percent. This chart appears in the January 2019 ERS report, Development, Adoption, and Management of Drought-Tolerant Corn in the United States.
Tuesday, January 2, 2018
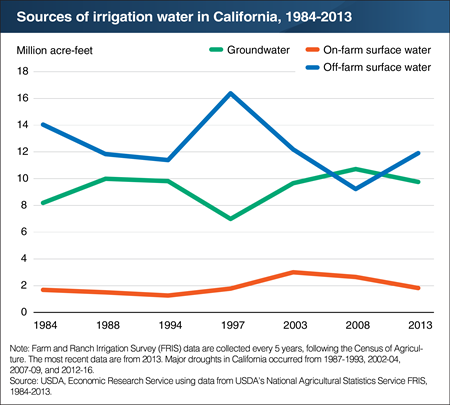
Prolonged drought generally results in large reductions in the quantity of surface water delivered, affecting farm production systems that depend heavily on surface water for irrigation. Groundwater may substitute as a source for irrigation water when the availability of surface water declines. For example, although most farmers in California’s main agricultural areas rely on surface water for the largest share of their irrigation needs, many parts of the State have sufficient groundwater reserves to provide a partial buffer against the impacts of drought. However, recurring drought and groundwater “overdraft”—when the amount of water extracted is greater than the amount of water entering the aquifer—have resulted in large declines in aquifer levels in some areas. This chart appears in the June 2017 Amber Waves feature, "Farmers Employ Strategies To Reduce Risk of Drought Damages."
Tuesday, December 5, 2017
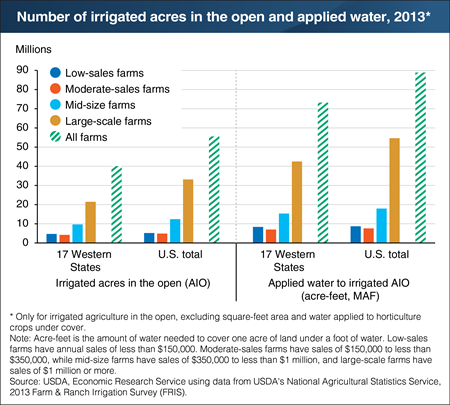
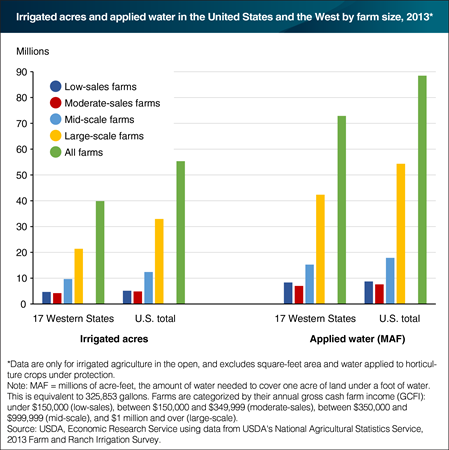
In 2013, large-scale U.S. irrigated farms, those with $1 million or more in annual farm sales, accounted for most (about 79 percent) of the value of irrigated farm production. Large-scale farms also accounted for over half of the irrigated acres in the open (AIO) and about 60 percent of applied water. These farms dominate these characteristics largely because their size allows them to spread costs over many more acres. For example, in the West, irrigation pumping costs per acre for large-scale farms generally average about half that for low-sales farms, those with under $150,000 in farm sales. In total, U.S. farms irrigated about 55.4 million acres, which required the application of more than 88.5 million acre-feet (MAF) of water—equivalent to about 28.8 trillion gallons. The irrigation of AIO accounted for nearly all the water use (98 percent). Crops irrigated on AIO include corn, wheat, and soybeans as well as vegetables, berries, and nut trees. This chart appears in the June 2017 Amber Waves data feature, "Understanding Irrigated Agriculture."
Tuesday, October 17, 2017
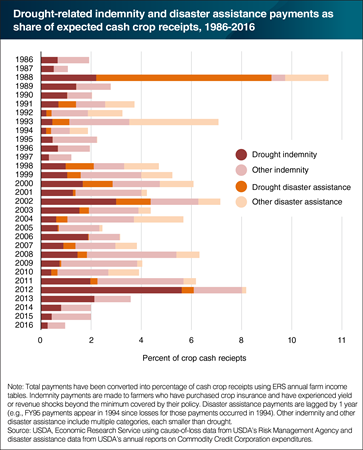
At any given time, some portion of the country faces drought conditions. In recent years, large areas of the United States have experienced prolonged drought, with significant impacts across entire agricultural sectors. A major drought can reduce crop yields, lead farmers to cut back planted or harvested acreage, reduce livestock productivity, and increase costs of production inputs such as animal feed or irrigation water. Since the Dust Bowl in the 1930s, drought has been an important focus of U.S. farm policy. Early Federal policy mitigated farmers’ drought-induced hardships primarily by providing ad hoc disaster assistance in response to a drought. With changes to the Federal crop insurance program in the 1990s, the emphasis of farm programs shifted from ad hoc disaster assistance to risk management, with a greater reliance on crop insurance to compensate farmers for drought losses. As a result, drought has been the largest individual driver of Federal indemnity payments and disaster assistance for over four decades. This chart appears in the June 2017 Amber Waves feature, "Farmers Employ Strategies To Reduce Risk of Drought Damages."
Friday, August 11, 2017
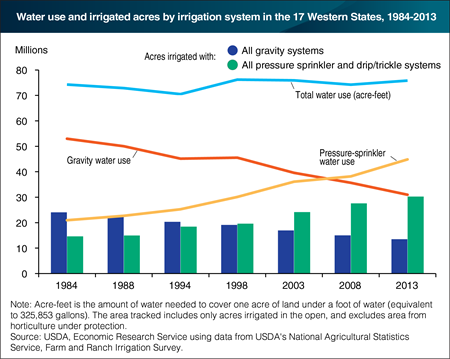
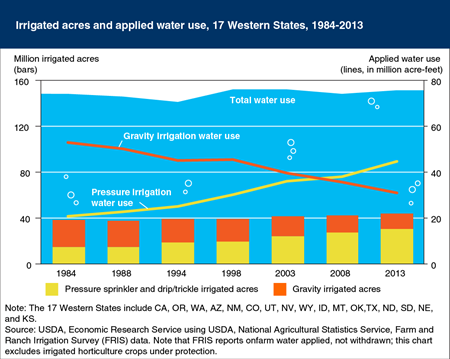
There are two main types of irrigation systems: gravity and pressurized irrigation. Gravity irrigation uses the force of gravity and field borders or furrows to distribute water across a field. Pressurized irrigation, on the other hand, delivers water to the field under pressure in lateral, hand-move, and center-pivot pipe systems with attached sprinklers. In the 17 most Western States—where water use for agriculture was greatest—total irrigated acres and total water use remained relatively stable between 1984 and 2013, the latest data available. However, the share of water applied using gravity systems steadily declined from 71 percent in 1984 to 41 percent in 2013. Meanwhile, the share using pressure-sprinkler systems steadily increased from 28 percent in 1984 to 59 percent in 2013. Irrigated acres followed similar trends, with acreage using gravity systems declining over time and pressure-sprinkler systems increasing. During that period of time, irrigators shifted to using more pressure-sprinkler systems to improve their irrigation efficiency and to reduce irrigation costs. This chart appears in the June 2017 Amber Waves data feature, "Understanding Irrigated Agriculture."
Monday, June 12, 2017
The irrigation of agricultural land varies across farm sizes. Most irrigated farms in 2013 (about two-thirds) were low-sales operations with under $150,000 in annual gross cash farm income (GCFI). Low-sales farms that irrigate average less than 50 irrigated crop acres per farm—compared to 1,200 acres for large-scale irrigated farms with $1 million or more in GCFI. However, large-scale farms accounted for over half of irrigated acres, 60 percent of applied water, and 79 percent of the value of irrigated farm production. Large-scale farms dominate these characteristics because their size allows them to spread costs over many more acres (compared to other farms). For example, irrigation pumping costs for large-scale farms in the West generally average about half that for low-sales farms. In 2013, U.S. farms irrigated about 55.4 million acres and applied more than 88.5 million acre-feet (MAF) of water, equivalent to about 28.8 trillion gallons. The irrigation of cropland—which included crops like corn, wheat, and soybeans—accounted for nearly all the water use (98 percent). This chart appears in the June 2017 Amber Waves data feature, "Understanding Irrigated Agriculture."
Friday, May 5, 2017
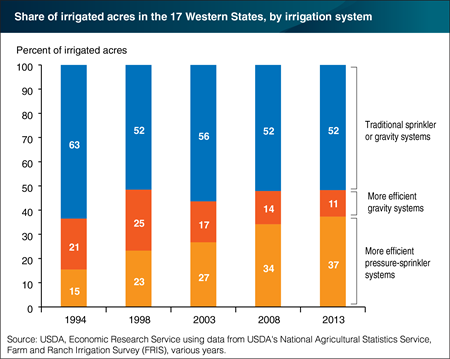
Efficient irrigation systems can help maintain farm profitability in an era of increasingly limited and more costly water supplies. More efficient gravity irrigation uses the force of gravity and field borders or furrows to distribute water across a field. It may also use laser-leveling to improve flood irrigation. More efficient pressure-sprinkler irrigation delivers water under lower pressure sprinklers and systems using drip/trickle tubes and micro-spray nozzles. The efficiency of irrigation systems is particularly important in the Western States—such as Nebraska, California, and Texas—where water demand for agriculture is greatest and diminishing water supplies are expected to affect future water availability. Data from USDA’s Farm and Ranch Irrigation Survey (FRIS) show that irrigated agriculture in the West has become more efficient over time. More efficient irrigation systems (both gravity and pressure-sprinkler) were used on about 36 percent of total irrigated acres in the West in 1994, but increased to nearly half by 2013. More efficient pressure-sprinkler irrigation alone accounted for about 15 percent in 1994, but more than 37 percent in 2013. The share of acres using more efficient gravity systems peaked in the late 1990s, but then declined as farmers increasingly turned to the even more efficient pressure-sprinkler systems. This chart is based on the ERS data product U.S. Irrigated Agriculture in the United States, released April 2017.
Tuesday, March 22, 2016
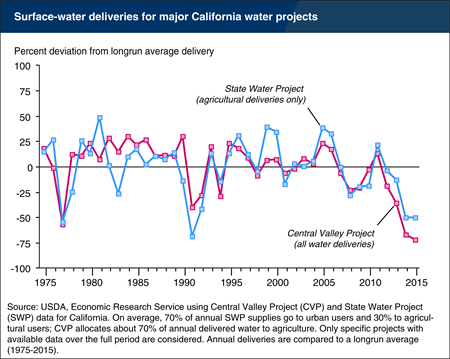
California is now entering the fifth year of a major drought, and by many measures, 2014 and 2015 have been the worst years of the drought for California agriculture. In California, measures of exposure to local water shortages are only part of how the drought is affecting farms. California agriculture relies heavily on irrigation, and much of the irrigation water is supplied by large-scale State and Federal water projects that store, transport, and deliver water across hundreds of miles. The two largest overarching mechanisms for delivering surface water in California are the State Water Project (SWP) and the Federal Central Valley Project (CVP). On average, 70 percent of annual State Water Project supplies go to urban users and 30 percent to agricultural users. In contrast, the Central Valley Project, managed by the U.S. Bureau of Reclamation, allocates, on average, about 70 percent of its delivered water to agriculture. Relative to longrun averages, deliveries from both projects were down modestly in 2012 and 2013, and then dropped dramatically in 2014, with similar delivery shortfalls for 2015. In an historical context, the current drought is at least as bad, from a deliveries perspective, as the 1977 and 1991-1992 droughts. While surface water from these projects is delivered through much of the State, the impacts of these reductions are most pronounced in the Central Valley of California. Farms in Southern California receive much of their surface water from the Colorado River, which has not been as heavily impacted by the current drought. This chart is found in California Drought: Farm and Food Impacts on the ERS website, February 2016.
Wednesday, January 6, 2016
About 75 percent of irrigated cropland in the United States is located in the 17 western-most contiguous States, based on USDA’s 2013 Farm and Ranch Irrigation Survey (the most recent available). Between 1984 and 2013, while the amount of irrigated land in the West has remained fairly stable (at about 40 million acres) and the amount of water applied has been mostly flat (between 70 and 76 million acre-feet per year), the use of more efficient irrigation systems to deliver the water has increased. In 1984, 71 percent of Western crop irrigation water was applied using gravity irrigation systems that tend to use water inefficiently. By 2013, operators used gravity systems to apply just 41 percent of water for crop production, while pressure-sprinkler irrigation systems (including drip, low-pressure sprinkler, or low-energy precision application systems), which can apply water more efficiently, accounted for 59 percent of irrigation water use and about 60 percent of irrigated acres. This chart is found in the ERS topic page on Irrigation & Water Use, updated October 2015.
Monday, December 14, 2015
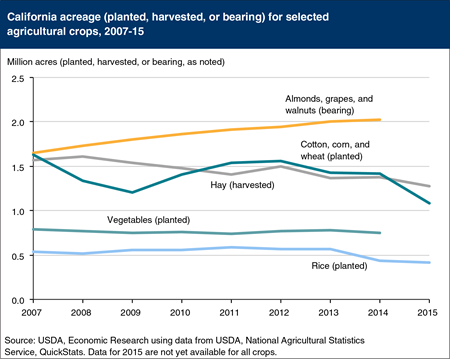
Long-term trends in California agriculture reflect shifting production, which may have implications for water use during droughts. Annually harvested crops such as cotton, corn, and wheat are on a downward trend and have seen a 31-percent reduction in planted acreage in California since 2012. Similarly, rice acreage has dropped 27 percent during the past 2 years (2013-15) of the drought. California’s hay and vegetable acreage has been more stable. In contrast, almonds, grapes, and walnuts acreage is on a strong upward trend that does not appear to have slowed during the drought. Orchards and vineyards require larger capital investments than annual crops, and because of the potential loss of that investment, orchard/vineyard owners are generally less willing to reduce water usage during droughts. However, orchards and vineyards are also more dependent upon ground-water than volatile surface-water supplies. California orchard/vineyard farmers are also more likely to have invested in more-efficient irrigation systems, such as low-pressure sprinkler and micro-irrigation systems that reduce water lost to evaporation, runoff, and deep percolation, thereby increasing the share of applied water that is beneficially used by the crop. This chart is found in the November 2015 Amber Waves statistic, “Long-Term Response to Water Scarcity in California.”


