ERS Charts of Note
Subscribe to get highlights from our current and past research, Monday through Friday, or see our privacy policy.
Get the latest charts via email, or on our mobile app for  and
and 
Friday, November 20, 2020
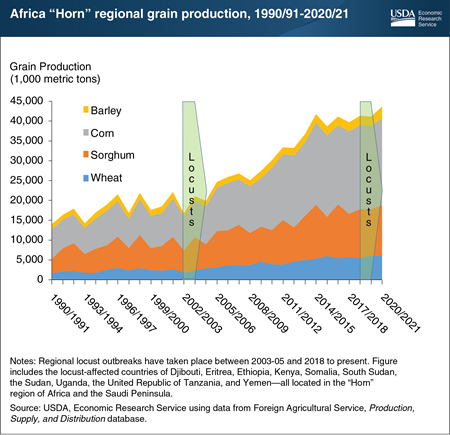
Several countries in the “Horn” region of Africa are facing the brunt of what the U.N. Food and Agricultural Organization (FAO) describes as the “worst desert locust crisis in 25 years.” Paradoxically, grain production in those countries is forecast to hit record volumes. The current desert locust outbreak originated in mid-2018 when successive rain events in the arid Arabian Desert spurred vegetation development. The latter, in turn, provided ample feedstock for the burgeoning locust population. Trade winds blew the pests into Africa in early 2019, where the locusts settled into the low-elevation arid to semi-arid grasslands. Regionally abundant rainfall through the end of 2019 and into 2020 supported vegetation growth, which once again aided in the expansion of locust swarms. However, the locusts primarily remained in low-elevation grasslands, largely avoiding the higher-elevation grain production zones. Further, the rainfall that increased feedstock for the locusts also helped increase yields for agricultural crops, such as corn, barley, sorghum, and wheat. Ultimately—and despite a significant locust infestation—grain production in this region is forecast not only above the 2019 levels but also to reach the highest level on record. This situation mirrors that of the less severe locust infestation of 2003-05, during which aggregate grain production rose during the height of the outbreak. This chart is drawn from material included in the Economic Research Service’s Wheat and Feed Outlook reports from August 2020, and has been updated with November data.
Friday, September 11, 2020
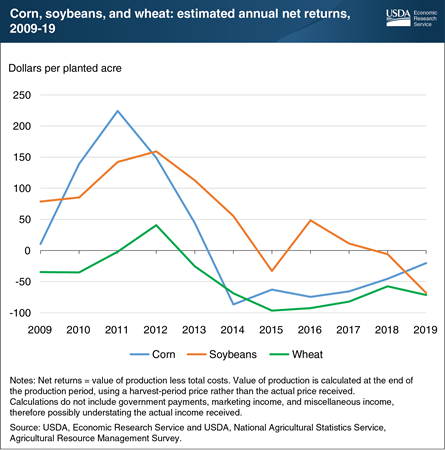
Producers of some of the U.S. major field crops have struggled to cover total costs of production over the past decade. The Economic Research Service’s (ERS) Commodity Costs and Returns product estimates this gap or surplus in the calculation of the value of production less total costs, referred to here as net returns. Total costs comprise operating costs, which include expenses such as fertilizer, seed, and chemicals, and allocated overhead (economic) costs, which include unpaid labor, depreciation, land costs, and other opportunity costs. Although revenue from selling crops can typically cover operating costs each year, net returns have often been negative. This suggests that, in some cases, allocated overhead costs are not covered. Corn’s net returns increased early in the decade, primarily due to a boom in the production of corn-based ethanol. Corn yields and acreage remained high after the boom, leaving supply high and leading, in part, to lower prices and returns over time. Net returns for soybeans shadowed those for corn during the ethanol boom, remaining higher than those for corn up until 2018. Wheat prices and returns also declined, due to strong international competition and several high-yield domestic crops. This chart is derived from data collected from the ERS Commodity Costs and Returns data product. Its data can also be viewed via ERS’s interactive data visualization product, U.S. Commodity Costs and Returns by Region and by Commodity.
Friday, June 12, 2020
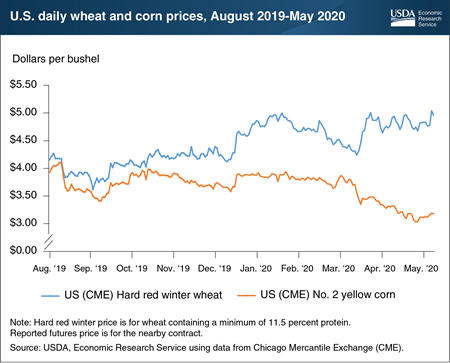
Wheat and corn prices tend to move in parallel, with cash and futures wheat prices historically being slightly above those for corn. For example, between August 2019 through March 2020, the average difference between futures contract prices of hard red winter wheat and yellow corn was about $0.58 per bushel and similar in size to their typical price spread. However, when efforts to contain the outbreak of COVID-19 brought about widespread stay-at-home orders, this wheat and corn price series began to diverge significantly. The widening spread came at a potentially impactful time for farmers, whose planting decisions could have been influenced by the perceived relative profitability of corn and spring wheat (winter wheat is planted in fall of the prior year and sowing would not be affected by recent developments). From the end of March through mid-May, the price difference for the leading wheat futures contract surged to $1.54 per bushel and well above the comparable average wheat-corn price margin. A spike in domestic retail flour, bread, and wheat-based product sales—related to greatly increased expenditures on food eaten at home—contributed to the observed wheat price increase. In contrast, stay-at-home orders significantly reduced fuel demand—10 percent of which is corn-based ethanol, thereby putting substantial downward pressure on the 2019/20 corn price. In the new marketing year, the margin between wheat and corn cash prices is expected to remain above the 5-year average, in part due to the continuation of COVID-19 related impacts on demand for wheat and corn products, and also due to contrasting supply expectations for each grain. This chart is drawn from the Economic Research Service Wheat Outlook, published in May 2020 and has been updated using data from the Chicago Mercantile Exchange.
Wednesday, January 22, 2020
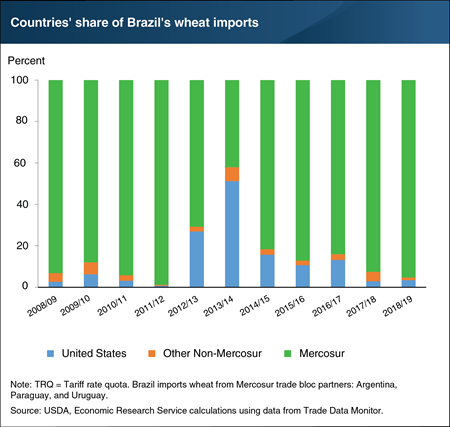
Brazil is the third-largest global importer of wheat. However, in recent years just one to six percent of U.S. exports have gone to this important South American market on average. In the past ten years, the bulk of Brazil’s wheat imports have originated from Mercosur trading partners (Argentina, Paraguay, and Uruguay) on which Brazil does not impose import duties. Mercosur partner Argentina enjoys proximity benefits and typically supplies about 65 percent of Brazil’s total volume of imports. During periods when Argentina’s exportable wheat supplies have been limited, such as 2013/14, Brazil has removed duties on wheat from non-Mercosur countries, increasing the competitiveness of their exports. As a result, in the 2013/14 trade year (July/June), the U.S. accounted for more than 50 percent of Brazil’s wheat imports. The U.S. has historically been the dominant non-Mercosur wheat exporter to Brazil and is noted for the high quality of its wheat. On November 14, 2019, the Government of Brazil removed a 10-percent duty that applied to the first 750,000 metric tons of wheat imports from non-Mercosur countries. This suggests the U.S. will be increasingly—though mainly seasonally—price competitive with Mercosur-origin wheat. This chart appears and is explained in more detail in the article, “Brazil’s Implementation of a TRQ (tariff rate quota) for Wheat Cracks Open the Door for Expanded U.S. Exports,” in the December 2019 issue of ERS’s Wheat Outlook newsletter.
Tuesday, August 13, 2019
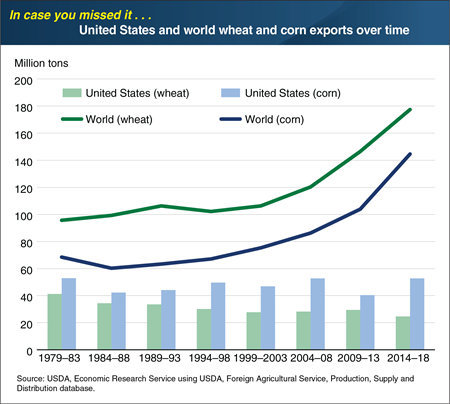
The United States maintained its status as the world’s grain superpower for most of the post-World War II period by being the leading corn and wheat producer and exporter. Before the beginning of this century, the United States annually exported about a third of globally traded wheat and around 70 percent of corn. The emergence of new low-cost producers and exporters in the global wheat and corn markets reduced the U.S. share of grain exports and transformed global grain trade. Competition from Russia, Ukraine, and Argentina has weighed down U.S wheat exports share, while Brazil, Argentina, and Ukraine are driving down the U.S. corn export share. In October 2018, world demand for wheat had been growing at a steady pace, driven mainly by population growth in low-income countries and a switch from rice to wheat consumption in countries that are traditionally heavy rice consumers. This chart appears in the October 2018 Amber Waves article, “Major Changes in Export Flows Over the Last Decade Show the U.S. Is Losing Market Share in Global Grain Trade.” This Chart of Note was originally published October 11, 2018.
Thursday, October 11, 2018
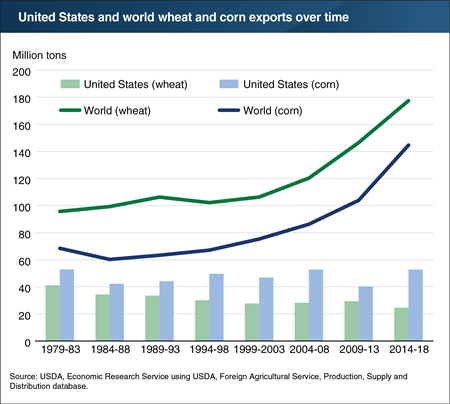
The United States maintained its status as the world’s grain superpower for most of the post-World War II period by being the leading corn and wheat producer and exporter. Before the beginning of this century, the United States annually exported about a third of globally traded wheat and around 70 percent of corn. The emergence of new low-cost producers and exporters in the global wheat and corn markets reduced the U.S. share of grain exports and transformed global grain trade. Competition from Russia, Ukraine, and Argentina has weighed down U.S wheat exports share, while Brazil, Argentina, and Ukraine are driving down the U.S. corn export share. World demand for wheat has been growing at a steady pace, driven mainly by population growth in low-income countries and a switch from rice to wheat consumption in countries that are traditionally heavy rice consumers. This chart appears in the October 2018 Amber Waves article, “Major Changes in Export Flows Over the Last Decade Show the U.S. Is Losing Market Share in Global Grain Trade.”
Thursday, February 8, 2018
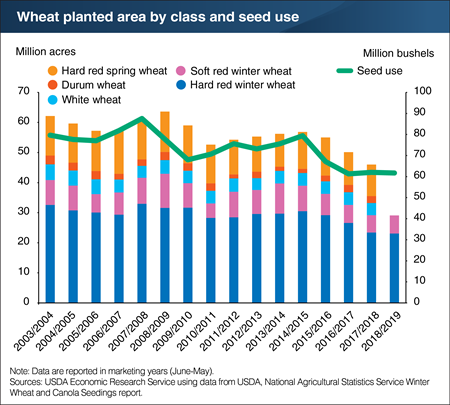
Winter wheat seedings—or seeds planted—for the next marketing year are projected to be the lowest in 109 years; however, the USDA estimate, based on 82,000 farmer surveys, generally exceeded industry expectations. Winter wheat seedings for the 2018/19 marketing year are estimated at 32.6 million acres, slightly below the 2017/18 seeding estimate of 32.7 million acres. In Kansas, the leading winter wheat producing State, planted area is up 200,000 acres for the 2018 marketing year. Planted area is also up slightly in Texas, though collectively, gains in these two States are not enough to offset winter wheat acreage losses elsewhere. Reduced profitability and agronomic factors, such as delayed seeding due to a late corn harvest, disease challenges, and below-average soil moisture levels, reduced winter wheat plantings in Colorado and Oklahoma. The current projection for 2018 is down less than 1 percent from 2017 and down 10 percent from 2016. Hard red winter wheat planted area is projected to total 23.1 million acres, a decline of 2 percent from 2017, while soft red winter planted area is forecast up 4 percent, year-to-year, to nearly 6 million acres. This chart appears in the latest ERS Wheat Outlook newsletter, released in January 2018.
Wednesday, October 18, 2017
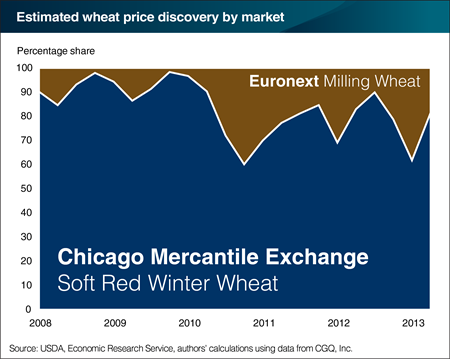
Until recently, the United States led the world in the pricing and trade of wheat. But over time, a substantial share of world wheat exports shifted to Russia and Ukraine (collectively, the Black Sea region) and the European Union. At the same time, U.S. wheat futures (contracts for the purchase/sale of wheat at a given price on a future date) prices are being supplanted by new price benchmarks that more closely track supply and demand conditions in the Black Sea region and the European Union. While the Chicago Mercantile Exchange Soft Red Winter Wheat futures contract is the most active wheat futures market in the world, futures trading volume has grown substantially for the Euronext Milling Wheat contract traded in Paris. Rising volume indicates a market may be more important for price discovery, the process by which markets determine the value of wheat through trades between willing buyers and sellers. A new study by economists at ERS and Montana State University estimated the relative proportion of price discovery in the Chicago and Paris futures markets between 2008 and 2013. Findings suggest that while U.S. futures markets remain dominant in wheat price discovery, the Paris futures market has gained influence since 2010, moving from a 9-percent share of price discovery to nearly 25 percent. This chart appears in the October Amber Waves article, "Wheat Price Discovery Remains Concentrated in the United States, but Shifting to Europe."
Friday, September 29, 2017
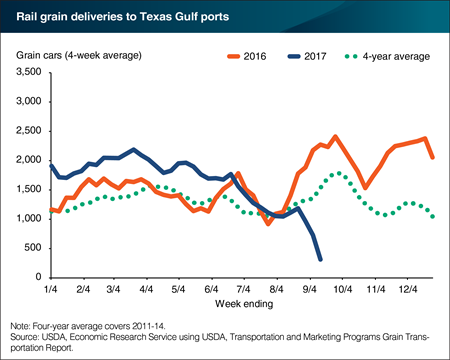
On August 25, Hurricane Harvey made landfall on the Texas coast, bringing record levels of rainfall to the Houston metropolitan area and nearby counties. Rainfall totals in some areas of Texas exceeded 50 inches. Not surprisingly, the resulting widespread flooding reduced rail service along the Gulf Coast and all but halted regional grain exports through the first week of September. Interruptions in grain transportation in the Gulf region have the potential to be particularly impactful on shipments of the U.S. wheat crop. The Federal Grain Inspection Service reports that an average of 46 percent of total U.S. wheat exports ship from Gulf ports in Texas and Louisiana. For the week ending August 31, there were virtually no wheat inspections reported for Gulf ports due to the shutdown of rail and port operations. For the week ending September 7, no wheat was inspected for export at either South Texas or East Gulf ports, while North Texas inspected a relatively modest 50,318 metric tons of hard red winter wheat, down from 160,512 metric tons for the same week in 2016. Wheat export inspections are anticipated to accelerate as rail service that provides access to Gulf loading facilities is restored. Although some railroad repairs may take months, others are expected to be restored more quickly. This chart appears in a special article in the latest Wheat Outlook newsletter released in September 2017.
Tuesday, September 5, 2017
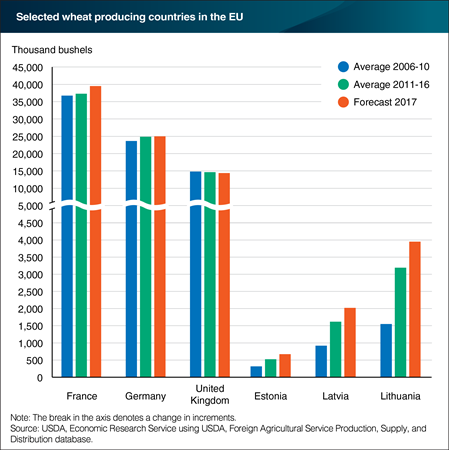
The European Union (EU) is the largest wheat producer in the world. Within the EU, France, Germany, and the United Kingdom are the largest wheat producers. Wheat production in the most important wheat producing nations has been relatively steady since 2006, and these countries have not experienced a very large increase in average output or percentage of EU output. A number of smaller wheat-producing countries, however, have increased wheat output substantially over the last 10 years. These nations include many of the EU’s Eastern European new member states: Poland, Romania, the Czech Republic, Bulgaria, Hungary, and Slovakia. The increases have been particularly pronounced in the Baltic States of Lithuania, Latvia, and Estonia, which increased wheat output by more than 100 percent, since 2006. These countries moved from a 1.3 percent share of EU-28 wheat output in 2006 to a 4.3 percent share in 2016. These increases in the Baltic States are generally due to both increases in area planted to wheat and gains in yield per acre. This chart appears in the ERS Wheat Outlook newsletter released in August 2017.
Tuesday, July 25, 2017
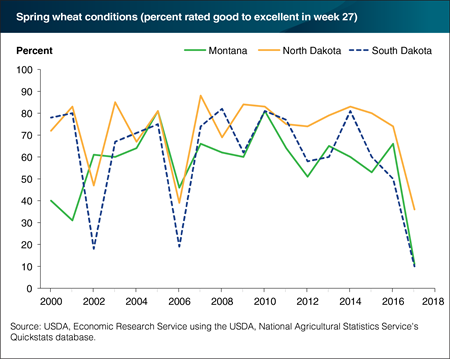
Hard Red Spring (HRS) wheat (the largest class of spring wheat) is predominately grown in the Northern Plains of the United States. This key production region, which includes Montana, North Dakota, and South Dakota, has been greatly affected by a lengthy dry spell that has plunged the area into varying levels of drought, ranging from abnormal dryness to exceptional drought. On July 9, widespread drought conditions were noted for both North and South Dakota as well as Eastern Montana, and the proportion of the HRS crop rated “good” to “excellent” was just 36 percent, 10 percent, and 11 percent, respectively. Challenging weather conditions have reduced projected yields, now forecast at 39 bushels per acre, and contribute to a 22 percent year-to-year decline in HRS production for the 2017/18 marketing year. Expectations for a small harvest have helped to rally spring wheat prices in recent weeks and supports this month’s 50 cent increase in the 2017/18 all wheat price. This chart appears in the ERS Wheat Outlook newsletter, released in July 2017.
Friday, June 9, 2017
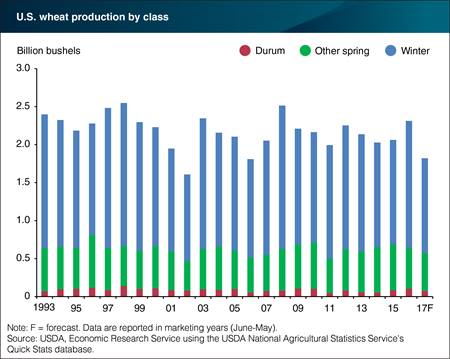
USDA published the first 2017/18 marketing year wheat balance sheet in this month’s World Agricultural Supply and Demand Estimates. Record-low winter wheat plantings combine with newly-reported harvested area and yield forecasts to indicate a sharp decline in winter wheat production. Low prices—especially for hard red winter wheat that qualified millions of bushels for loan deficiency payments—appear to have turned a number of growers away from wheat and toward crops such as soybeans, pulses, and corn in the new marketing year. Down 25 percent from 2016/17 to 1,246 million bushels, winter wheat production is the lowest since 2002. Other spring and durum wheat harvests are also forecast to be down year to year, leading to a projected total wheat production of 1,820 million bushels. If realized, total wheat production for 2017/18 will be nearly 500 million bushels or 21 percent lower than in 2016/17. In addition to low plantings, a late April snow storm affected large portions of the hard red winter wheat belt, lowering crop condition ratings in affected States, though the full extent of the weather event on winter wheat production is unclear at this time. This chart appears in the ERS Wheat Outlook Newsletter, released in May 2017.
Monday, May 1, 2017
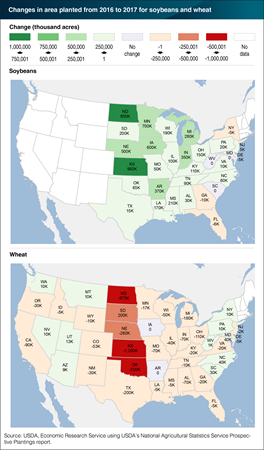
The latest projections for crop area plantings in 2017 indicate contrasting records for soybeans and wheat. Soybean plantings for 2017 are projected to reach 89.5 million acres, a new record-high. In contrast, forecast wheat plantings of 46.1 million acres would be a record low, if realized. Taken together, these planted area projections indicate that many farmers are switching from wheat to soybean production in several key wheat-growing States, including Kansas, Michigan, Nebraska, North Dakota, Oklahoma, South Dakota, and Texas. Since 2011, soybean acreage in these seven States has expanded by one-third, while wheat area has contracted. Farmers are likely responding to the higher prices and potential returns associated with soybeans, after multiple years of wheat prices trending lower. For the 2016/17 marketing year, the projected midpoint season-average farm-gate price for soybeans was $9.55 per bushel, slightly higher than the 2015/16 average of $8.95 per bushel. The all-wheat price for the 2016/17 marketing year is projected at $3.85 per bushel, more than a dollar below the 2015/16 season-average price and the lowest since 2005/06. This chart appears in the ERS Wheat Outlook report released in April 2017.
Wednesday, February 8, 2017
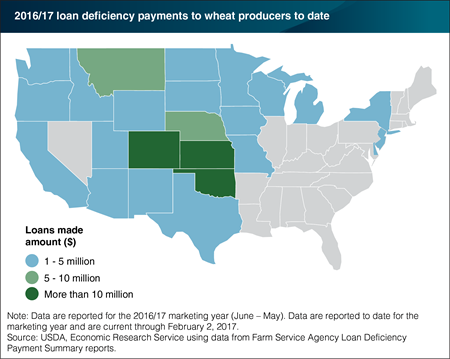
When wheat prices posted at county elevators fall below the annual county and class-specific marketing assistance loan rate, producers become eligible to receive loan deficiency payments (LDP). An LDP is a direct payment to farmers that covers the difference between the current local price and the pre-determined county loan rate. A 2016/17 marketing year drop in the price of all wheat has made producers eligible to receive government support from the LDP program, provided they meet basic requirements. Producers are not required to sign up ahead of time to be eligible. This is the first time that LDPs have been made for wheat since the 2010/11 marketing year. USDA reports that LDPs in the 2016/17 marketing year to date are $117 million. Payments have been made on a total of 560 million bushels of wheat with an average LDP of almost 21 cents per bushel. Per bushel payments (to date) are highest in Oklahoma, at near 26 cents per bushel. The State with the largest number of bushels to receive an LDP is Kansas. To date, about 271.5 million bushels of wheat or about 58 percent of the total volume of wheat produced in the State during the current marketing year has received an LPD. This map appears in the ERS Wheat Outlook report released in January 2017.
Monday, November 28, 2016
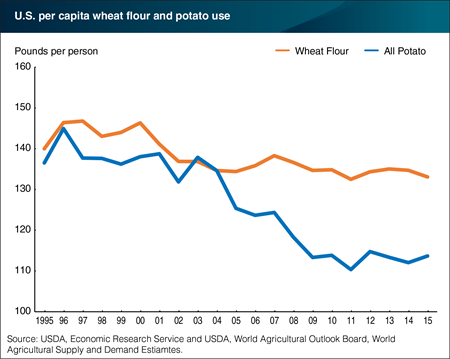
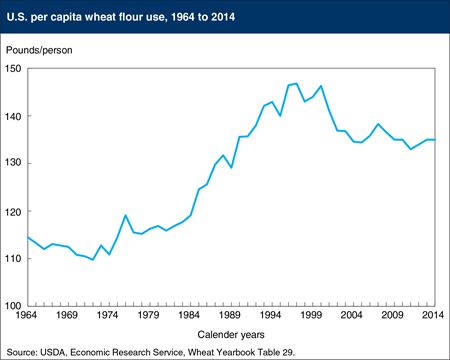
After peaking in 1997, per capita wheat consumption has trended downward, falling from146.8 pounds per person to 133.0 in 2015. With the U.S. population growing at a faster rate than projected wheat food use for the 2016/17 marketing year, per capita wheat consumption is on track to decline again in 2016. Reduced per capita wheat food use in the U.S. has been attributed to rising consumption of gluten-free or multi-grain products and diet trends, such as the Atkins diet, that encourages reduced consumption of carbohydrates. These same changes in consumer taste and preferences created downward pressure on use for other plant-based starches such as potatoes. Over the past two decades, per capita potato consumption has fallen by an average of 1.6 pounds per year and compares to annual per capital declines of 0.7 pounds for wheat. This chart is drawn from the ERS Wheat Outlook report released in November 2016.
Thursday, February 18, 2016
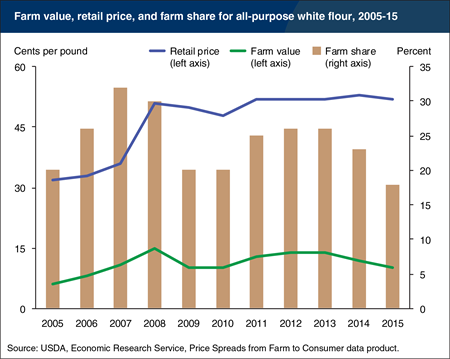
In 2015, the farm share of the retail price of all-purpose white flour—the ratio of the retail price of flour to prices received by farmers for their wheat—was 18 percent, the lowest farm share for flour in the last decade. While the retail price for all-purpose white flour has been relatively steady since 2011 at 52 to 53 cents per pound, the farm value of flour—the cost of the wheat in a pound of flour—has fallen from 14 cents in 2012 and 2013, to 12 cents in 2014, and to 10 cents in 2015. Abundant world wheat supplies have pushed down prices received by farmers for wheat in 2014 and 2015. With retail prices holding steady, the farm share of flour’s retail price fell from 26 percent in 2013 to 23 percent in 2014, and dropped again in 2015. More information on ERS’s farm share data can be found in the Price Spreads from Farm to Consumer data product, updated February 9, 2016.
Friday, July 17, 2015
Per capita wheat flour consumption has been relatively stable in recent years, and is estimated in 2014 at 135 pounds per person, unchanged from 2013 but down 3 pounds from the recent peak in 2007. The 2014 estimate is down 11 pounds from the 2000 level when flour use started dropping sharply, partially due to increased consumer interest in low-carbohydrate diets. From the turn of the 20th century until about 1970, U.S. per capita wheat use generally declined, as strenuous physical labor became less common and diets became more diversified. However, from the early 1970s until the late 1990s, wheat consumption trended upward, reflecting growth in the foodservice industry and away-from-home eating, greater use and availability of prepared foods for home consumption, and promotion by industry organizations of the benefits of wheat flour and pasta product consumption. During this time, the domestic wheat market expanded on both rising per capita food use and a growing U.S. population. Relatively stable per capita flour use in more recent years means that expansion of the domestic market for U.S. wheat is largely limited to the growth of the U.S. population. This chart is based on the April 2015 Wheat Outlook report.
Thursday, March 5, 2015
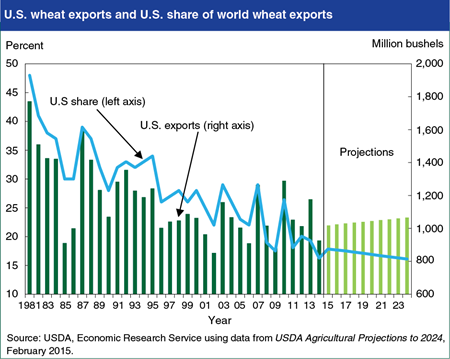
The United States is one of the world’s largest exporters of wheat—second only to the European Union and ahead of the world’s other major exporters including Canada, Australia and Russia—but its share of global wheat exports has trended lower over several decades and is expected to continue to decline over the next 10 years. While US wheat exports are expected to trend modestly higher from 2015 through 2024, exports from Russia, Ukraine and Kazakhstan could account for nearly half of the projected increase in world wheat trade, notwithstanding the weather-related production fluctuations that are common in this region. Growth in wheat imports is concentrated in developing countries where income and population gains drive increases in demand, including regions of West Africa, sub-Saharan Africa, Egypt and other parts of North Africa and the Middle East, Indonesia and Pakistan. In many of these markets, Black Sea and EU exporters maintain a cost advantage over the United States reflecting transportation distance, as well as the fact that U.S. wheat exports are almost exclusively for high-value food markets while much of the wheat imported by developing countries is for lower value uses including livestock feed. Nevertheless, the United States will remain one of the world’s leading suppliers of high-quality wheat, with exports projected to rise slowly during the coming decade, even as its share of global exports falls from 17.8 percent in 2015/16 to 16.1 percent in 2024/25. This chart is based on the report, USDA Agricultural Projections to 2024.
Friday, October 17, 2014
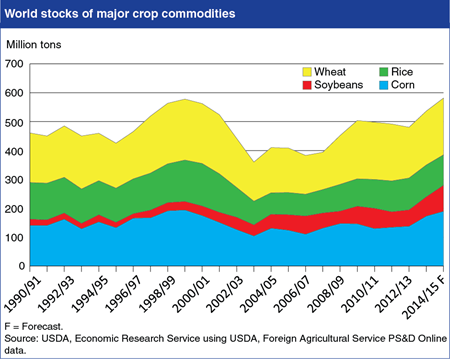
Global stocks of major crop commodities are forecast to expand in the 2014/15 marketing year, with total stocks of wheat, rice, corn, and soybeans completing recovery from the relatively low levels that preceded the 2008 spike in world crop prices. Record U.S. crops of corn and soybeans, along with good harvest by some other major producing countries, are forecast to push both U.S. and global stocks of these commodities to record levels. World wheat stocks are forecast to rise based on the outlook for record or near-record harvests by major foreign producers, including China, the EU, India, and the Former Soviet Union. While world rice stocks are forecast below peak levels of the early 2000s, good harvests and ample stocks are expected across the major producing regions in Asia. The supply outlook is expected to lead to lower commodity prices, with the average U.S. farm prices of corn (-24 percent), soybeans (-23 percent), wheat (-14 percent), and rice (-10 percent) all forecast down in their respective 2014/15 marketing years compared with 2013/14. Find additional analysis in the current editions of Feed Grain Outlook, Oil Crops Outlook, Wheat Outlook, and Rice Outlook.
Friday, August 1, 2014
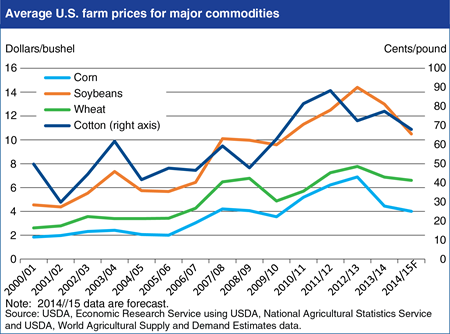
Current USDA forecasts show declines in U.S. average farm prices for major U.S. field crops—corn, soybeans, wheat, and cotton—of 4 to 19 percent in 2014/15. For corn, soybeans, and wheat, this would be the second consecutive year of declining prices. Soybean prices are forecast to decline the most in 2014/15, based on an expected record U.S. crop, combined with ample supplies from Brazil and Argentina. U.S. corn prices are forecast to fall 10 percent in 2014/15, after a 35-percent decline in 2013/14, also based on a large U.S. corn crop forecast and competition from other exporters like Brazil, Argentina, and Ukraine. U.S. wheat prices are forecast to decline about 4 percent in 2014/15, despite the forecast for smaller U.S. supplies, due to adequate supplies from both traditional and Black Sea wheat exporters. Although smaller cotton crops are forecast for China and India—the top two global producers—a larger U.S. crop is expected to lead to a fifth consecutive year of rising global cotton stocks and a 12-percent drop in U.S. prices in 2014/15. Find additional analysis in the current ERS outlook newsletters: Feed Outlook: July 2014, Oil Crops Outlook: July 2014, Wheat Outlook: July 2014, and Cotton and Wool Outlook: July 2014.


