ERS Charts of Note
Subscribe to get highlights from our current and past research, Monday through Friday, or see our privacy policy.
Get the latest charts via email, or on our mobile app for  and
and 
_450px.png?v=1323.9)
Wednesday, November 2, 2022
The 2022 highly pathogenic avian influenza (HPAI) outbreak has had relatively little impact on the broiler industry based on the volume of broiler meat produced in the United States. HPAI was detected in Indiana in February 2022 for the first time nationally since 2015 and was soon confirmed at multiple commercial poultry operations. Flocks at operations with detected infections were depopulated to prevent further spread of HPAI. Because of the limited overlap of the 2022 HPAI outbreak with broiler-producing regions, commercial flocks in the top four broiler-producing States (North Carolina, Georgia, Arkansas, and Alabama) have largely avoided HPAI. Of the 43.8 million commercial birds depopulated as of October 7, 2022, 2.3 million were meat-producing broilers. This represents less than a tenth of 1 percent of typical annual broiler slaughter. The effect on broiler production during the 2015 outbreak was also relatively small. Production reached a then-record volume, increasing nearly 4 percent from 2014. Broiler production has increased every year since and is forecast to total more than 45 billion pounds in 2022. This chart first appeared in USDA, Economic Research Service’s Livestock, Dairy and Poultry Outlook: September 2022 and has been updated with recent data.
Tuesday, November 1, 2022
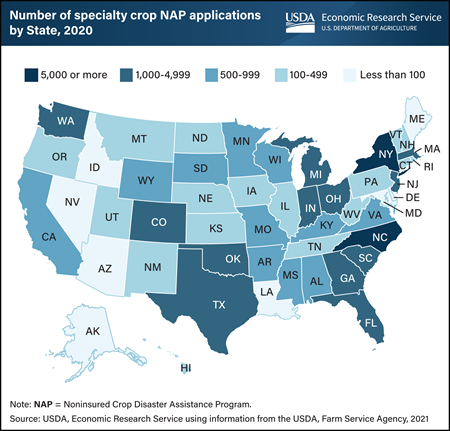
USDA operates various Federal crop insurance and disaster aid programs to help producers mitigate the risks of agricultural production such as weather, price, or pests. But when sufficient data is not available to create an actuarially sound insurance product (one in which premiums paid should approximately equal indemnity payments), then producers can apply to the USDA, Farm Service Agency’s Noninsured Crop Disaster Assistance Program (NAP). NAP covered about 115 million total acres in 2017. Specialty crops, which include fruits and vegetables, tree nuts, dried fruits, and horticulture nursery crops, are often grown in areas where there are suitable soil and weather conditions. In 2020, North Carolina and New York had the highest number of specialty crop NAP applications. Each State had more than 5,000 applications. Across the U.S., NAP applications were made for 147 different specialty crops in 2020. This chart appears in the Economic Research Service report Specialty Crop Participation in Federal Risk Management Programs, published in September 2022.
_450px.png?v=1323.9)
Monday, October 31, 2022
Spring wheat, a major class of U.S. wheat, annually accounts for about 25 percent of all wheat produced in the United States and is grown primarily in the U.S. Northern Plains States, mostly in North Dakota and Minnesota. Overly wet field conditions in spring 2022 delayed planting in both North Dakota and Minnesota resulting in 26 and 35 percent, respectively, of spring wheat acres being planted after June 5—USDA, Risk Management Agency’s (RMA) final planting date of all counties in those two States. That acreage was reported to USDA, Farm Service Agency as being prevented from on-time planting. If a farmer has not planted by the final planting date, most crop insurance policies offer compensation to offset expenses associated with preparing to plant, called a prevented planting payment. Alternatively, when commodity prices are high, some producers may choose to plant late because of field conditions and receive the market price for their harvest crop rather than take a prevented planting payment. RMA projected pre-season prices for spring wheat in North Dakota and Minnesota at $9.19 per bushel, the highest price in the last decade (2012–21), which may have contributed to acreage being planted later. This chart is drawn from the special article, "Factors Influencing Prevented Planting for Spring Wheat" in Economic Research Service’s Wheat Outlook, September 2022.
Thursday, October 27, 2022
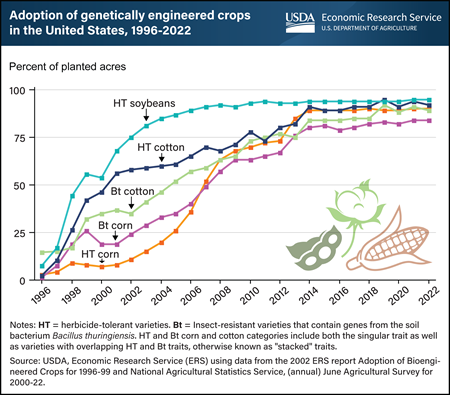
Genetically engineered (GE) seeds were commercially introduced in the U.S. for major field crops in 1996, with adoption rates increasing rapidly in the years that followed. By 2008, more than 50 percent of corn, cotton, and soybean acres were planted with genetically engineered seeds. The total planted acreage with GE seeds has only increased since then, and now more than 90 percent of U.S. corn, upland cotton, and soybeans are produced using GE varieties. GE crops are broadly classified as herbicide-tolerant (HT) only, insect-resistant (Bt) only, or stacked varieties that combine both HT and Bt traits in a single seed. In the chart, both HT and Bt lines include stacked varieties which are a combination of both type of traits. Although other GE traits have been developed, such as virus and fungus resistance, drought resistance, and enhanced protein, oil, or vitamin content, HT and Bt traits are the most commonly used in U.S. crop production. While HT seeds are also widely used in alfalfa, canola, and sugar beet production, most GE acres are planted to three major field crops: corn, cotton, and soybeans. This chart appears in the ERS Topic Page Recent Trends in GE Adoption, published in 2022.
Wednesday, October 26, 2022
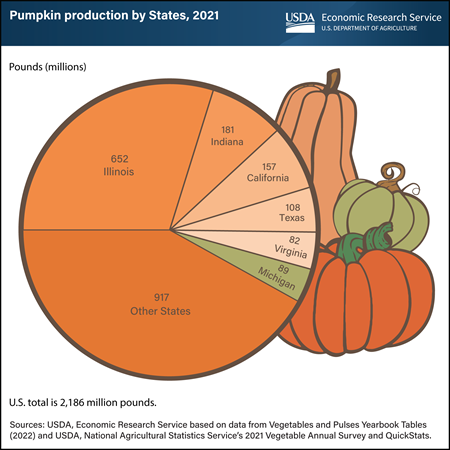
Pumpkins are on full display across the United States as part of many fall traditions, such as picking pumpkins at local farms, carving jack-o’-lanterns for Halloween, or baking pumpkin desserts for Thanksgiving. The production of pumpkins, from classic orange Howdens to new varieties like Cinderella, is widely dispersed throughout the United States, with all States producing some pumpkins. However, about 40 percent of pumpkin acres are harvested in only six States. By acreage and weight, Illinois is consistently the Nation’s largest pumpkin producer. In 2021, Illinois produced 652 million pounds, more than a quarter of total U.S. pumpkin production and more than the next five States combined. Unlike all other States, most of Illinois’ pumpkins are used for pie filling and processed for other food uses. Pumpkins from the other States are primarily intended for decorative, or carving, use. In 2021, Indiana produced 181 million pounds of pumpkins, California grew 157 million pounds, Texas grew 108 million pounds, Michigan grew 89 million pounds, and Virginia grew 82 million pounds. Retail prices for pumpkins typically fluctuate week to week leading up to Halloween. In the third week of October 2022, the average retail price for jack-o’-lantern style pumpkins was $5.07 per pumpkin, up 2 percent compared to the same week in 2021. This chart is drawn from Economic Research Service’s Trending Topics page, Pumpkins: Background & Statistics.
Tuesday, October 25, 2022
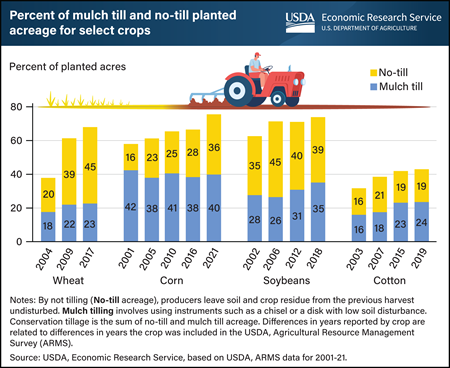
The share of acreage for major cash crops—wheat, corn, soybeans, and cotton—that are planted using conservation tillage has increased over the past two decades in the United States. Conservation tillage, which includes no-till and mulch till, reduces soil disturbance and preserves more crop residue relative to conventional tillage, in which a plow or other implement turns over most of the soil before planting. Conservation tillage promotes soil health and reduces soil erosion and nutrient runoff. In representative surveys, farmers reported employing conservation tillage on the majority of acres of wheat (68 percent), corn (76 percent), and soybeans (74 percent). Conservation tillage is less common on cotton fields (43 percent of acres). No-till production, a type of conservation tillage in which farmers plant directly into remaining crop residue without tilling, has increased substantially for wheat and corn over the past two decades. On wheat acres, no-till increased from 20 percent in 2004 to 39 percent in 2009 before rising to 45 percent in 2017. For corn acres, no-till increased from 16 percent in 2001 to 36 percent in 2021, including a jump from 28 percent in 2016. Mulch till, which aims to reduce soil disturbance through fewer and less intensive tillage operations than conventional production, accounted for about half of conservation tillage acres on corn and slightly more than half of conservation tillage on cotton. Mulch till has trended upward on each crop except for corn over the past two decades, including a recent increase for soybean acres from 31 percent in 2012 to 35 percent in 2018. This chart updates information in the USDA, Economic Research Service bulletin Tillage Intensity and Conservation Cropping in the United States, published in 2018.
Monday, October 24, 2022
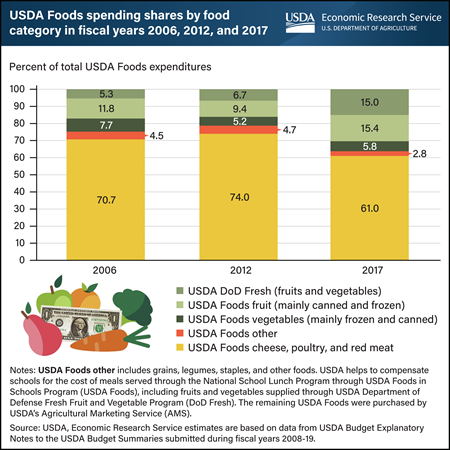
About 100,000 U.S. public and private nonprofit schools participate in the National School Lunch Program (NSLP), which served about 4.9 billion lunches in fiscal year 2019. The majority of foods served through the NSLP are bought through typical market channels, such as foodservice distributors, with USDA cash reimbursements to schools supporting their purchase. However, schools also make use of the USDA Foods in Schools Program (USDA Foods). Schools have two options for acquiring fruits and vegetables through USDA Foods: USDA Foods purchased by USDA’s Agricultural Marketing Service (AMS), which supplies mainly canned and frozen fruits and vegetables, and fresh fruits and vegetables distributed through the USDA Department of Defense Fresh Fruit and Vegetable Program (DoD Fresh). After school meal nutrition standards were updated in 2012, schools were required to serve more fruits and a wider mix of vegetables, including dark green and red/orange vegetables. Following the change in standards, schools obtained more fruits and vegetables through USDA Foods and especially through DoD Fresh. While there was no clear change in the types of foods chosen from 2006 to 2012, the percent of USDA Foods entitlement funds used for purchasing fruits and vegetables from DoD Fresh rose sharply from 6.7 percent of total USDA Foods in 2012 to 15 percent in 2017. Fruit obtained through AMS—mainly canned and frozen—rose from 9.4 percent of total USDA Foods spending in 2012 to 15.4 percent in 2017. Vegetables obtained from USDA’s AMS slightly rose from 2012 to 2017. As the percentage of spending on fruits and vegetables increased, the percentage spent on meat, poultry, and cheese dropped from nearly 74 percent in 2012 to 61 percent in 2017. This chart appears in the ERS report, Trends in USDA Foods Ordered for Child Nutrition Programs Before and After Updated Nutrition Standards, released September 1, 2022.
Friday, October 21, 2022
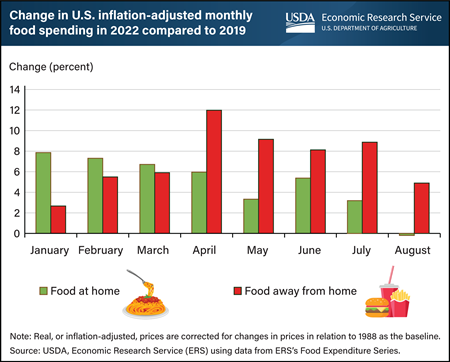
Real, or inflation-adjusted, monthly food spending in the United States has increased in 2022 as compared to the same period in 2019, before the Coronavirus (COVID-19) pandemic. Inflation-adjusted food spending measures the quantity of food spending after removing price increase effects. Real monthly food at home (FAH) spending, or food intended for off-premise consumption from retailers such as grocery stores, increased each month through August 2022 as compared to 2019 except in August, with the highest increase in January at almost 8 percent. This increase may be the result of U.S. consumers purchasing more foods or choosing more expensive grocery store options, such as pre-cut vegetables and fruits, imported out-of-season foods, organic products, and prepared dishes, than they did in 2019. Real monthly food away from home (FAFH) spending, or food consumed at outlets such as restaurants or cafeterias, also increased each month so far in 2022, with the highest increase in April at 12 percent. Similarly, the increase seen in 2022 in real FAFH spending may be the result of U.S. consumers purchasing more FAFH in general or shifting toward more expensive options, such as foods at full-service restaurants. The data for this chart come from the ERS’s Food Expenditure Series data product.
Thursday, October 20, 2022
Errata: On Oct. 25, 2022, a clarification was made for Florida's ranking in citrus production.
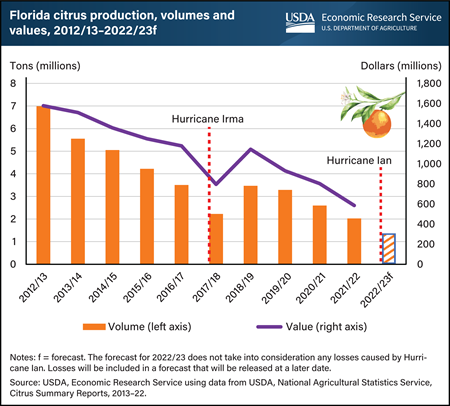
On September 28, 2022, Hurricane Ian made landfall as a category 4 hurricane on the southwest coast of Florida, the United States’ top producer of oranges. The hurricane crossed the peninsula, bringing severe winds and rainfall to some of the State’s foremost citrus-producing counties. Many of these same counties were affected by Hurricane Irma 5 years earlier. When Irma hit in September 2017, the State’s citrus production was already on a downward trajectory from diseases and other factors reducing acreage and yields. Florida’s citrus production fell by 1.3 million tons from the hurricane-free 2016/17 season, with the total value of production dropping 39 percent. On October 12, 2022, USDA’s National Agricultural Statistics Service released a citrus production estimate of about 1.4 million tons for the 2022/23 crop year. This forecast is 32 percent below total production from the previous season and does not take into consideration losses from Ian. While 2017 and 2022 hurricane events are distinct from one another, the effects of Irma can be used as a proxy to estimate the potential impact on value until the impact on the State’s total citrus production can be fully assessed. This chart is based on USDA, Economic Research Service (ERS) Fruit and Tree Nuts Outlook Report, released September 2022, and ERS’ Fruit and Tree Nuts Yearbook Tables, released October 2021, and has been updated with recent data.
Wednesday, October 19, 2022
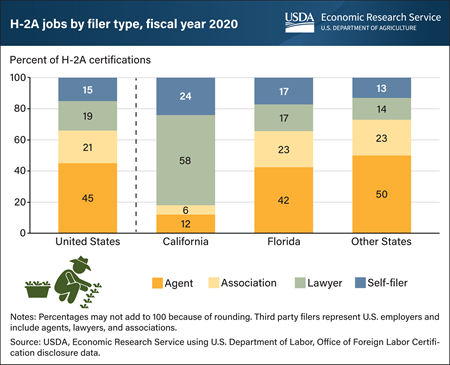
U.S. farmers who would like to hire temporary foreign workers through the H-2A visa program usually work with a third party (such as an agent, association, or lawyer) to make the application; employers themselves filed applications for only 15 percent of all jobs requested. Across the U.S., agents filed applications for 45 percent of all H-2A jobs, an association of farm enterprises filed for 21 percent of jobs, and 19 percent came from a lawyer representing the farmer. However, the usage rates for third parties differ across States. For instance, lawyers tend to file for most of the jobs in California, while agents and associations account for almost two-thirds of the job filings in Florida. The H-2A program allows farm operators who foresee a shortage of domestic workers to bring nonimmigrant foreign workers to the U.S. temporarily to perform agricultural labor or services. Many employers rely on specialized third parties to file H-2A applications on their behalf because of the perceived complexity of the process to certify their need for labor. Once a job is certified, the employer may then search for workers to employ. This chart appears in the ERS Economic Information Bulletin, The H-2A Temporary Agricultural Worker Program in 2020, published in August 2022.
_450px.png?v=1323.9)
Tuesday, October 18, 2022
The USDA’s Supplemental Nutrition Assistance Program (SNAP) Online Purchasing Pilot allows households in participating States to use their SNAP or Pandemic Electronic Benefit Transfer (P-EBT) benefits to buy groceries online from authorized, participating retailers. The pilot launched with several retailers in 2019 and early 2020 before the onset of the Coronavirus (COVID-19) pandemic. In response to the pandemic, USDA’s Food and Nutrition Service (FNS) opened the pilot to additional States and retailers. The number of participating retailers (each of which may include delivery or pickup from many individual stores) expanded significantly in the first two years of the pandemic. By December 2020, FNS had authorized 13 retailers. This number grew to 116 in December 2021 and to 148 in March 2022, providing benefit recipients with more options for redeeming their benefits online. The value of benefits redeemed online also grew. In 2020, SNAP and P-EBT recipients redeemed $1.5 billion in benefits online. In 2021, this amount more than quadrupled to $6.2 billion. Online redemptions in the first quarter of 2022 totaled $1.9 billion, representing 5.7 percent of all redemptions occurring in-person or online. This chart is based on a chart appearing in ERS’s Amber Waves article “Supplemental Nutrition Assistance Program Online Purchasing Expanded in First Two Years of Pandemic,” published September 2022.
_450px.png?v=1323.9)
Monday, October 17, 2022
U.S. production of durum—the primary class of wheat used to produce pasta—is expected to increase in the 2022/23 marketing year after last year’s drought reduced production to its lowest in 60 years. Production in 2022/23 is forecast at 64 million bushels, up 70 percent from the previous marketing year (2021/22), but below the average of the previous five years (2016/17–2020/21). Durum used for food in the 2022/23 marketing year is estimated at 80 million bushels, close to the historical average and slightly above 2021/22. Food use of durum was elevated in marketing years 2019/20 and 2020/21, fueled by surging consumer demand during the Coronavirus (COVID-19) pandemic, when shoppers stocked up on pasta while in quarantine. While the surge in demand has since subsided, consumer prices for wheat-based products including pasta are up substantially in 2022. This year’s larger durum crop, along with larger Canadian production, has eased some supply pressure; however, high commodity prices in general and elevated input, labor, and energy costs have each contributed to higher prices for the manufactured products of wheat, including pasta. The United States imports and exports durum every year, with imports typically larger. Net imports rise in years when production is lower. This chart is drawn from the USDA, Economic Research Service Wheat Outlook, October 2022.
Friday, October 14, 2022
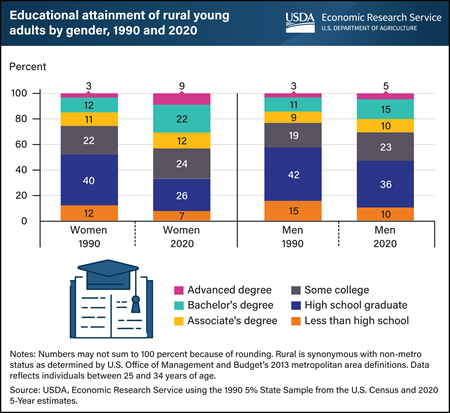
In rural areas, the level of educational attainment for women ages 25–34 continues to outpace young men. In 1990, 48 percent of rural young women had post-high school education, compared to 42 percent of rural young men. By 2020, this 6-percentage-point difference in post-high school educational attainment between the sexes increased to 14 percentage points, with 67 percent of rural, young women having post-high school education compared to 53 percent for their male counterparts. From 1990 to 2020, higher education rates for young, rural females increased almost 19 percentage points. The majority of that increase (10 percentage points) came from a rise in bachelor’s degrees, with another 6 percent coming from gains in advanced degrees, such as graduate or medical degrees. Educational attainment often has direct implications for earnings, with higher levels linked to increased wages and lower rates of unemployment, as discussed in Rural Education at a Glance, 2017 Edition. This is even more relevant for rural areas, where median earnings do not keep pace with urban area earnings. This chart updates information found in Rural Education at a Glance, 2017 Edition.
Thursday, October 13, 2022
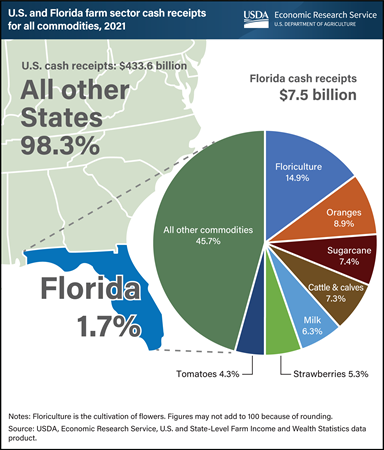
USDA, Economic Research Service (ERS) annually estimates the previous year’s farm sector cash receipts—the cash income received from agricultural commodity sales. This data includes State-level estimates, which offer background information about States subject to unexpected events that affect the agricultural sector, such as Hurricane Ian, which swept across Florida and surrounding States in late September 2022. In 2021, commodities produced in Florida contributed about $7.5 billion (1.7 percent) of the $434 billion in total U.S. cash receipts. Floriculture, the cultivation of flowers, accounted for the largest share of Florida’s cash receipts. Valued at $1.1 billion (14.9 percent of the State’s total), floriculture receipts for Florida were higher than for any other State in 2021. The next largest commodities in Florida in terms of cash receipts were oranges ($670 million), sugarcane ($553 million), cattle and calves ($546 million), milk ($470 million), strawberries ($399 million) and tomatoes ($324 million). Certain Florida crops accounted for large percentages of U.S. cash receipts in 2021, such as sugarcane with 51 percent and oranges with 42 percent, while bell peppers and grapefruit accounted for roughly a third of U.S. production. In addition to floriculture, Florida led the nation in cash receipts for sugarcane, cabbage, cucumbers, watermelon, sweet corn, and snap beans. This chart uses data from the ERS U.S. and State-Level Farm Income and Wealth Statistics data product, updated in September 2022.
Wednesday, October 12, 2022
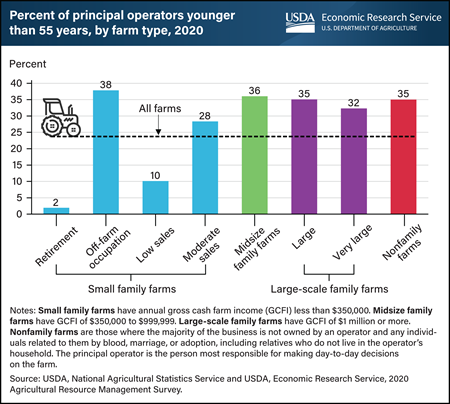
Almost a quarter of farm operations are run by a principal operator who is under 55 years old. The principal operator is the person most responsible for making day-to-day decisions. In comparison, 63 percent of U.S. self-employed workers in nonagricultural industries are younger than 55, according to the U.S. Bureau of Labor Statistics. In 2020, midsize family farms, which have a gross cash farm income of $350,000 to $999,999, and off-farm occupation farms, which are small operations whose principal operators report a primary occupation other than farming, had the largest percentage of farms managed by principal operators younger than 55 years, at 36 percent and 38 percent, respectively. Retirement farms had the smallest percentage (2 percent) of farms managed by a younger principal operator. For many family farms, the farm is also the home, and the principal operator can gradually phase out of farming or transition management to the next generation. Improved health and advances in farm equipment also allow principal operators to farm later in life than in previous generations. This figure updates information from the 2015 ERS report America’s Diverse Family Farms.
_450px.png?v=1323.9)
Tuesday, October 11, 2022
Access to food by the world’s most vulnerable households becomes constrained when food commodity prices are high, especially when the foods they purchase are sourced through international trade. USDA’s International Food Security Assessment (IFSA) model estimates how food prices and incomes affect food demand and access in 77 low- and middle-income countries. Food security is then evaluated by estimating the population unable to access sufficient calories to sustain a healthy, active lifestyle. Of the people in countries included in the 2022 IFSA, almost 119 million more people are estimated to be food insecure compared to 2021. That marks a nearly 10-percent year-to-year increase. The upward trend in international prices for wheat, coarse grains, and vegetable oils during the 2021/22 marketing year has been further exacerbated by Russia’s military invasion of Ukraine which reduced exports of these commodities from the Black Sea region. Domestic prices of major grains in 2022 are projected to rise in 70 of the 77 countries included in the IFSA, with the North Africa region being the most affected. North Africa, which is dependent on imports of wheat and corn, is estimated to see an increase in the prevalence of food insecurity by nearly 25 percent, relative to 2021. This chart appears in the USDA, Economic Research Service report, International Food Security Assessment, 2022-32, released September 15, 2022.
_450px.png?v=1323.9)
Thursday, October 6, 2022
The USDA’s National School Lunch Program (NSLP) was permanently authorized as a Child Nutrition Program in 1946. In fiscal year (FY) 2019, the program served about 29.6 million children each school day across 97,127 schools and residential childcare institutions. Any student in a participating school can get an NSLP lunch. Depending on their household’s income, students may be eligible for either a free, reduced-price, or full-price lunch. Students can receive a free lunch if their household’s income is at or below 130 percent of the Federal poverty line (FPL), a reduced-price lunch if their household’s income is between 130 and 185 percent of the FPL, and a full-price lunch if their household’s income is above 185 percent of the FPL. From 1971 through FY 2021, the program has served about 224.0 billion lunches. Of these meals, 126.4 billion were served for free or at a reduced price. The onset of the Coronavirus (COVID-19) pandemic in March 2020 interrupted the operations of many schools, disrupting the provision of lunches through the NSLP in FY 2020 and FY 2021. As a result, about 3.2 billion lunches were served through the program in FY 2020 and 2.2 billion in FY 2021, fewer than the 4.9 billion served in FY 2019. This drop reflects the use of a USDA pandemic waiver allowing schools to serve meals through the Summer Food Service Program instead of the NSLP and the creation of the temporary Pandemic Electronic Benefit Transfer (P-EBT) program, which reimbursed eligible families for the value of school meals missed because of pandemic-related disruptions to in-person school attendance. A higher share of the meals served in FY 2020 and FY 2021 were served free or at a reduced-price, attributable in large part to a USDA pandemic waiver allowing for meals to be provided free of charge to all students. This chart appears on the USDA, Economic Research Service’s National School Lunch Program page on the Child Nutrition Programs topic page.
_450px.png?v=1323.9)
Wednesday, October 5, 2022
The U.S. hog industry has experienced structural change, productivity growth, and increased output since the early 1990s. The average U.S. hog farm has become larger, more specialized, and focused on contract production. Hog and pig producers sold more than nine times the volume of hogs per farm in 2015 than in 1992, ending at 8,721 head of hogs per farm in 2015. Over the same period, feeder-to-finish operations—those specializing in raising feeder pigs from 30-80 pounds to market weights of 225-300 pounds—became the majority, growing from 19 to 60 percent of all hog operations. Hog operations also became increasingly likely to use production contracts. A sharp increase in contract production occurred from 1992 to 2004, but contract production leveled off near 70 percent between 2004 and 2015. By 2015, the majority of hogs and pigs were being produced on specialized operations (89 percent) and under contract production (69 percent). From 1992 to 2015, production contract use increased from 3 to 53 percent of operations, with roughly 71 percent of feeder-to-finish operations engaged in contract production by 2015. These agreements were attractive because contractors typically provided the hogs and feed, made many management decisions, transported animals to market, and decided where and when hogs were to be sold. This chart appears in the USDA, Economic Research Service’s report U.S. Hog Production: Rising Output and Changing Trends in Productivity Growth, published August 2022.
_450px.png?v=1323.9)
Tuesday, October 4, 2022
USDA encourages schools to serve locally grown and raised foods, including fresh produce and meat. During the 2018–19 school year, approximately two-thirds of U.S. school districts participated in farm to school activities, according to USDA Food and Nutrition Service’s 2019 Farm to School Census. Of the participating school districts, 78 percent reported purchasing some quantity of local food during the school year. About 43 percent of school districts reported purchasing local foods from produce distributors. USDA’s Department of Defense (DoD) Fresh Fruit and Vegetable Program (USDA DoD Fresh) was an equally common procurement source for school districts. USDA DoD Fresh allows districts to use USDA funds to obtain fresh fruits and vegetables through the DoD and provides information to districts on the food sources. USDA Foods, which refers to the commodities donated by USDA to school districts for use in school meals, was the third-most common source with 36 percent of respondents indicating they used the program to source local foods, followed by 26 percent of respondents that sourced from individual food producers. Broadline distributors (distributors offering several types of products), grocery stores, and school or community gardens and farms were each used by about 17 percent of respondents as local food sources. This chart is updated from one that appeared in Trends in U.S. Local and Regional Food Systems released January 29, 2015.
Monday, October 3, 2022
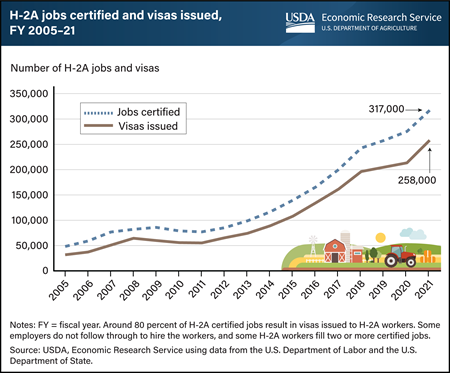
U.S. agricultural employers who anticipate a shortage of U.S. domestic workers can fill seasonal farm jobs with temporary foreign workers through the H-2A visa program. The Department of Labor certified around 317,000 temporary jobs in fiscal year (FY) 2021 under the H-2A visa program, more than six times the number certified in 2005. Only about 80 percent of the certified jobs in 2021 resulted in the issuance of a visa. The program has grown partly in response to current U.S. domestic workers finding jobs outside of U.S. agriculture and a drop in newly arrived immigrants who seek U.S. farm jobs. The H-2A program continued to expand in FY 2020 despite the jump in U.S. unemployment caused by lockdowns associated with the Coronavirus (COVID-19) pandemic. Six States accounted for about half of the H-2A jobs filled in 2021 certified: Florida, Georgia, Washington, California, North Carolina, and Louisiana. Nationally, the average H-2A contract in FY 2020 offered 24 weeks of employment and 39.3 hours per week at an average hourly wage of $13. This chart updates information in the ERS bulletin The H-2A Temporary Agricultural Worker Program in 2020, published in August 2022.


