ERS Charts of Note
Subscribe to get highlights from our current and past research, Monday through Friday, or see our privacy policy.
Get the latest charts via email, or on our mobile app for  and
and 
Thursday, July 20, 2023
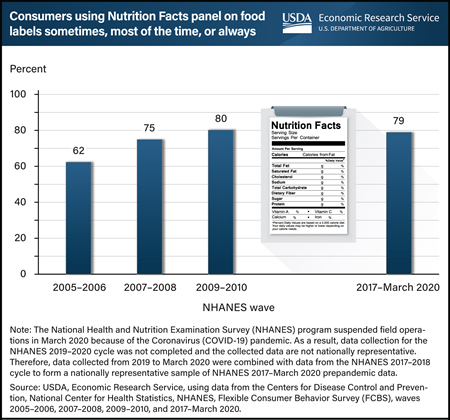
Nearly 4 out of 5 adults aged 20 and older reported they regularly used the Nutrition Facts panel when deciding to buy a food product during the most recent wave of the Flexible Consumer Behavior Survey (FCBS), from 2017 to March 2020. That is 79 percent, which is much higher than the 62 percent of adults who reported regular use of the Nutrition Facts panel in 2005–06. Regular use includes using the panel “sometimes,” “most of the time,” or “always” in food purchasing decisions. The Nutrition Facts panel on packaged foods lists the amount of calories, fat, fiber, carbohydrates, and some other nutritional information—all of which helps consumers compare products and make healthier food choices. Standardized nutrition information became accessible to U.S. consumers on almost all packaged foods sold in grocery stores, supermarkets, superstores, and other retail stores following the Nutrition Labeling and Education Act of 1990. Since 2007, USDA, Economic Research Service (ERS) has sponsored the FCBS by providing partial funding for data collection and survey administration. FCBS is a module of the National Health and Nutrition Examination Survey (NHANES), which collects information on U.S. consumers’ knowledge, attitudes, and beliefs about nutrition and food choices. This chart appears on ERS’ Flexible Consumer Behavior Survey topic page, updated in June 2023.
Monday, June 5, 2023
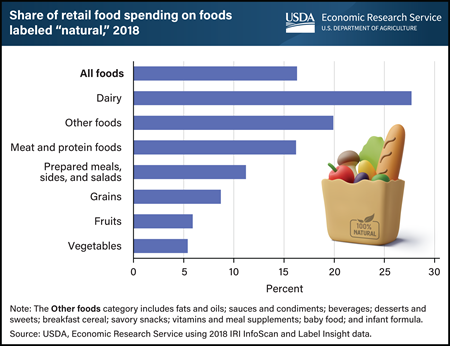
In 2018, food products labeled “natural” accounted for slightly more than 16 percent of all consumer retail food purchases. USDA and the U.S. Food and Drug Administration require producers to adhere to specific standards or processes to use certain label claims, such as USDA Organic. The “natural” claim, however, has minimal requirements and using the claim on a food product’s packaging does not require that the product provide any health or environmental benefits. Regulatory agencies treat the claim as meaning nothing artificial was added and the product was minimally processed. Even so, consumers sometimes attribute benefits to products labeled “natural,” research studies show. The share of products labeled “natural” varies by food category. The share of spending on “natural” products in 2018 was highest for dairy products (27.7 percent) and lowest for fruits (5.9 percent) and vegetables (5.4 percent). The data in this chart appear in the USDA, Economic Research Service report The Prevalence of the “Natural” Claim on Food Product Packaging, published in May 2023.
Thursday, March 30, 2023
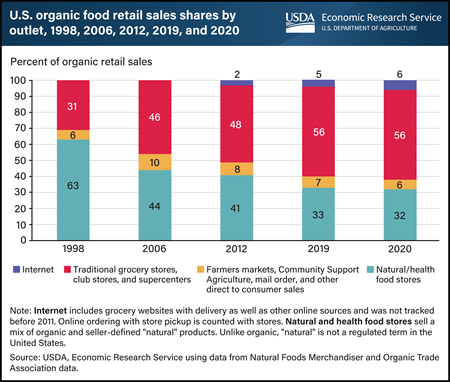
Markets for organic food began emerging in the 1970s as consumers became concerned about the growing use of synthetic fertilizers and pesticides and their effect on the environment and health. At that time, standards were developed on a State-by-State basis, and organic foods were largely sold in natural food stores. Natural food stores, both large and small, remained the major outlet for organic food sales until the mid-2000s. In 2000, USDA established the National Organic Program and set organic standards for production, along with consistent national labeling. Organic retail food sales moved into conventional grocery retailers, and made up almost 60 percent of retail sales in 2020. Organic food subscriptions such as seasonal fruit baskets, online meal boxes, and other internet sales have created new supply chains for organic food. In 2019, internet sales jumped to 5 percent from 2 percent of total sales in 2012 and rose again in 2020 as consumers responded to the Coronavirus (COVID-19) pandemic. This chart appears in the USDA, Economic Research Service report, U.S. Organic Production, Markets, Consumers, and Policy, 2000–21, published March 2023.
Thursday, February 16, 2023
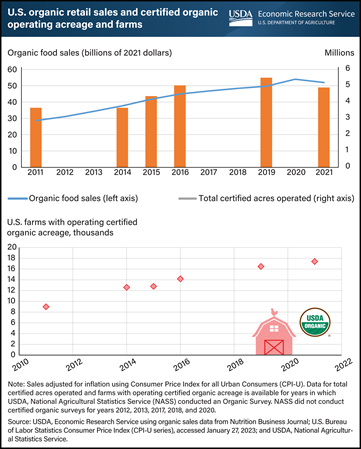
The organic market has seen continued growth in retail sales in the past decade. U.S. organic retail sales increased by an average of 8 percent per year and surpassed $53 billion in 2020 (inflation-adjusted to 2021 dollars). In 2021, sales were $52 billion, which was a 6-percent annual decline when adjusted for inflation, but a slight increase when not inflation-adjusted. Additionally, the number of certified organic acres operated increased gradually from 3.6 million in 2011 to 4.9 million acres in 2021. The number of certified farms with operating organic acres in the United States nearly doubled over the past decade to 17,409 from about 8,978. Between 2019 and 2021, the number of certified organic farms in the United States increased 5 percent, while total organic land decreased by 11 percent, driven by a 36-percent decrease in pasture and rangeland. These latest data were released in the 2021 Certified Organic Survey on December 15, 2022, by USDA, National Agricultural Statistics Service with cooperation from USDA's Risk Management Agency, which is the first organic survey released by USDA since 2019. The U.S. organic retail sales data provided by Nutrition Business Journal were adjusted for inflation and are available on USDA, Economic Research Service’s Organic Agriculture topic page, updated February 2023.
Friday, September 24, 2021
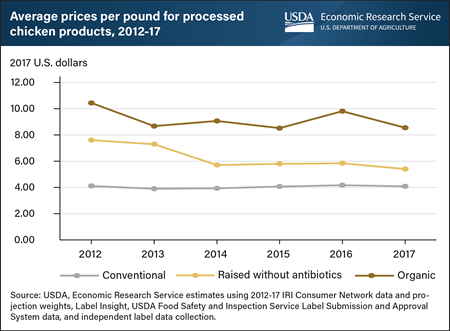
Processed chicken products whose labels show they were raised without antibiotics (RWA) were on average $2.23 per pound more expensive than conventional chicken products between 2012 and 2017, representing a 55-percent markup over conventional products. Processed chicken products include fresh or frozen chicken products that are cooked, marinated, breaded, or fried. A recent USDA, Economic Research Service (ERS) report shows consumer awareness of antibiotic use in meat and poultry production has increased over the past decade, and a growing market has emerged for chicken products that carry an RWA label. Though raising animals without antibiotics can be costly, producers can benefit from doing so when consumers are willing to pay higher prices for RWA products. Analyzing national household scanner data and a constructed dataset of chicken product labels, ERS researchers also found prices for organic processed chicken products were higher than those with RWA labels. From 2012 to 2017, prices for organic processed chicken products were on average $5.13 a pound more than conventional chicken products, representing a 125-percent total markup. These price differences suggest there are significant market opportunities for production practices that fall somewhere between conventional and the standards required for organic production. This information is drawn from the ERS report, The Market for Chicken Raised without Antibiotics, 2012-17, released September 2021.
Monday, July 19, 2021
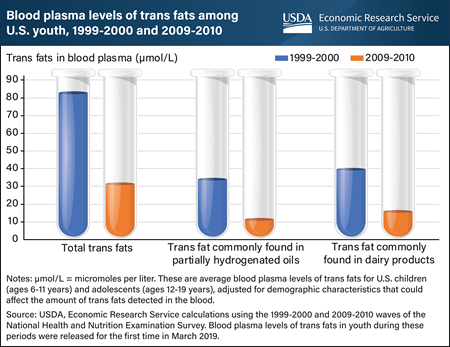
A 2020 USDA, Economic Research Service (ERS) study analyzed data publicly released for the first time in March 2019 and found that blood plasma levels of trans fats among youth fell by more than three-fifths (61.9 percent) from 1999-2000 to 2009-2010. Trans fats raise artery-clogging “bad” cholesterol (low-density lipoprotein, or LDL) levels and lower “good” cholesterol (high-density lipoprotein, or HDL) levels. Thus, increased intake of trans fats can result in an elevated risk of cardiovascular disease. The decrease in blood plasma levels of trans fats among youth came after a recommendation in the 2005 Dietary Guidelines for Americans to limit consumption of trans fats and a Federal Government requirement that trans fats content be included on packaged food labels. While young people are at a lower risk of developing cardiovascular disease than adults, intake of trans fats in early childhood and adolescence could set in motion processes that lead to the disease in adulthood. Data on blood plasma levels of trans fats of children (ages 6-11 years) and adolescents (ages 12-19 years) living in the United States were drawn from the 1999-2000 and 2009-2010 waves of the National Health and Nutrition Examination Survey, a nationally representative survey that assesses the health and nutritional status of the U.S. population. Blood plasma levels of the type of trans fat often found in partially hydrogenated oils fell by about two-thirds (67.2 percent) from 1999-2000 to 2009-2010, compared with a 60.5 percent decline in blood plasma levels of the type often found in dairy products. This chart appears in the ERS’ Amber Waves article, Trans Fat Levels Among U.S. Youth Fell From 1999 to 2010, June 2021. See also an Amber Waves finding from June 2017, Blood Levels of Trans Fats Among American Adults Fell from 1999 to 2010.
Thursday, November 14, 2019
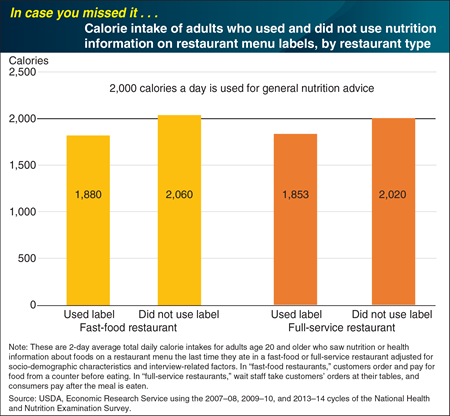
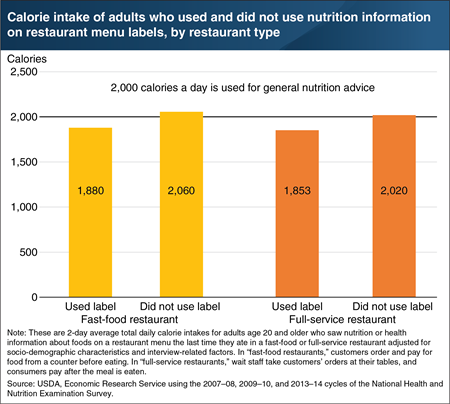
As part of the Federal Government’s National Health and Nutrition Examination Survey (NHANES), respondents are asked whether they see nutrition or health information on fast-food and full-service restaurant menus. If the answer is “yes,” respondents are also asked whether they use that information to decide which foods to buy. ERS researchers compared daily calorie intakes of adults who saw and used the menu information with intakes of adults who noticed the information but chose not to use it. Because information users may differ from nonusers in other ways, ERS researchers also adjusted intakes for differences in socio-demographic characteristics and interview-related factors (e.g., whether intake occurred on a weekday or weekend). Even after accounting for such differences, ERS analysis of NHANES data from 2007–14 reveals that restaurant menu label users consumed 167–180 fewer calories per day than nonusers consumed—a calorie intake gap that is 8 to 9 percent of a 2,000-calorie reference diet. This chart appears in “New National Menu Labeling Provides Information Consumers Can Use To Help Manage Their Calorie Intake” in the October 2018 issue of the ERS Amber Waves magazine. This Chart of Note was originally published March 22, 2019.
Tuesday, July 16, 2019
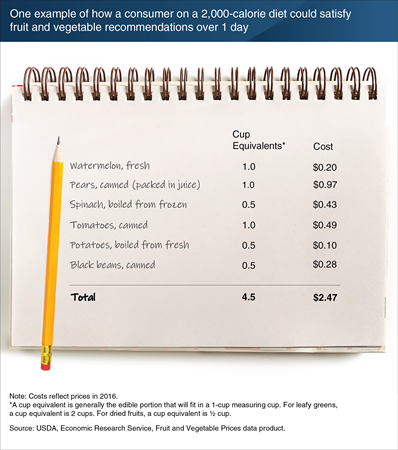
“Make half your plate fruits and vegetables” is among USDA’s key messages about how Americans can achieve healthy diets. However, many Americans still consume an insufficient quantity and variety of fruits and vegetables. One reason may be a perception that these foods are expensive. To address this perception, ERS reports the average cost to consume 154 fresh and processed fruits and vegetables in cup equivalents. A cup equivalent is generally the edible portion of a fruit or vegetable that will fit in a 1-cup measuring cup. Researchers also use the data to create baskets of products that would satisfy the 2 cup equivalents of fruit and the 2.5 cup equivalents of vegetables recommended for a person on a 2,000-calorie-per-day diet. In 2016, it was possible to meet these recommendations for about $2.10 to $2.60 per day. One basket in this cost range contains 1 cup equivalent each of watermelon and canned pears (packed in juice) as well as 1 cup equivalent of canned tomatoes and ½ cup equivalent each of potatoes, frozen spinach, and canned black beans. This example basket and others appear in the Amber Waves article, “Americans Still Can Meet Fruit and Vegetable Dietary Guidelines for $2.10-$2.60 per Day,” published in June 2019.
Friday, March 22, 2019
As part of the Federal Government’s National Health and Nutrition Examination Survey (NHANES), respondents are asked whether they see nutrition or health information on fast-food and full-service restaurant menus. If the answer is “yes,” respondents are also asked whether they use that information to decide which foods to buy. ERS researchers compared daily calorie intakes of adults who saw and used the menu information with intakes of adults who noticed the information but chose not to use it. Because information users may differ from nonusers in other ways, ERS researchers also adjusted intakes for differences in socio-demographic characteristics and interview-related factors (e.g., whether intake occurred on a weekday or weekend). Even after accounting for such differences, ERS analysis of NHANES data from 2007–14 reveals that restaurant menu label users consumed 167–180 fewer calories per day than nonusers consumed—a calorie intake gap that is 8 to 9 percent of a 2,000-calorie reference diet. This chart appears in “New National Menu Labeling Provides Information Consumers Can Use To Help Manage Their Calorie Intake” in the October 2018 issue of the ERS Amber Waves magazine.
Tuesday, March 5, 2019
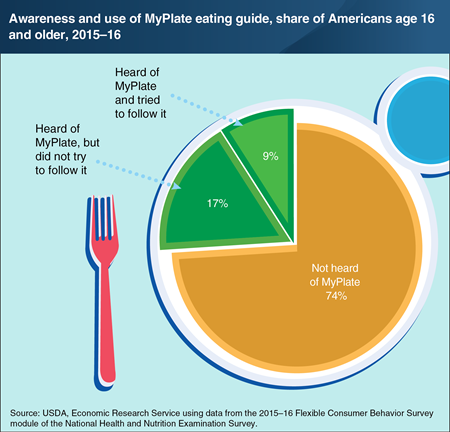
ERS developed the Flexible Consumer Behavior Survey (FCBS) module, which, starting in 2007, has been part of the National Health and Nutrition Examination Survey. FCBS collects data on U.S. consumers’ dietary knowledge, attitudes, and habits, including their awareness and use of USDA’s educational MyPlate graphic. ERS researchers used FCBS data to estimate the share of Americans who were aware of MyPlate and used it as a guide to support healthy eating patterns. In 2015–16, 26 percent of Americans age 16 and older reported that they had heard of MyPlate. This is a 6-percentage point increase from 2013–14, when 20 percent reported being aware of MyPlate. Among those who had heard of MyPlate in 2015–16, more than one-third of them (35 percent) indicated that they had tried to follow its recommendations—the same share as in 2013–14. Used in nutrition education and displayed on some food packaging, MyPlate depicts a place setting (with a plate and glass) divided into five basic food groups whose sizes correspond to suggested daily intake proportions. MyPlate replaced MyPyramid in June 2011. More information from FCBS can be found in the Food Consumption & Demand topic page on the ERS website, updated February 14, 2019.
Tuesday, May 22, 2018
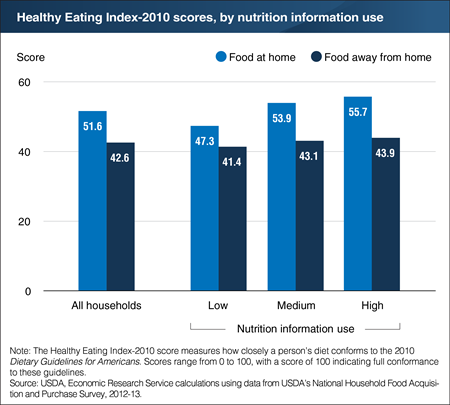
A recent ERS study used data from USDA’s 2012-13 National Household Food Acquisition and Purchase Survey (FoodAPS) to explore whether consumers who say they are familiar with or use nutrition information (nutrition information users) actually make healthier food choices. Researchers used answers from FoodAPS’s primary respondents to nine questions to classify households into low, medium, and high users of nutrition information. A positive relationship was found between nutrition information use and the nutritional quality of purchases from grocery and other food stores (food at home). However, for the average FoodAPS respondent, when the primary respondent is a high user of nutrition information, the nutritional quality of food purchased from fast-food places, full-service restaurants, and other food-away-from-home sources did not vary significantly from that of food purchased from these same food sources when the primary respondent is a low user of nutrition information. This finding is consistent with a possible “indulgence effect” wherein consumers—when eating out—often indulge themselves by selecting less healthy treats than they might when cooking meals at home. This chart appears in "Use of Nutrition Information and the Food Healthfulness Gap" in the May 2018 issue of ERS’s Amber Waves magazine.
Friday, April 20, 2018
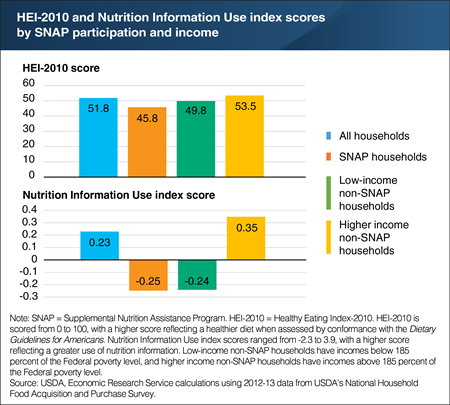
A new ERS study used nine questions from USDA’s 2012-13 National Household Food Acquisition and Purchase Survey (FoodAPS) to create a Nutrition Information Use index. The index is based on answers from FoodAPS primary respondents related to their awareness and use of various nutrition education initiatives, such as USDA’s MyPlate guidance and Nutrition Facts labels. The index summarizes the answer scores into one score, giving more weight to more important questions. When answers to questions with more weight are above average (e.g., the person uses Nutrition Facts labels all the time), the score is positive. If the answers are below average (e.g., the person never uses Nutrition Facts labels), the score is negative. Index scores for FoodAPS households ranged from -2.3 to 3.9, with a higher score indicating a greater use of nutrition information. The average score for all households was 0.23, and 58 percent of households had scores between -1.0 and 1.0. Higher income households that did not participate in USDA’s Supplemental Nutrition Assistance Program (SNAP) had an average index score that was two and half times higher than SNAP households and low-income non-SNAP households. However, index score differences did not seem to explain why higher income non-SNAP households’ food purchases were more healthful than the other two groups. The statistics for this chart are drawn from the ERS report, The Association Between Nutrition Information Use and the Healthfulness of Food Acquisitions, released on April 19, 2018.
Monday, March 5, 2018
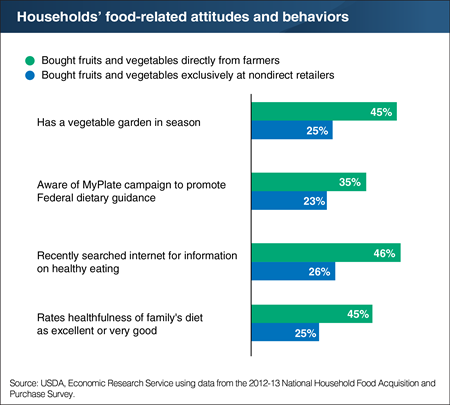
A recent ERS study analyzed spending on fruits and vegetables by the 4,826 households that participated in USDA’s National Household Food Acquisition and Purchase Survey (FoodAPS). Among these households, 170 bought some of their fruits and vegetables directly from farmers at roadside stands, farmers’ markets, or other direct-to-consumer (DTC) outlets during their week of participation in the survey. Another 3,388 households bought fruits and vegetables exclusively at nondirect food stores. The researchers found that purchasing fruits and vegetables at a DTC outlet was positively associated with several healthy practices. For example, people buying fruits and vegetables directly from farmers were more likely to have a vegetable garden (45 versus 25 percent of non-DTC shoppers), to be aware of USDA’s MyPlate campaign to promote Federal dietary guidance, and to search the internet for information on healthy eating. Households that bought fruits and vegetables directly from farmers were also more likely to rate the healthfulness of their diets as excellent or very good. This chart appears in the ERS report, The Relationship Between Patronizing Direct-to-Consumer Outlets and a Household’s Demand for Fruits and Vegetables, January 2018.
Thursday, January 25, 2018
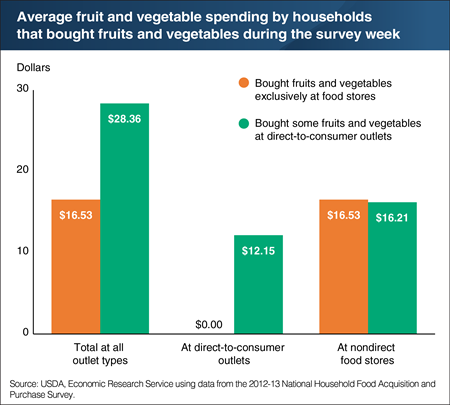
ERS researchers recently used USDA’s National Household Food Acquisition and Purchase Survey (FoodAPS) data to investigate the relationship between spending for fruits and vegetables and shopping at farmers’ markets, roadside stands, and other direct-to-consumer (DTC) outlets. The researchers looked at two groups of households—those that bought fresh and processed fruits and vegetables exclusively at nondirect food stores and those that purchased these foods at both DTC outlets and stores. Households that bought fruits and vegetables directly from farmers spent an average of $12.15 per week at DTC outlets on these foods. They spent another $16.21 on fruits and vegetables at food stores, about as much as households that bought fruits and vegetables exclusively at stores. The study measured the impact that buying directly from farmers has on a household’s overall fruit and vegetable expenditures and found evidence of a positive impact, even after controlling for other demand determinants like income, education, and a household’s attitudes toward food and nutrition. The data for this chart are from the ERS report, The Relationship Between Patronizing Direct-to-Consumer Outlets and a Household’s Demand for Fruits and Vegetables, released on January 24, 2018.
Wednesday, June 22, 2016
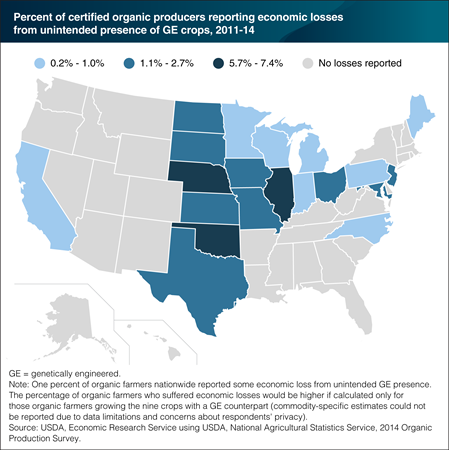
U.S. organic farmers, and conventional farmers who produce crops for non-GE (genetically engineered) markets, must meet the tolerance levels for accidental GE presence set by domestic and foreign buyers. If their crops test over the expected tolerance level, farmers may lose their organic price premiums and incur additional transportation and marketing costs to sell the crop in alternative markets. Although data limitations preclude estimates of the impact just on organic farmers who grow the 9 crops with a GE counterpart, the data do reveal that 1 percent of all U.S. certified organic farmers in 20 States reported that they experienced economic losses (amounting to $6.1 million, excluding expenses for preventative measures and testing) due to GE commingling during 2011-14. The share of all organic farmers who suffered economic losses was highest in Illinois, Nebraska, and Oklahoma, where 6-7 percent of organic farmers reported losses. These States have a high percentage of farmers that produce organic corn, soybeans, and other crops with GE counterparts. While California has more organic farms and acreage than any other State, most of California’s organic production is for fruits, vegetables and other specialty crops that lack a GE counterpart. This map is based on data found in the ERS report, Economic Issues in the Coexistence of Organic, Genetically Engineered (GE), and Non-GE Crops, February 2016.
Monday, April 4, 2016
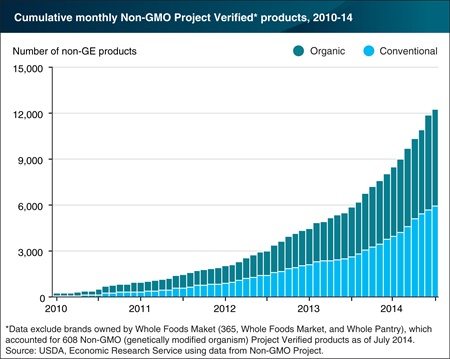
Genetically engineered (GE) crops are now widely used to produce breakfast cereals, corn chips, soy protein bars, and other processed foods and food ingredients, and a market for foods produced without crops grown from GE seed has emerged. The Non-GMO Project is a private group that provides verification services for products made according to best practices for genetically modified organism (GMO) avoidance. In 2014, the Non-GMO Project Verified label appeared on nearly 12,500 products with unique universal product codes (UPC), up from fewer than 1,000 in 2010. Many of the food products verified under this protocol, and bearing the Non-GMO Project Verified butterfly logo, are not at risk of GE contamination: that is, they do not contain corn, soybeans, or other crops for which GE varieties are available. Also, over half of the products verified under this protocol are certified organic under USDA’s organic regulations, which already prohibit the use of genetic engineering in organic production and processing. Non-GMO Project Verified labeling currently accounts for most of the conventionally grown U.S. products that are non-GE verified. This chart appears in the ERS report, Economic Issues in the Coexistence of Organic, Genetically Engineered (GE), and Non-GE Crops, February 2016.
Thursday, December 11, 2014
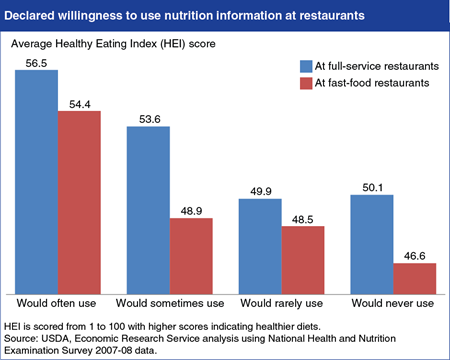
Menu-labeling regulations recently released by the U.S. Food and Drug Administration will require chain restaurants and other retail food chains that sell restaurant-type foods to post the calorie content of standard menu items. This will allow diners to make more informed decisions, if they notice and use the information. A recent ERS study, Menu Labeling Imparts New Information About the Calorie Content of Restaurant Foods, concluded that while many Americans may already be making crude choices between low- and high-calorie menu items, the new regulations will allow them to refine their choices. In another ERS study, researchers found that adults who already practice healthy dietary habits were more likely to use calorie information when eating out. Strongly correlated with a person’s declared willingness to use nutrition information was his or her Healthy Eating Index (HEI) score, which assesses an individual’s conformance to Federal dietary guidance. People who said that they would use nutrition information "often" in both fast-food and full-service settings have the highest average HEI scores, both above the national average of 53.1, followed by those who said they would use it "sometimes." The statistics in this chart are from the ERS report, Consumers’ Use of Nutrition Information When Eating Out.
Wednesday, September 24, 2014
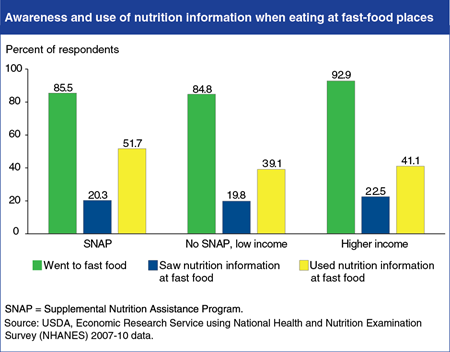
Questions in the 2007-08 and 2009-10 National Health and Nutrition Examination Survey (NHANES) allow researchers to examine demographic and health-related characteristics of consumers who use nutrition information when eating away from home. Using these data, ERS researchers found differences across population subgroups. Participants in USDA’s Supplemental Nutrition Assistance Program (SNAP) and low-income nonparticipants are less likely to go to fast-food places than are higher-income people. About 85 percent of SNAP participants and low-income nonparticipants said they ate at fast-food places during the previous 12 months, compared with 93 percent of higher-income people. All three groups are about equally likely to notice nutrition information on fast-food menus. However, upon seeing the information, SNAP participants are more likely to use it (52 percent) than low-income nonparticipants (39 percent) and higher-income people (41 percent). This chart appears in “Calorie Labeling on Restaurant Menus—Who Is Likely to Use It?” in the September 2014 issue of ERS’s Amber Waves magazine.
Wednesday, July 16, 2014
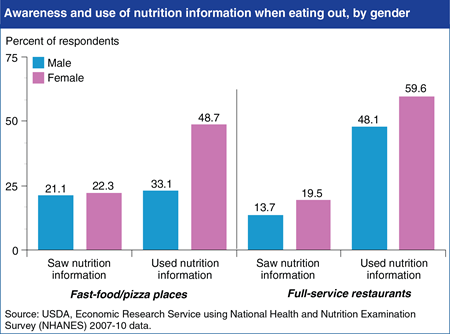
The 2010 Affordable Care Act includes a provision that will require restaurant chains with 20 or more locations to provide consumers with calorie information on menus and other nutrition information on demand. Understanding who uses current nutrition information provided voluntarily by eating places is useful for anticipating the Act’s impact. Using data from the 2007-08 and 2009-10 National Health and Nutrition Examination Survey, ERS researchers found that roughly 90 percent of respondents visited a fast-food or pizza place in the last year and about 88 percent patronized a full-service restaurant. Less than a quarter of those respondents reported seeing nutrition information. In general, women were more likely to see the nutrition information than men, and also more likely to use it in making their eating out selections. For example, in fast-food and pizza places, 48.7 percent of women who saw nutrition information used it, while only 33.1 percent of men did. In full-service restaurants, 59.6 percent of women who saw nutrition information used it, compared to 48.1 percent of men. This chart is based on statistics found in the ERS report, Consumers’ Use of Nutrition Information When Eating Out, released on June 27, 2014.
Monday, November 18, 2013
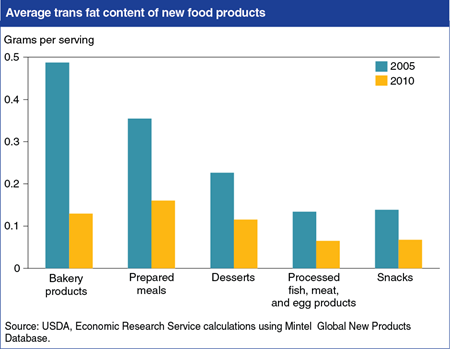
The U.S. Food and Drug Administration (FDA) announced on November 7th that it plans to take further steps to reduce trans fats in processed foods. Since 2006, the FDA has required food manufacturers to post the amount of trans fats contained in their products. In response to the labeling regulations and media attention to the negative health effects of trans fat consumption, food manufacturers reduced their use of trans fats. ERS researchers found that the average trans fat level for new bakery products (including reformulated ones) declined from 0.49 grams per serving in 2005 to 0.13 grams in 2010—a decline of 73 percent. Trans fat levels for new prepared meals, desserts, snacks, and processed fish, meat, and egg products declined by about 50 percent over the period. More information about trans fats in new food products can be found in the ERS report, New Food Choices Free of Trans Fats Better Align U.S. Diets With Health Recommendations, EIB-95, April 2012.


