ERS Charts of Note
Subscribe to get highlights from our current and past research, Monday through Friday, or see our privacy policy.
Get the latest charts via email, or on our mobile app for  and
and 
Wednesday, April 3, 2024
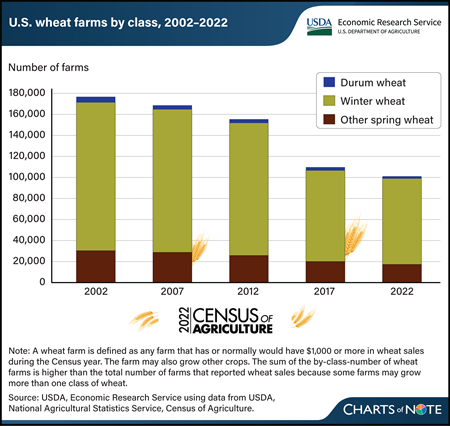
The number of farms producing wheat for grain declined substantially from 2002 to 2022, according to new data from USDA, National Agricultural Statistics Service (NASS) 2022 Census of Agriculture. In 2022, the number of U.S. farms reporting wheat production was 97,014, a 43-percent decrease compared with the 2002 census, when 169,528 farms reported wheat production. The reduction in the number of farms producing wheat was spread across all classes of wheat. The number of farms producing winter wheat—84 percent of U.S. wheat farms in 2022—dropped by nearly 60,000, or 42 percent, between the 2002 and 2022 censuses. Farms producing durum wheat decreased by the largest percentage, down 59 percent from 2002. The number of farms growing spring wheat (other than durum) declined 43 percent from 2002 to 2022. During the same time period, total volume of U.S. wheat produced trended down slightly, largely because of less acreage being harvested. As the profitability of other crops rises, wheat is increasingly planted in rotation with more profitable corn or soybean crops. Among major wheat-producing States, Kansas, which accounts for 15 percent of all U.S. wheat farms, saw a reduction of 9,716 farms—a 40-percent decrease from 2002 to 2022. Texas and Oklahoma reported decreases of 54 and 47 percent, respectively, between 2002 and 2022. Together, these 3 States harvested nearly 32 of percent of the volume of winter wheat produced in 2022, according to data reported by NASS in the Small Grains Annual report. For more details on the 2022 Census of Agriculture, see the NASS Census of Agriculture website. Information on trends in the wheat production sector can be found in the special article, “U.S. Census of Agriculture: Highlighting Changing Trends in Wheat Farming” in USDA, Economic Research Service’s March 2024 Wheat Outlook.
Wednesday, January 10, 2024
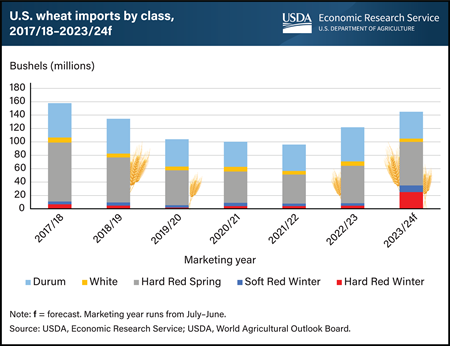
U.S. wheat imports are forecast at their highest in 6 years for the 2023/24 marketing year (July–June). Consecutive years of drought in key U.S. growing regions of hard red winter wheat, an ingredient used for making bread, Asian noodles, and flour, have tapered U.S. output, elevating domestic prices. Millers have sought less expensive sources, including competitively priced wheat from the European Union (EU). U.S. imports of hard red winter wheat, mostly from the EU, for 2023/24 are at 25 million bushels, a record high, and up from 5 million bushels from 2022/23. This trade flow is atypical. U.S. wheat imports are normally driven by hard red spring and durum wheat from neighboring Canada. In 2017/18, imports from Canada of both classes of wheat were elevated because of drought-related supply issues in the United States. While U.S. imports of hard red winter wheat are elevated in 2023/24, imports of soft red winter and white wheat are relatively close to normal levels. Related to tight supplies of this hard red winter wheat in 2023/24, U.S. exports of this class of wheat are forecast at their lowest level on record. This chart is drawn from the November 2023 Wheat Outlook, published by USDA, Economic Research Service.
Wednesday, August 30, 2023
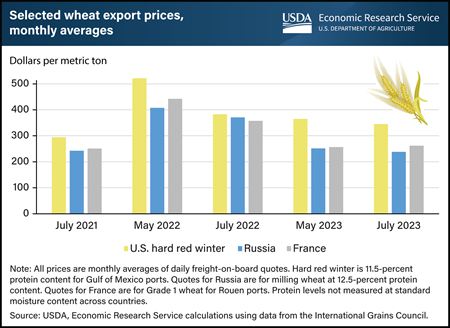
After reaching historic highs in May 2022, U.S. and global wheat prices have since cooled as supply concerns for many key wheat exporters have abated. Wheat export prices for the United States, Russia, and France in July 2023 are all well below the peaks observed in May 2022 as an effect of Russia’s invasion of Ukraine in February 2022. Ample wheat supplies expected in the 2023/24 marketing year (July–June) in the European Union, of which France is a member, and Russia are contributing to low prices for those exporters. Markets recently reacted to the July 17 expiration of the Black Sea Grain Initiative, which had sustained Ukraine’s exports through the Black Sea for nearly a year. Russia’s subsequent attacks on Ukraine’s port infrastructure were further reflected in global wheat prices. However, Ukraine is expected to continue shipping some commodities via alternative routes, so price changes were relatively minimal compared with more extreme swings at the start of the conflict. Prices for other suppliers, such as France, were up slightly from May 2023 but 27 percent lower than in July 2022. U.S. hard red winter wheat export prices decreased 10 percent in July 2023 from July 2022 and were 34 percent lower from May 2022. Even so, they are higher compared with other key exporters, partly driven by ongoing drought in major U.S. growing regions. This chart is drawn from the USDA, Economic Research Service Wheat Outlook, August 2023.
Wednesday, February 22, 2023
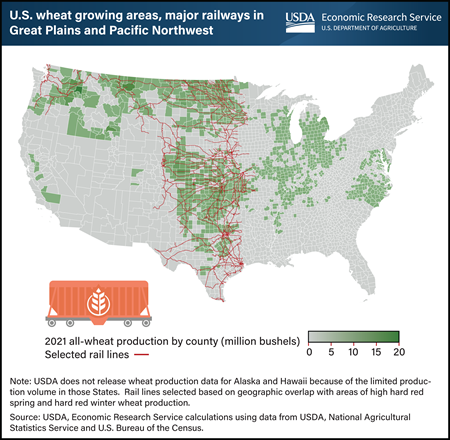
About half of all wheat grown in the United States is exported, and geography largely determines the mode of transportation to ports. U.S. wheat production is heavily concentrated in the Great Plains and Northern Plains regions, which include Oklahoma, Kansas, South and North Dakota, and Montana. Wheat is also grown in the Midwest, parts of the Southeast, and the Pacific Northwest (PNW) regions, as well as California. The inland waterways of the Mississippi River and the Columbia-Snake River system enable exporters of soft red winter wheat and white wheat to use transportation by barge to move wheat to export facilities in the Gulf of Mexico and the PNW, respectively. In contrast, rail transportation dominates in the vast wheat-producing areas west of the Mississippi and east of the PNW. In this region, the long distances to ports and a lack of navigable waterways make freight transportation by truck or barge difficult or impossible. Producers of hard red spring wheat, which is primarily grown in the Northern Plains, are served by rail lines that run to Washington State and Oregon, providing easy access to ocean vessels that can transport wheat to markets in Asia and the rest of the world. Similarly, hard red winter (HRW) wheat production areas in the Central and Southern Plains are directly connected by rail to Mexico, the top import market for HRW. It is also shipped by rail from the Plains to export terminals in the Gulf of Mexico. From 2014 to 2019, about 50 to 60 percent of wheat exports were transported to port by rail. This chart first appeared in the USDA, Economic Research Service’s Wheat Outlook, published in December 2022.
Wednesday, February 15, 2023
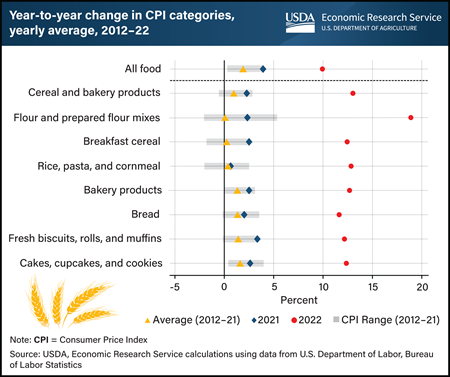
Consumer prices for wheat-based products were up substantially in 2022 compared to 2021, as indicated by the Consumer Price Index (CPI) data published by the U.S. Department of Labor, Bureau of Labor Statistics. Price levels of a variety of wheat products were up more than 10 percent from 2021, outpacing the rate of inflation in the broader “all food” category, which was up 9.9 percent, more than double the average increase of the previous decade. The average price level across the cereals and bakery products category was up 13 percent in 2022, well above the previous year’s increase (2.3 percent) and more than three times as large as any year in the past decade. Prices for flour and prepared flour mixes were nearly 19 percent higher in 2022, far exceeding the average from the previous decade (0.2 percent). Commodity prices for wheat were elevated in 2021 and 2022, but the increase in prices for wheat-based consumer products did not fully appear until 2022. Consumer price changes tend to lag price changes at the commodity level, partly based on the tendency of processors to purchase inputs well in advance. Rising input prices for non-wheat ingredients—such as eggs and butter, which tend to feature prominently in wheat food products—in addition to elevated labor and fuel expenses have all contributed to wheat food price inflation in 2022. This chart is drawn from the USDA, Economic Research Service Wheat Outlook, February 2023.
Tuesday, January 31, 2023
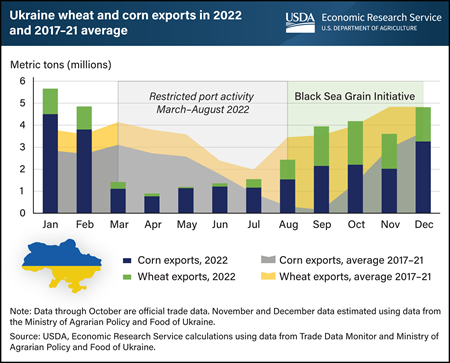
Ukraine’s corn and wheat exports have almost returned to seasonal-average levels since summer 2022, when Ukraine, Russia, Turkey, and the United Nations signed the Black Sea Grain Initiative to reopen Black Sea routes. Russia’s invasion of Ukraine in February 2022 led to elevated security risks and infrastructure damage, causing Ukraine’s seaports to be almost completely cut off from March through July. The restrictions limited exports and led to an accumulation of corn and wheat stocks. As global exportable supplies diminished, international wheat export prices spiked. Signed in July 2022, the Black Sea agreement enabled the safe passage of Ukraine grain exports through three ports. That and ample corn and wheat stocks allowed Ukraine to export a larger combined volume of the two crops than the five-year average in September and October. In December, Ukraine was able to export more than 3.0 million metric tons of corn, the largest since the beginning of the war, and 1.6 million metric tons of wheat. The Black Sea Grain Initiative has increased the opportunities for Ukrainian grain to leave the country and has relieved some price pressures internationally, but uncertainty remains as the agreement is set to expire in mid-March 2023 and may not be extended. This chart was drawn from “Feature Article: Changes in Ukraine Wheat and Corn Export Patterns Since the Start of the Ukraine-Russia War,” which appeared in the USDA, Economic Research Service’s Wheat Outlook: January 2023.
Tuesday, November 29, 2022
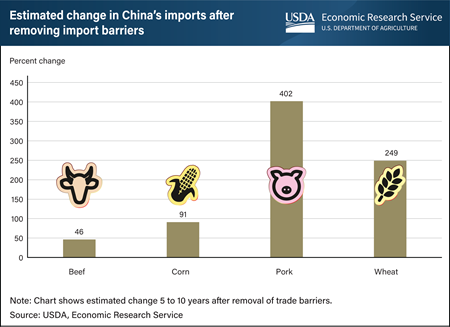
China imported more than $205 billion worth of agricultural products in 2021, including more than $37 billion from the United States, yet trade barriers deterred China’s imports from reaching even higher levels. China’s import barriers create what are called “price wedges,” in which domestic prices for agricultural commodities including beef, corn, pork, and wheat are higher than the world price. Researchers at USDA’s Economic Research Service (ERS) recently found that removing these price wedges would lead to increases in agricultural imports for the four commodities over the subsequent 5 to 10 years. For corn and wheat, removing price wedges was estimated to increase China’s imports by 91 and 249 percent, respectively. Both of these commodities are subject to a tariff-rate quota which could constrain additional imports. Removal of the beef price wedge was estimated to increase China’s beef imports by 46 percent, while for pork, it was estimated to increase China’s pork imports by 402 percent—the largest increase among the commodities considered. Overall, the benefits of removing these trade barriers would be widespread, increasing sales for producers in the United States and other exporting countries and yielding lower food prices for China’s consumers. This chart is drawn from the ERS report China’s Import Potential for Beef, Corn, Pork, and Wheat, published in August 2022.
_450px.png?v=1373.6)
Monday, October 31, 2022
Spring wheat, a major class of U.S. wheat, annually accounts for about 25 percent of all wheat produced in the United States and is grown primarily in the U.S. Northern Plains States, mostly in North Dakota and Minnesota. Overly wet field conditions in spring 2022 delayed planting in both North Dakota and Minnesota resulting in 26 and 35 percent, respectively, of spring wheat acres being planted after June 5—USDA, Risk Management Agency’s (RMA) final planting date of all counties in those two States. That acreage was reported to USDA, Farm Service Agency as being prevented from on-time planting. If a farmer has not planted by the final planting date, most crop insurance policies offer compensation to offset expenses associated with preparing to plant, called a prevented planting payment. Alternatively, when commodity prices are high, some producers may choose to plant late because of field conditions and receive the market price for their harvest crop rather than take a prevented planting payment. RMA projected pre-season prices for spring wheat in North Dakota and Minnesota at $9.19 per bushel, the highest price in the last decade (2012–21), which may have contributed to acreage being planted later. This chart is drawn from the special article, "Factors Influencing Prevented Planting for Spring Wheat" in Economic Research Service’s Wheat Outlook, September 2022.
_450px.png?v=1373.6)
Monday, October 17, 2022
U.S. production of durum—the primary class of wheat used to produce pasta—is expected to increase in the 2022/23 marketing year after last year’s drought reduced production to its lowest in 60 years. Production in 2022/23 is forecast at 64 million bushels, up 70 percent from the previous marketing year (2021/22), but below the average of the previous five years (2016/17–2020/21). Durum used for food in the 2022/23 marketing year is estimated at 80 million bushels, close to the historical average and slightly above 2021/22. Food use of durum was elevated in marketing years 2019/20 and 2020/21, fueled by surging consumer demand during the Coronavirus (COVID-19) pandemic, when shoppers stocked up on pasta while in quarantine. While the surge in demand has since subsided, consumer prices for wheat-based products including pasta are up substantially in 2022. This year’s larger durum crop, along with larger Canadian production, has eased some supply pressure; however, high commodity prices in general and elevated input, labor, and energy costs have each contributed to higher prices for the manufactured products of wheat, including pasta. The United States imports and exports durum every year, with imports typically larger. Net imports rise in years when production is lower. This chart is drawn from the USDA, Economic Research Service Wheat Outlook, October 2022.
Thursday, July 28, 2022
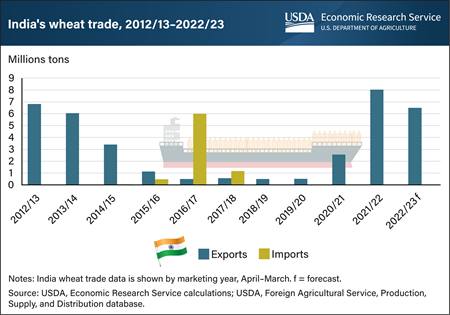
High global wheat prices and sales restrictions from some major exporters forced numerous wheat-importing countries to seek alternative suppliers in 2021 and early 2022. Foreign wheat buyers turned to India, one of the lowest-priced exporters, purchasing a record 8.033 million metric tons (MT) of India’s wheat in the 2021/22 marketing year (April/March). India’s wheat exports helped to offset reduced sales by other major exporters, including Russia, Ukraine, and the United States. Historically, India’s wheat exports are variable and largely dependent on domestic production, consumption, and export policies. In recent years, India’s production has exceeded consumption, resulting in increasing exportable supplies. As the 2022/23 marketing year begins, Ukraine’s seaports remain closed—limiting prospects for the nation’s wheat exports while enhancing the early outlook for India’s foreign sales. Indeed, in April 2022, India exported a record volume of wheat. However, a heat wave late in the growing season curtailed India’s wheat production, leading the Government of India to impose an export ban in May 2022 to ensure sufficient supplies were available to satisfy domestic demand. After imposing the ban—which allows for government-to-government sales for humanitarian purposes—India has continued to receive requests for exports to Bangladesh, Indonesia, Egypt, and other countries. Despite a record month of exports in April, the restriction is projected to limit India’s export potential for the remainder of the 2022/23 marketing year. India’s exports are projected to be 1.5 million MT lower than in 2021/22, but 3.9 million MT higher than 2020/21. This chart was drawn from “Country Focus: India,” which appeared in the USDA, Economic Research Service’s June 2022 Wheat Outlook.
Wednesday, July 20, 2022
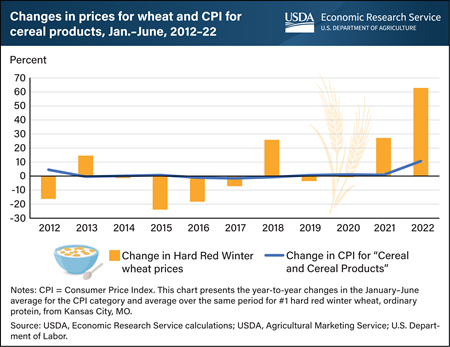
Consumer prices for cereal products as measured through the Consumer Price Index (CPI)—a widely used measure of inflation—rose about 11 percent during the January–June 2022 period from the same period in 2021. This marked the largest year-over-year increase in this 6-month period since 1981. The rise in consumer prices for cereal products tracks a more substantial increase in wheat prices. Cash wheat prices in Kansas City, MO—the market price that most closely reflects the prices mills pay for wheat—were up 63 percent from the same period in the previous year. This heightened volatility follows a historically typical pattern. Price changes in commodity markets tend to be relatively more extreme than the changes in consumer prices. Generally, commodity prices make up a small portion of the value of these cereal products because of the level of transformation and transportation that the products undergo through the value chain. Further, changes in consumer prices may lag behind commodity price movements based on the tendency of processors to contractually commit to purchases of inputs several months in advance. Additional factors such as the high price of other ingredients as well as elevated labor and fuel costs are driving the prices of cereal products upward. This chart was drawn from the USDA, Economic Research Service’s (ERS) June 2022 Wheat Outlook. See also the ERS Chart of Note, Wheat and wheat flour prices surge, while prices remain stable for bread, cereal, and bakery products.
Friday, April 22, 2022
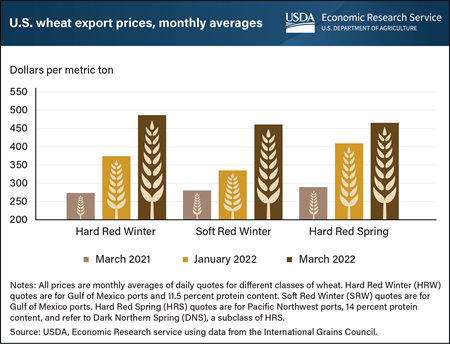
Beginning in February 2022, already elevated global wheat prices surged in the wake of the conflict between Russia and Ukraine, who together accounted for 28 percent of all wheat exports in marketing year 2020/21. Throughout the current marketing year (2021/22), tight supplies have been forecast for key exporting countries including Argentina, Australia, Canada, the European Union, Kazakhstan, Russia, Ukraine, and the United States. Collectively for these countries, ending stocks are projected at the lowest level since the 2013/14 marketing year. For most of the current marketing year, tight supplies have supported relatively high global wheat prices. Those prices have been driven higher as commodity markets reflect uncertainty about not only the ability of Russia and Ukraine to continue exporting in coming months, but also the implications of the conflict on Ukraine’s spring planting which typically begins in March. Since the conflict began, U.S. export prices have risen for Hard Red Winter (HRW) and Soft Red Winter (SRW)—the two wheat classes that most directly compete with Russian and Ukrainian wheat. Average export prices for HRW were up 78 percent in March from the same month in 2021, and SRW prices were up 64 percent. U.S. Hard Red Spring (HRS), typically the highest priced U.S. wheat, is currently priced lower than HRW and only slightly above SRW. Domestic transportation challenges and dry conditions in major HRW production areas have also underpinned U.S. prices and allowed major competitors to maintain a large pricing advantage. Most HRS exports are shipped out of the Pacific Northwest and are largely destined for Asian markets. Because HRS exports do not compete directly with Russia and Ukraine, the price reaction of this wheat class has been less extreme when compared with the more dramatic price reactions of the other classes. This chart first appeared in USDA, Economic Research Service’s Wheat Outlook, March 2022, and has been updated with recent data from the Wheat Outlook, April 2022.
Monday, January 3, 2022
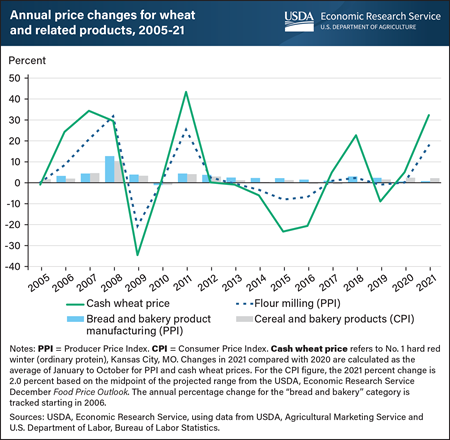
Wheat prices at the farm level rose substantially in 2021, but these changes did not result in correspondingly higher prices for consumer products made from wheat. This disparity reflects the historical pattern most observable from 2005–12, wherein the degree of movement in prices of wheat products was markedly less than the more dramatic changes in wheat prices. Cash wheat prices in Kansas City, MO—the market price that most closely reflects the prices mills pay for wheat—were up by more than 30 percent in 2021 from the same time in 2020. Similarly, the Producer Price Index (PPI) for flour milling—a measure of how wholesale flour prices change over time—also rose, registering an 18-percent year-on-year increase in 2021. In contrast, prices U.S. consumers paid for wheat-containing products, as measured by the Consumer Price Index (CPI), for cereal and bakery products, is projected up 2 percent. This year-to-year increase is below the overall inflation rate for 2021 and similar to the previous year’s gains. The muted and lagged impact of the wheat grain price surge on consumer product prices is in line with historical precedent in which commodity prices usually represent a small share of the consumer food dollar that is spent on processed foods such as bread and pasta. This chart was drawn from “The Effect of Rising Wheat Prices on U.S. Retail Food Prices,” which appeared in the USDA, Economic Research Service’s November 2021 Wheat Outlook.
Wednesday, October 13, 2021
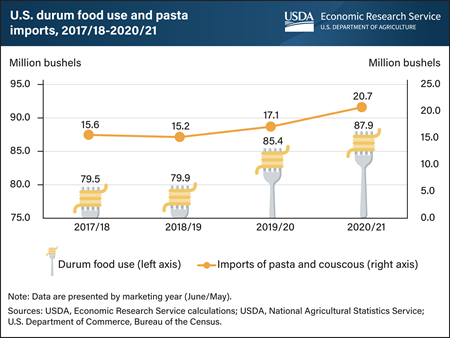
Companies usually create pasta and couscous with durum, a specific class of wheat. The United States typically consumes about 80 million bushels of durum per year, with pasta accounting for the bulk of this consumption. Toward the end of the 2019/20 (June-May) marketing year, U.S. durum used for food manufacturing expanded sharply as consumer demand for pasta products surged with the onset of the Coronavirus (COVID-19) pandemic. Consequently, more durum was used for food manufacturing in the United States in 2020/21 and total durum food use reached a record high of nearly 88 million bushels. Not only did the domestic milling of durum for pasta increase, imports of pasta and couscous in 2019/20 rose 13 percent from the year prior. These imports surged an additional 21 percent in 2020/21. As the United States emerges from the effects of the COVID-19 pandemic in 2021/22, imports of durum grain and products are expected to remain robust despite slowing consumer demand for pasta products. Widespread drought in key durum-producing regions in 2021/22 has dampened domestic production, thus import demand is expected to remain strong. This chart is drawn from USDA, Economic Research Service’s Wheat Outlook: September 2021.
Friday, September 17, 2021
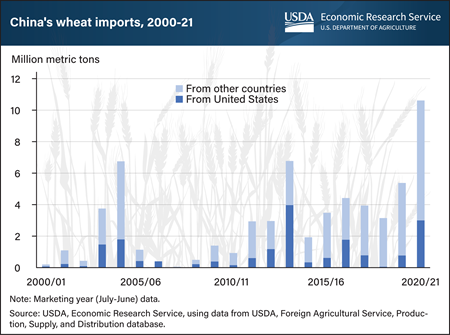
China is the world’s largest consumer of wheat, accounting for 19 percent of global wheat consumption in marketing year 2020/21 (July–June), more than four times the U.S. share. China also became a leading importer during 2020/21, with purchases estimated at 10.6 million metric tons, China’s highest import total since the 1990s. USDA forecasts China’s 2021/22 imports at 10 million metric tons. Before the 2010/11 marketing year, China’s wheat imports typically totaled 1 million metric tons or less. More recently, wheat imports totaled 3 to 5 million metric tons most years between marketing years 2011/12 to 2019/20. The surge in imports in 2020/21 can be attributed to China’s strong demand for wheat use in animal feed, replenishment of the Chinese Government reserves with high-quality wheat, and efforts to meet import commitments in the U.S.-China Phase One trade agreement. According to China’s customs data, the United States supplied 3 million metric tons of 2020/21 wheat imports—approximately a 28-percent share. This chart first appeared in the USDA, Economic Research Service (ERS) report, Potential Wheat Demand in China: Applicants for Import Quota, August 2021, and includes updated data from ERS’ Wheat Data product.
Wednesday, August 18, 2021
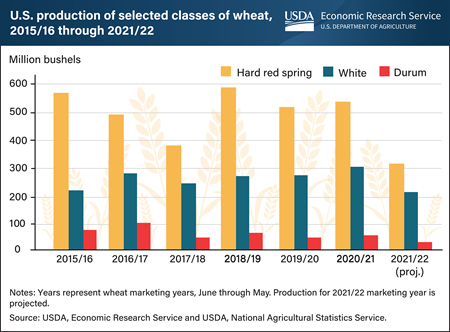
Widespread drought across the northern and western regions of the United States has dampened prospects for projected production and exports in the 2021/22 marketing year of three classes of U.S. wheat: hard red spring, white, and durum. Cultivation of hard red spring wheat, typically the second largest class of U.S. wheat, is concentrated in the Northern Plains, where about 99 percent of production is being grown in an area experiencing drought. Harvest of this class is projected to fall 42 percent from the previous year to the lowest level in more than 30 years, while exports are expected to contract to the lowest volume in more than a decade. U.S. durum production, which is also concentrated in the Northern Plains, is also projected to fall substantially in the 2021/22 marketing year to the lowest level in 60 years. With the United States generally a net importer of durum, larger imports from Canada are expected. Drought has also affected the Pacific Northwest region, where the majority of U.S. white wheat is produced, resulting in a 29 percent year-to-year decline in production of that class. With white wheat production at the lowest level on record dating back to the 1974/1975 marketing year, exports—mainly destined for markets in Asia—are projected down 41 percent from the prior marketing year. This chart is drawn from the USDA, Economic Research Service Wheat Outlook, published in August 2021.
Wednesday, June 2, 2021
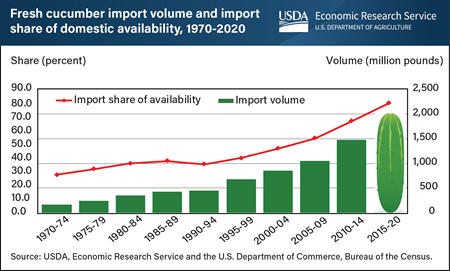
Driven largely by the increasing popularity of salads and “mini” or snacking varieties, U.S. demand for fresh cucumbers has been on an upward trend since the 1970s. Reflecting rising consumer demand, import volume has continued on a 50-year upward trend, contributing to the crowding-out of domestic field-grown production (down 62 percent since 2010). Before 2005, domestic fresh cucumber production exceeded the amount imported each year. Imports grew from a 35 percent share of availability in 1990-94 to 80 percent in 2015-20. By 2020, imports accounted for almost 90 percent of the domestic market. The share of imports in the U.S. fresh cucumber market continues to trend higher because of year-round demand for cucumbers and for varieties that tend to be cultivated in greenhouses. Imported cucumbers typically enter the United States during the winter, autumn, and early spring months when domestic supplies are limited. Fresh cucumber imports, largely from Mexico and Canada, totaled nearly 2.2 billion pounds in 2020, and 18 percent of imported cucumbers were grown in protected structures such as greenhouses. To a lesser extent, increased domestic greenhouse production, which now accounts for about 11 percent of U.S.-grown cucumbers, has siphoned off demand for field grown fresh cucumbers over the past two decades. This chart appeared in the Economic Research Service’s April 2021 Vegetable and Pulses Outlook.
Wednesday, February 10, 2021
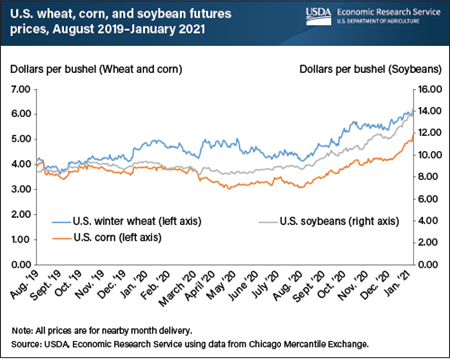
Futures prices—the price of a contract to deliver a commodity at a certain time in the future—for wheat, corn, and soybeans have been trending upward since August 2020. This 6-month trend of rising prices accelerated in the first weeks of 2021, demonstrating stronger price gains in anticipation of USDA’s revised production forecasts for major U.S. grains in the World Agricultural Supply and Demand Estimates (WASDE) for January 2021. Hard red winter wheat futures prices for the nearby month (e.g., prices associated with an active futures contract with the shortest time to maturity/delivery) rose 72 cents per bushel (13 percent) during the 30-day period just ahead of the January 12, 2021 release of the WASDE. During the same 30-day period, corn and soybean contracts for nearby month delivery rose 98 cents and $2.69 per bushel, respectively (approximately 23 percent each), and the season average farm price of soybeans reached their highest level since the marketing year of 2013-14. The realization of tightening supplies coupled with robust demand from export markets, most notably China, have stimulated steady price increases for the big three U.S. row crops—wheat, corn, and soybeans. Additionally, dry conditions in key areas of corn and soybean production in South America have reduced regional production prospects and the outlook for global supplies, providing further support to associated U.S. commodity prices. This chart is drawn from the USDA, Economic Research Service’s January 2021 Wheat Outlook, Oil Crops Outlook, and Feed Grains Outlook reports.
Friday, December 4, 2020
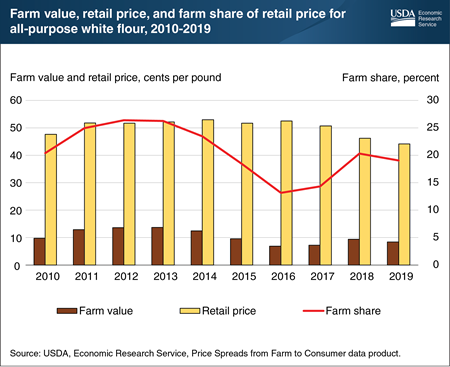
The farm share of the retail price of all-purpose white flour—the ratio of the price farmers receive for wheat to the price consumers pay for flour in grocery stores—averaged 13 to 14 percent in 2016 and 2017 before reaching 19 and 20 percent in 2018 and 2019. In the latter half of 2017, farm prices rose in connection with lower-than-expected U.S. wheat production. In mid-2018, as the 2017/18 U.S. wheat crop matured, dry conditions in the Northern Plains further trimmed wheat production prospects. In response, domestic wheat prices rose again, despite abundant global wheat supplies. Ultimately, U.S. wheat farmers received an average price of $4.72 per bushel for their 2017/18 crop, up from $3.89 in the previous year. The farm value of the amount of hard red winter wheat needed to make one pound of all-purpose white flour increased from 7 cents in 2017 to 9 cents in 2018 before falling back to 8 cents in 2019. The average retail price of flour fell from 51 cents per pound in 2017 to 46 cents in 2018 and 44 cents in 2019. Costs for milling, packaging, transporting, and retailing also affect what consumers pay for flour at grocery stores. The Economic Research Service (ERS) forecasts higher farm prices for wheat during the 2020/21 marketing season and moderately higher retail prices for cereal and bakery goods, a category of products that includes all-purpose white flour, through 2020 and 2021. This chart is based on the Price Spreads from Farm to Consumer data product on the ERS website.
Monday, November 30, 2020
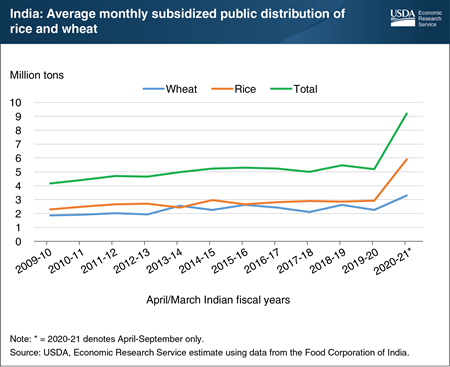
As part of its response to the economic impacts of the COVID-19 pandemic, India has sharply increased its distribution of wheat and rice to the 800 million Indian citizens (about 58 percent of the population) eligible to receive subsidized rations. Facing major shocks to employment and incomes associated with nationwide measures to control the virus, India announced a relief program in March 2020 worth $22.3 billion. The program, now extended through November 2020, supplements the highly subsidized, standard monthly ration of 5 kilograms per person of wheat or rice with an additional free allocation of 5 kilograms. Implementation of the program led to a 75-percent increase in India’s total wheat and rice distribution from April to September compared with earlier years, with the average monthly distribution of rice more than doubling. India is a major global holder of food security stocks of both rice and wheat, as well as the world’s largest rice exporter—with 2021 exports forecast at 12.5 million tons. While India is currently forecast to maintain large surpluses of wheat and rice in government stocks during the October 2020-September 2021 marketing year, the sharp increase in subsidized domestic distribution has the potential to substantially reduce those food security stocks if the COVID-19 relief program is extended beyond November 2020 into the 2020-21 marketing year. This chart was drawn from the Economic Research Service’s Rice and Wheat Outlooks, November 2020.


