ERS Charts of Note
Subscribe to get highlights from our current and past research, Monday through Friday, or see our privacy policy.
Get the latest charts via email, or on our mobile app for  and
and 
Monday, April 1, 2024
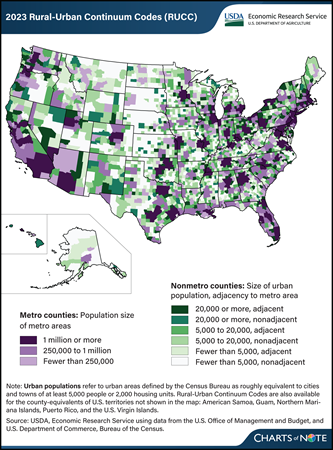
The USDA, Economic Research Service (ERS) has updated its Rural-Urban Continuum Codes (RUCC), which classify all U.S. counties into nine categories from most urban to most rural. The RUCC distinguish U.S. metropolitan (metro) counties by the population size of their metro area and nonmetropolitan (nonmetro) counties by their degree of urbanization and adjacency to a metro area. The RUCC allow researchers and policymakers to add nuance to their county-level analyses by incorporating the population of the Census Bureau’s urban areas with the OMB’s definition of metropolitan counties. The most urban counties belong to metro areas (shown in purple on the map). These are divided into three categories based on the total population of the metro area. Counties that are commonly considered rural are those that do not belong to metro areas (shown in green on the map). The RUCC classify these nonmetro counties into six categories based on the number of people who live in urban areas (small cities or towns) and whether the county is adjacent to a metro area. The most urban of the nonmetro counties are those that had urban area populations of at least 20,000 and are most prevalent in regions such as the Northeast, Great Lakes, and along the coasts. The most rural of the nonmetro counties had urban area populations of fewer than 5,000 and are the most prevalent in the Great Plains and Corn Belt. Counties classified as adjacent to metro areas are considered more urban than their nonadjacent counterparts because their residents have greater access to the diverse employment opportunities, goods, and services available in metro areas. For more information on the RUCC, please see the ERS data product Rural-Urban Continuum Codes.
Thursday, March 7, 2024
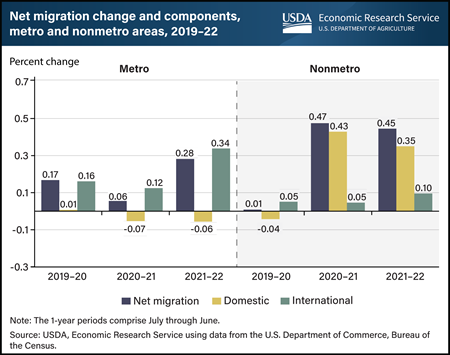
Both rural (nonmetro) and urban (metro) populations grew because of increased migration over the last few years; however, the sources of the increased migration are different. In 2020–21 and 2021–22, rural areas experienced an increase in population because more people moved from urban to rural areas than in the opposite direction, a reversal of domestic migration trends from the previous decade. Domestic migration occurs when people move among areas within the United States. Net domestic migration in rural areas jumped from near zero in 2019–20 to more than 0.35 percent in the last two years. Fear of exposure to Coronavirus (COVID-19) in urban areas and the subsequent increase in remote work contributed to this dramatic shift in migration patterns. Conversely, urban areas increased their population through migration from other countries. International migration to urban areas reached a peak of 0.34 percent in 2021–22. The growth in migration rates for both urban and rural areas are somewhat offset by elevated death rates (which are falling from pandemic highs) and lower birth rates. This chart is drawn from the USDA, Economic Research Service report Rural America at a Glance, published in November 2023.
Wednesday, March 6, 2024
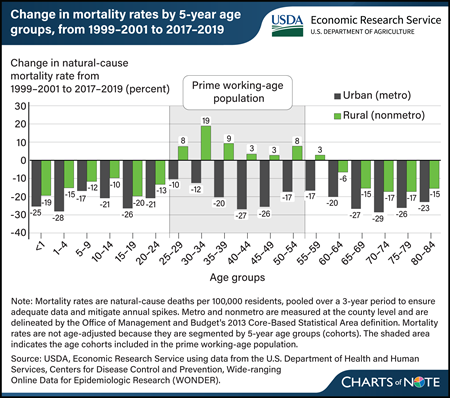
Over the last two decades, disease-related (natural-cause) mortality rates have widened between rural and urban areas, especially for the prime working-age population (aged 25–54). Researchers with USDA, Economic Research Service (ERS) compared natural-cause mortality in rural and urban areas between two 3-year periods, 1999–2001 and 2017–2019. They found the gap between rural and urban natural-cause mortality rates widened between the two time periods. Natural-cause mortality rates decreased across all age groups in urban areas. In rural areas, mortality rates decreased for most age groups (although not as much as for the same groups in urban areas) but increased for the prime working-age population. The rural group with the largest increase (19 percent) in natural-cause mortality rates was 30- to 34-year-olds. Increased mortality rates for people who are of prime working age are an indicator of worsening population health, which could have negative implications for rural families, communities, employment, and the economy. This chart appears in the ERS report The Nature of the Rural-Urban Mortality Gap, published in March 2024.
Wednesday, February 21, 2024
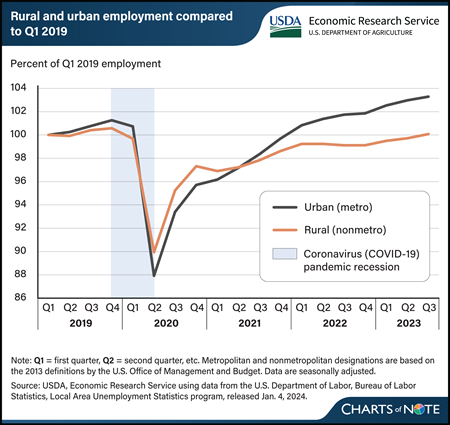
The Coronavirus (COVID-19) pandemic affected employment in rural and urban areas differently. Before the pandemic, employment growth was higher and unemployment rates were slightly lower in urban areas. However, these trends reversed during the pandemic. In the second quarter of 2020, urban employment fell to 88 percent of prepandemic (Q1 2019) employment levels, while rural employment fell to 90 percent of prepandemic levels. Unemployment during the pandemic reached a high of 13.3 percent in urban areas and 11.4 percent in rural areas, compared with prepandemic rates of 3.8 and 4.2 percent, respectively. Rural and urban employment grew quickly in the third and fourth quarters of 2020 as many sectors of the economy reopened. Employment growth slowed in 2021, but more in rural areas than in urban. Urban employment recovered to prepandemic levels by the first quarter of 2022, and the urban unemployment rate dropped below the rural rate once again in the second quarter of 2022. Meanwhile, the slow employment growth rate in rural areas in 2022 (0.5 percent) was similar to rates in the years between the Great Recession of 2008 and the COVID-19 pandemic. From 2010 to 2019, the annual average employment growth rate in rural areas was 0.4 percent compared with 1.6 percent in urban areas. Rural employment recovered to prepandemic levels in the third quarter of 2023, more than one year after urban employment did. Rural unemployment rates in 2023 were at their lowest point (3.6 percent) since before 1990. This figure updates data in the USDA, Economic Research Service report Rural America at a Glance, published in November 2023.
Wednesday, December 13, 2023
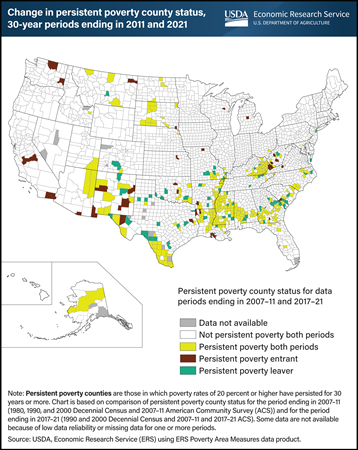
The number of counties classified as persistently poor has fallen over the last 10 years. Persistent poverty counties are those in which poverty rates of 20 percent or higher have persisted for 30 years or more. The USDA, Economic Research Service (ERS) has published poverty county classifications since the 1980s (using data from as early as the 1950s), which allow for the evaluation of changes in county poverty status over time. The most current persistent poverty classification covers the period from 1990 to 2021. ERS researchers examined changes between this classification and one from a decade earlier (data from 1980 to 2011). There were 318 persistent poverty counties in the 30-year period ending in 2021 compared with 353 for the period ending in 2011, a drop of 10 percent. Overall, 282 counties remained persistently poor from one period to the next, 36 counties entered persistent poverty status, and 70 left that category. The entrants are largely characterized by poverty among the resident Hispanic population, as well as re-entrants within historically poor areas such as central Appalachia. The counties that left persistent poverty status were predominantly in the Southern Coastal Plains, which includes much of the historically poor region known as the Black Belt. This chart uses data found in the ERS Poverty Area Measures data product, updated in December 2023.
Monday, December 4, 2023
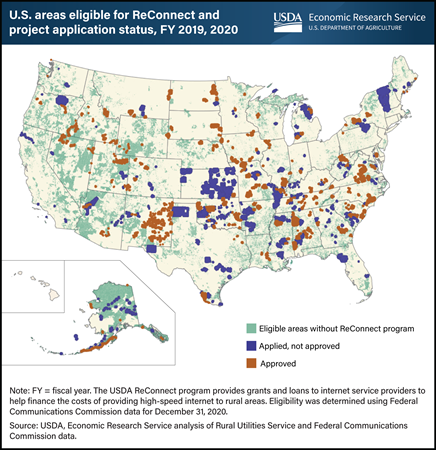
The ReConnect Program is USDA’s largest effort aimed at filling gaps in high-speed internet in unserved and underserved rural areas. The program was created on a pilot basis in 2018 and appropriated more than $5 billion between fiscal years 2018 and 2023. Its grants and loans provide funds that help the private sector provide broadband service to rural areas, which otherwise may not be profitable to reach. ReConnect reached an estimated 21 percent of the eligible rural population in its first two funding rounds, which involved applications submitted in FY 2019 and 2020. Applicants had to propose to provide a minimum broadband speed to all residences, businesses, and farms in proposed areas (25 megabits per second download and 3 megabits per second upload during the first two funding rounds). Most applicants were small telecommunications companies or cooperatives. Researchers with the USDA’s Economic Research Service examined proposed and approved projects from the applications submitted in fiscal years 2019 and 2020 to find that about 57 percent of proposed projects were funded. The most common reasons that applications were not approved were that broadband service was already available in the proposed service area, lack of financial feasibility of the proposal, and missing or insufficient information. This chart appears in the ERS report Three USDA Rural Broadband Programs: Areas and Populations Served, published in October 2023.
Thursday, November 16, 2023
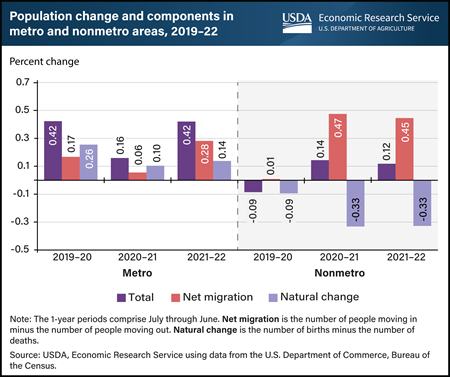
The rural (nonmetro) population growth that began with the Coronavirus (COVID-19) pandemic in 2020 continued into 2022, according to census population estimates. A sharp increase in net migration (the number of people moving in minus the number of people moving out) was the source of the growth. Migration to rural areas was 0.47 percent and 0.45 percent in 2020–21 and 2021–22, respectively, compared with 0.01 percent in the period before the pandemic. Overall, the rural population grew at 0.12 percent from mid-2021 through mid-2022 after accounting for the 0.33-percent decline caused by natural decrease (more deaths than births) in the same period. For rural areas, this recent growth is a reversal of population loss and near-zero migration in 2019–20 and comes after annual rural growth rates declined or were near zero in the previous 10 years. The population in metro areas followed a different trend in 2019–20 and 2020–21, dropping from 0.42 to 0.16 percent growth before returning to 0.42 percent in 2021–22. Roughly 46 million U.S. residents lived in rural areas in July 2022, making up 13.8 percent of the population. This chart is drawn from the ERS report Rural America at a Glance, published in November 2023.
Monday, November 6, 2023
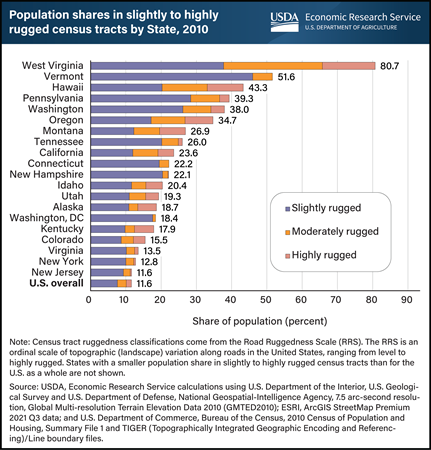
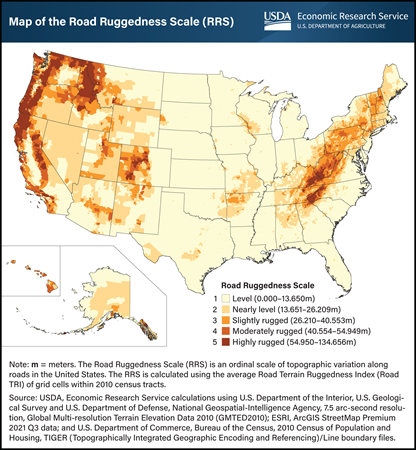
USDA, Economic Research Service (ERS) researchers analyzed the share of each State’s population living in rugged terrain using the Road Ruggedness Scale, a five-category measure created by ERS that classifies census tracts based on elevation changes along roads. They found that in 2010, West Virginia led the Nation with 80.7 percent of its population living in areas classified as either slightly, moderately, or highly rugged. It was followed by Vermont (51.6 percent), Hawaii (43.3 percent), Pennsylvania (39.3 percent), and Washington State (38.0 percent). In 19 States and the District of Columbia, a greater share of residents lived in slightly to highly rugged census tracts than for the Nation as a whole (11.6 percent). For most States near the top of the list, a large share of residents lived in highly rugged census tracts (the highest ruggedness category), notably West Virginia, Hawaii, Oregon, and Montana. However, despite having no highly rugged census tracts, Vermont and Connecticut still have enough residents in slightly and moderately rugged census tracts to be among the top 10 States with the highest population shares in rugged areas. While topographic variation, or “ruggedness,” is visually appealing and may spur economic growth, it can also make it more difficult to navigate land and waterways and limits space for residential and commercial expansion. Residents living in areas with rugged terrain may also require more time to travel to hospitals, schools, social services, grocery stores, and other critical destinations compared with those living in less rugged locations. This chart is drawn from data in the ERS report Characterizing Rugged Terrain in the United States, published in August 2023.
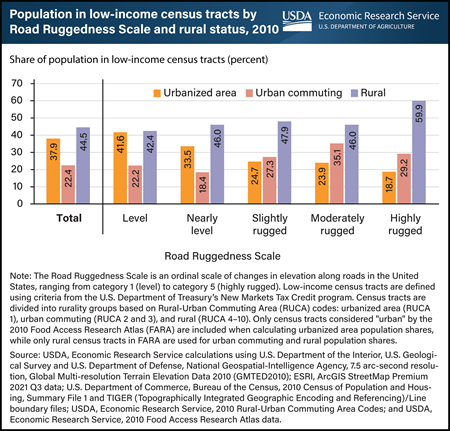
Uphill climb: The share of rural residents living in low-income areas increases with road ruggedness
Wednesday, November 1, 2023
In 2010, a higher share of rural residents lived in low-income census tracts, especially in places characterized by rugged terrain. Researchers with USDA, Economic Research Service (ERS) classified census tracts (the small geographic areas used to collect population data) by the change in elevation along their roads to create the new Road Ruggedness Scale. Using this scale in conjunction with data on income and how rural a place is, they found that as ruggedness increased, the share of rural residents living in low-income census tracts increased. In contrast, the share of residents in low-income census tracts in urbanized areas decreased as ruggedness increased. Nearly 60 percent of residents in highly rugged rural locations lived in low-income census tracts in 2010, compared with 42 to 48 percent of rural residents in less rugged census tracts. However, fewer than 20 percent of residents in highly rugged, urbanized areas lived in low-income census tracts, compared with nearly 42 percent of urbanized area residents in level census tracts. In urban commuting locations, the share of the population living in low-income census tracts generally increased with ruggedness, but with more variation in the trend. This chart appears in the ERS report Characterizing Rugged Terrain in the United States published in August 2023 and uses data available in ERS’s Ruggedness Scale data product.
Tuesday, October 31, 2023
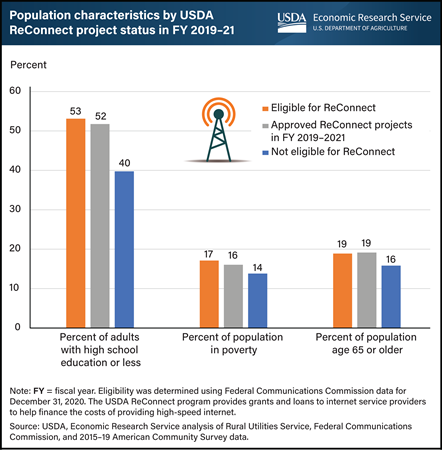
Households in nonmetro areas are more than four times as likely to lack broadband internet access as households in metro areas, according to December 2022 data from the Federal Communications Commission. To help bring broadband to rural areas, USDA’s ReConnect program—USDA’s largest rural broadband program—provides grants and loans to internet providers to help finance the costs of providing high-speed internet through broadband services. To be eligible for ReConnect funding, areas served by projects must be rural and have 90 percent or more of households without access to broadband at minimum upload and download speeds. USDA, Economic Research Service (ERS) researchers examined ReConnect projects proposed in fiscal years 2019 and 2020, finding that the populations of areas eligible for possible projects and areas of approved projects tended to have less formal educational attainment (a larger share of adults with high school or less), more poverty, and more people over the age of 65. About 53 percent of the population in ReConnect-eligible areas had high school or less educational attainment, compared with 40 percent in ineligible areas. Likewise, the poverty rate was higher in eligible areas (17 percent compared with 14 percent) as was the portion of the population over age 65 (19 percent compared with 16 percent). This chart appears in the ERS report Three USDA Rural Broadband Programs: Areas and Populations Served, published in October 2023.
Tuesday, October 17, 2023
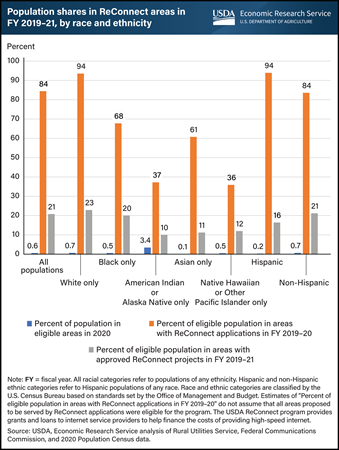
The ReConnect program is one of several USDA efforts to help improve broadband access in rural areas. Nearly 16 percent of households in nonmetro areas lacked access to broadband (high-speed internet) in December 2022, compared with about 3 percent of households in metro areas, according to data from the Federal Communications Commission. Researchers with the USDA’s Economic Research Service (ERS) examined the racial and ethnic characteristics of the people in areas eligible for ReConnect grant and loan projects to understand how well the program has served different rural groups. Based on data from the first two rounds of ReConnect funding, initiated in fiscal years 2019 through 2021, researchers found that 3.4 percent of the overall American Indian/Alaska Native (AIAN) population in 2020 lived in areas eligible for ReConnect, which is targeted to rural areas with no broadband access. That marked a higher share of the population being eligible than for any other race or ethnicity, with the next closest being 0.7 percent of the White population. However, project applications came from organizations, such as internet service providers or telephone cooperatives, that served areas with lower shares of eligible AIAN people. For instance, even if every proposal in areas with an AIAN population had been funded, only 37 percent of the eligible AIAN population would have been reached, the second-lowest proportion across racial and ethnic groups. Approved projects served 10 percent of the eligible AIAN population, the lowest proportion of any racial or ethnic group. Overall, approved first and second round ReConnect projects are extending broadband service to 21 percent of the eligible population. This chart is drawn from the ERS report Three USDA Rural Broadband Programs: Areas and Populations Served, published in October 2023.
Monday, October 16, 2023
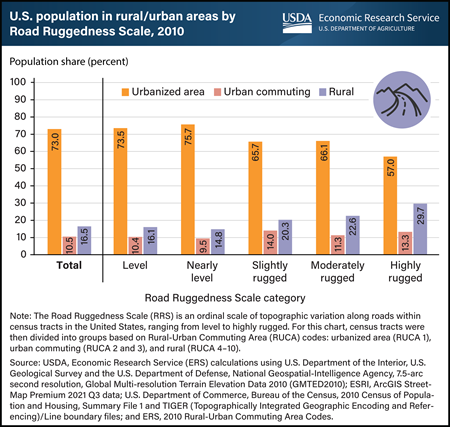
Researchers with USDA, Economic Research Service (ERS) developed the Road Ruggedness Scale—a five-category measure of topographic variability along roads—and used it to study the interplay of population, rurality, and ruggedness in the United States. They found that in 2010, as land became more rugged (had greater changes in elevation), generally more of the population lived in rural census tracts (the small geographic areas used to collect population data). For example, in level census tracts, the rural portion of residents was 16.1 percent, while the rural portion living in highly rugged census tracts was nearly double that amount (29.7 percent). The reverse was true for urbanized area census tracts, with the share of residents decreasing from 73.5 percent in level locations to 57.0 percent in highly rugged ones. However, even in the top ruggedness categories, most people lived in urbanized area census tracts, indicating that ruggedness and rurality are not synonymous. The relationship between ruggedness and rurality also varies by region. The rural population share in highly rugged census tracts of the Intermountain West (57.7 percent) and Appalachian Mountains (45.7 percent) was much higher than the national share of 29.7 percent, while the share in the Pacific Coast was much lower (18.6 percent). This chart appears in the ERS report Characterizing Rugged Terrain in the United States published on August 1, 2023.
Wednesday, August 2, 2023
USDA, Economic Research Service (ERS) has developed the Road Ruggedness Scale (RRS) to aid in understanding the unique role of rugged terrain as both a benefit and hindrance to the well-being of communities and their residents. The RRS has five categories based on changes in elevation along roads within census tracts (the small geographic areas used to collect population data). The census tracts are classified as: 1–level, 2–nearly level, 3–slightly rugged, 4–moderately rugged, or 5–highly rugged. Most census tracts have very little topographic variation, with 65.6 percent classified as level in the RRS. The next largest category is nearly level, with 22.4 percent of census tracts. The remaining 12.0 percent of census tracts are classified as slightly to highly rugged, and only 4.4 percent are classified as moderately or highly rugged. The RRS helps to identify landscape characteristics that may present an impediment to settlement and travel, such as the Appalachian and Rocky Mountains, the Pacific Mountain System, the Ozark and Ouachita Mountains, and the Black Hills. These geologic features can make it difficult for people living in rugged areas to access services. They can also attract tourists and prospective residents who prefer rugged terrain or are interested in outdoor activities. To our knowledge, the RRS is the first roads-only, detailed ruggedness measure with full nationwide coverage for the United States. It has the potential to contribute to research on links between the geography and well-being of individuals, especially those living in rural areas, as well as to other research and policy applications. This chart appears in the ERS report Characterizing Rugged Terrain in the United States, published in August 2023. The Road Ruggedness Scale data product published in September 2023.
Thursday, June 22, 2023
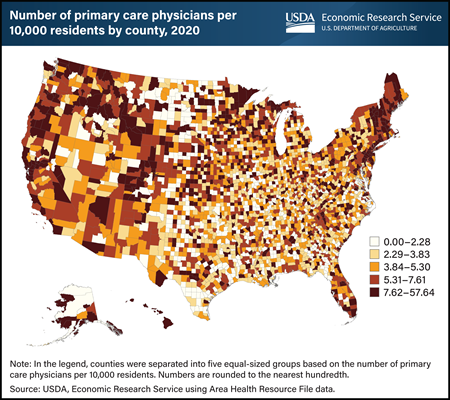
The number of primary care physicians per 10,000 residents is generally higher in much of the Northeast, along the West Coast, in Hawaii, and parts of the mountainous West and upper Midwest. The availability of primary care physicians per capita is generally lower in much of the Great Plains—especially the Southern Great Plains—and the Lower Mississippi Delta and Southeast. However, there are substantial variations in the availability of physicians within these regions. For instance, in rural counties, there are fewer physicians per capita in counties adjacent to urban counties than in those farther from urban areas. This is likely because residents travel from nearby rural areas to urban doctors. The lowest rates of physicians per capita are in rural counties with an urban population of less than 2,500. This chart updates data appearing in the USDA, Economic Research Service report Linkages Between Rural Community Capitals and Healthcare Provision: A Survey of Small Rural Towns in Three U.S. Regions published in March 2023.
Monday, June 12, 2023
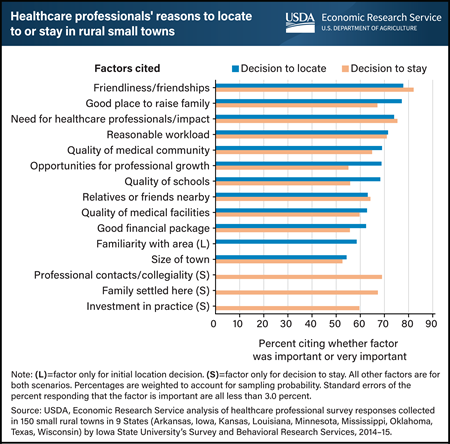
The availability of healthcare professionals in rural areas lags that of urban areas, partly because of difficulties in recruiting and retaining healthcare professionals. When choosing rural locations to practice, healthcare professionals (physicians, nurse practitioners, physician assistants, certified nurse midwives, and dentists) most often cite social aspects, such as the friendliness of the town, as an important factor in their decision, according to a survey administered by researchers at USDA, Economic Research Service (ERS) and Iowa State University. Similar factors come into play when these professionals choose to stay in their rural small towns. Other factors that reflect the importance of social relationships included being a good place to raise family, having relatives or friends living nearby, familiarity with the area (for the initial location decision), the quality of professional contacts and collegiality among local healthcare professionals (investigated only for the decision to stay), and if the professional’s family was settled in the town (also only investigated for the decision to stay). Other factors, such as the quality of the medical community, the quality of schools, and opportunities for professional growth also were cited as important. This chart appears in the ERS report Linkages Between Rural Community Capitals and Healthcare Provision: A Survey of Small Rural Towns in Three U.S. Regions, published in March 2023, as well as the Amber Waves article Healthcare Professionals Seek Social Connections When Moving to Rural Towns, published in May 2023
Monday, April 3, 2023
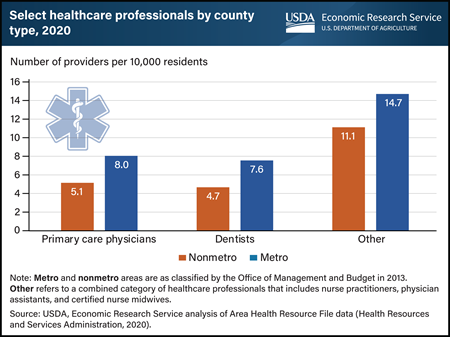
The availability of healthcare professionals in rural areas lags that of urban areas. As of 2020, rural (nonmetro) areas recorded 5.1 primary care physicians per 10,000 residents, while the number in urban (metro) areas was 8.0. Similarly, the number of dentists was 4.7 in rural areas compared with 7.6 in urban areas, while the number of nurse practitioners, physician assistants, and certified nurse midwives was 11.1 in rural areas compared with 14.7 in urban areas. Lower availability of primary healthcare services has been associated with a higher likelihood of poor health and lower life expectancy. Healthcare services are important not only for people’s health, but also for rural economies. Further, the healthcare services sector is one of the largest and most rapidly growing economic sectors across all parts of the United States. This chart appears in the Economic Research Service report, Linkages Between Rural Community Capitals and Healthcare Provision: A Survey of Small Rural Towns in Three U.S. Regions published in March 2023.
Monday, March 20, 2023
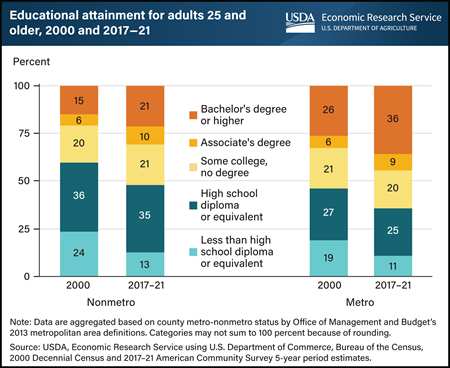
Formal educational attainment in rural America has grown over time, but rural (nonmetro) areas still lag urban (metro) areas. From 2000 to 2017–21 (the most recent estimate period from the American Community Survey), the share of adults ages 25 and older with a bachelor’s degree or higher increased in rural areas from 15 to 21 percent. In the same time span, the share of adults in urban areas with a bachelor’s degree or higher increased from 26 to 36 percent, widening the rural-urban gap from 11 to 15 percentage points in these two reference periods. This rural-urban gap in the share of people with at least a bachelor’s degree is even larger for younger age groups. In 2017–21, the share of working-age adults (ages 25–64) with at least a bachelor’s degree was 37 percent in urban areas and 21 percent in rural areas, while the share of younger adults ages 25–44 with at least a bachelor’s degree was 40 percent in urban areas and 22 percent in rural areas. One explanation for the persisting and widening gap may be the higher pay that more highly educated workers can often earn in urban labor markets. This chart appears in the USDA, Economic Research Service data product Charting the Essentials, published in January 2023.
-Unemployment_450px.png?v=4931.8)
Thursday, March 9, 2023
The Coronavirus (COVID-19) pandemic affected unemployment rates differently in rural and urban counties. In January 2020, just before the pandemic, the unemployment rates in both persistently poor and not persistently poor rural counties were higher than in the respective urban counties. In addition, the unemployment rates in persistently poor rural counties were higher than in rural counties that were not persistently poor (5.9 percent versus 4.6 percent). This pattern changed with the pandemic-driven economic downturn. By April 2020, the unemployment rate among persistently poor rural counties had more than doubled to a peak of 12.3 percent. However, in other rural counties the unemployment rate had nearly tripled, surpassing the unemployment rate in persistently poor rural counties with a peak of 13.4 percent. Similarly, in urban counties the unemployment rate nearly tripled (from 4.9 percent to 14.4 percent) for persistently poor counties and more than tripled for other urban counties (from 3.8 percent to 14.2 percent), surpassing the unemployment rates in rural counties. These unemployment rate changes suggest that the employment shock at the start of the pandemic was not as prominent in persistently poor counties as in counties that were not persistently poor, and that it had a larger effect on urban counties than rural counties. The varying effects of the pandemic might in part be traced to whether local industries stayed open (essential industries, such as meatpacking), or saw reduced demand, such as retail and hospitality. Unemployment rates in rural counties returned to pre-pandemic levels by November 2021, but persistently poor urban counties did not recover until December 2022 and continue to have the highest unemployment rates. This chart updates data in the USDA, Economic Research Service report Rural America at a Glance: 2021 Edition, published in November 2021.
Wednesday, February 1, 2023
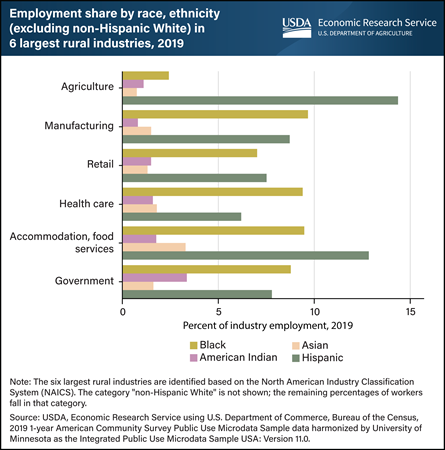
Among racial and ethnic groups (not including non-Hispanic White) in rural areas, Hispanic workers often lead employment in the six largest rural industries. In 2019, Hispanic workers performed 14.4 percent of rural jobs in agriculture and 12.8 percent in accommodation and food services. In rural manufacturing jobs, 8.7 percent of workers were Hispanic; in government, 7.8 percent; in retail, 7.5 percent; and in health care and social assistance, 6.2 percent. Rural Black workers were more evenly distributed with 9.7 percent of the workforce in manufacturing, 9.4 percent in health care and social assistance, 9.5 percent in hotels and restaurants, and 8.8 percent in government. Black workers were less represented in retail (7.0 percent) and in agriculture (2.4 percent). Asian workers constituted less than 2 percent of the rural workforce in most industries, except for accommodation and food services (3.3 percent). Similarly, American Indian or Alaska Native workers represented less than 2 percent of rural employment in most industries except government (3.4 percent). This chart appears in the USDA, Economic Research Service report Rural America at a Glance: 2022 edition.
Tuesday, January 17, 2023
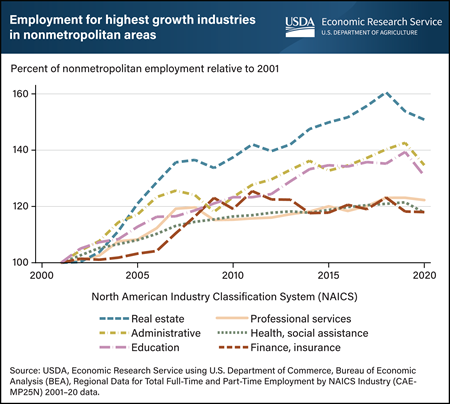
Over the last two decades, the strongest rural job gains were in smaller industries that tend to employ high-skill workers. The highest growth was in the real estate industry, which includes lessors of nonresidential buildings, real estate agents, brokers and property managers, and industrial machinery and equipment rental and leasing, as identified by the U.S. Census Bureau’s North American Industry Classification System (NAICS). Also showing rapid growth was the administrative services industry, which includes office administration, facilities support, business support services, security services, conventions and trade shows, and waste management and treatment. Other rural industries that grew over the past two decades were health care and social assistance; professional, scientific, and technical services; educational services; and finance and insurance. The growth of these industries represented a shift in rural production toward industries that employ higher shares of high-skill workers. Consistent with this shift, the percent of rural college-educated workers increased from 21.5 percent in 2012 to 23.8 percent in 2019, although these rates have remained lower than the share of college-educated urban workers (38 percent in 2019). The six largest rural industries in terms of employment during this period were health care and social assistance; accommodation and food services; government; retail; agriculture; and manufacturing. Only the health and social assistance industry was at the same time one of the fastest-growing rural industries and one of the six largest rural industries in terms of employment. This chart appears in the USDA, Economic Research Service report Rural America at a Glance: 2022 Edition, published in November 2022.


