ERS Charts of Note
Subscribe to get highlights from our current and past research, Monday through Friday, or see our privacy policy.
Get the latest charts via email, or on our mobile app for  and
and 
Tuesday, April 16, 2024
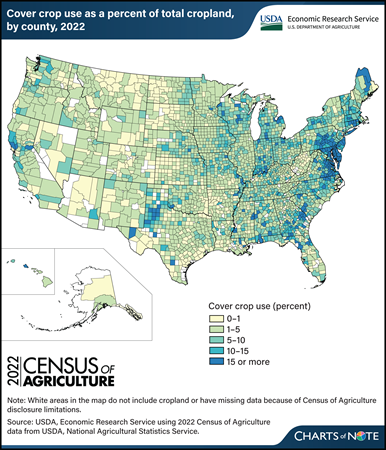
U.S. cropland area planted to cover crops increased 17 percent between 2017 and 2022, from 15,390,674 acres to 17,985,831 acres, data from the recently released Census of Agriculture show. That means cover crops were planted on 4.7 percent of total cropland in 2022. Producers often use cover crops to provide living, seasonal soil cover between the planting of two cash (commodity) or forage crops. Including cover crops in a rotation can provide benefits such as improved soil health and water quality, weed suppression, and reduced soil erosion. Regional differences in the use of cover crops are related to factors such as climate, soils, cropping systems, and State incentive programs. For example, Maryland, which has the highest rate of cover crop use, has programs that encourage farmers to grow cover crops to help improve water quality in the Chesapeake Bay. Cover cropping is more common in the southern and eastern parts of the U.S. because of soil and climate conditions, among other factors. It is more difficult to establish and grow cover crops in regions that are colder, receive less precipitation, and have a shorter growing season, so the western and northern parts of the United States have lower rates of cover crop use. One of the States with the greatest increase in cover crop acres as a proportion of total cropland from 2017 to 2022 was Texas, which also had the largest absolute increase in cover crop acreage. Cover crop acreage in Texas increased more than 50 percent (from 1,014,145 acres in 2017 to 1,550,789 acres in 2022). Cover crop use decreased in 2022 in some eastern States (Maryland, Georgia, North Carolina, New Jersey, Tennessee, and Kentucky). For more information about factors affecting U.S. cover crop adoption, see the USDA, Economic Research Service (ERS) report Cover Crop Trends, Programs, and Practices in the United States, published in February 2021. See also these ERS Charts of Note: Cover crop mixes account for 18 to 25 percent of major commodity acreage with cover crops, published in December 2022, and More farmers are adding fall cover crops to their corn-for-grain, cotton, and soybean fields, published in May 2022. For more Census of Agriculture data, see the USDA, National Agricultural Statistics Service’s 2022 Census of Agriculture.
Monday, April 15, 2024
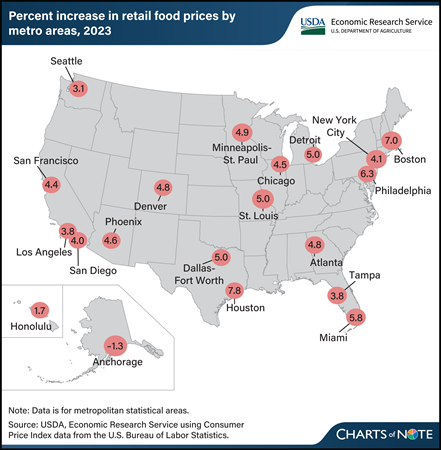
Retail food price inflation varies by locality. In 2023, food-at-home (grocery) prices rose the fastest in Houston, TX, by 7.8 percent, followed by Boston, MA, at 7.0 percent. In contrast, food-at-home prices declined by 1.3 percent in 2023 in Anchorage, AK, and rose by the lowest amount (1.7 percent) in Honolulu, HI. Across the United States, food-at-home prices increased by 5.0 percent on average in 2023. Differences in retail overhead expenses, such as labor and rent, can explain some of the variation among cities, because retailers often pass local cost increases to consumers in the form of higher prices. Furthermore, differences in consumer purchasing patterns for specific foods may help explain variation in inflation rates among cities. Products that consumers purchase vary regionally, and each metro area’s inflation rate is calculated based on a representative set of foods unique to the area. For example, an area whose residents purchase more foods with slower price inflation (such as fresh fruits and vegetables at 0.7 and 0.9 percent average growth in 2023, respectively) might experience lower food-at-home price inflation than an area whose residents buy more cereals and bakery products or nonalcoholic beverages, which increased by 8.4 percent and 7.0 percent, respectively, in 2023. This chart is drawn from the USDA, Economic Research Service Food Price Environment: Interactive Visualization, last updated in February 2024, which presents the 10-year average change in prices by metro area and provides context for the Food Price Outlook data product.
Thursday, April 11, 2024
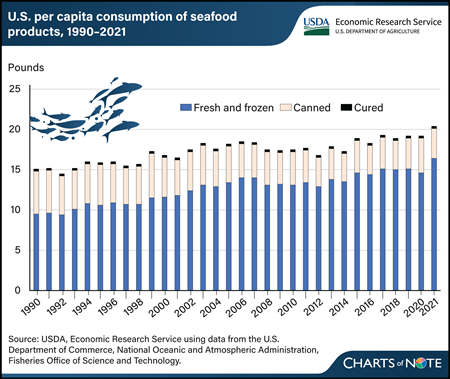
U.S. residents consumed an average of 20.5 pounds of seafood— finfish and shellfish—per capita in 2021. The U.S. Department of Commerce, National Oceanic Atmospheric Administration (NOAA) Fisheries Office of Science and Technology publishes annual consumption estimates for seafood produced through aquaculture and captive fisheries, domestically as well as those imported from other countries. Over the last three decades, demand for farm-raised and wild-caught seafood has expanded as consumers’ tastes and preference for finfish and shellfish have increased. Per capita seafood consumption grew 30 percent in this period, led by fresh and frozen seafood. Growth in fresh and frozen seafood consumption per capita climbed from about 63 percent in 1990 to almost 80 percent in 2021. In contrast, per capita consumption of canned seafood has declined from a 35-percent share in 1990 to an 18-percent share of the total seafood consumed nationwide in 2021. Cured seafood consumption remained constant throughout the period of observation. According to NOAA, about 80 percent of all seafood consumed in the United States is estimated to come from imported products. This chart is drawn from the USDA, Economic Research Service Aquaculture topic page.
Wednesday, April 10, 2024
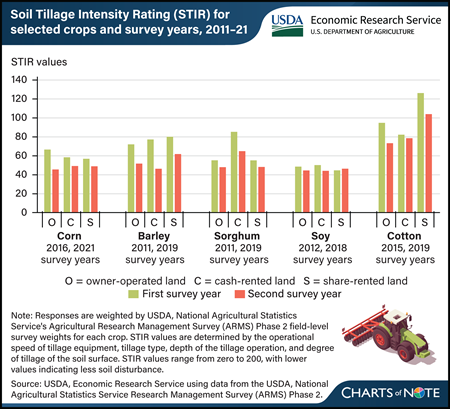
USDA, Economic Research Service (ERS) researchers investigated whether tillage practices were different between farmers who were renters or farmers who owned the land. Farming systems that decrease soil disturbance and preserve more crop residue than conventional tillage may improve the soil, but these practices have upfront costs (in new machinery, for instance), and any soil health benefits captured by the operator may be delayed into the future, perhaps until after a new renter has taken over the land. For this reason, renters may be less inclined to adopt tillage practices that decrease soil disturbance. Researchers examined tillage practices as measured by the Soil Tillage Intensity Rating (STIR) values for five major crops (corn, soybeans, cotton, barley, and sorghum). STIR values are determined by the operational speed of tillage equipment, tillage type, depth of the tillage operation, and degree of disturbance of the soil surface. STIR values range from zero to 200, with lower values indicating less soil disturbance. Over the two survey years specific for each, both crop owner-operators and renters generally showed reductions in STIR values. For instance, on sorghum acres, the estimated average STIR value of owner-operators was 55 in 2011 and 48 in 2019. Both cash and share renters also reported engaging in practices that led STIR values to fall, with values by cash renters falling the most. Researchers found that all three groups exhibited similar rates of tillage intensity, indicating that they are responding to economic incentives presented by reduced tillage systems similarly. This can be attributed to the fact that although soil health benefits may only be seen in the medium-to-long term, reducing soil disturbance can result in time and energy savings immediately. This chart can be found in the ERS report Farmland Rental and Conservation Practice Adoption, published in March 2024.
Tuesday, April 9, 2024
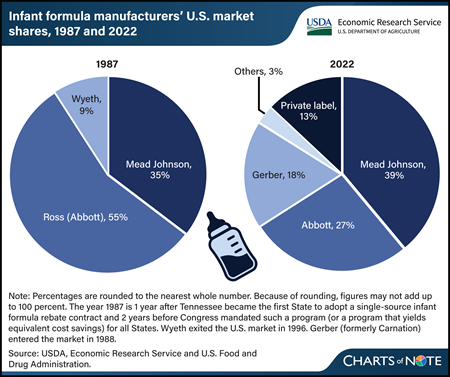
State agencies that administer USDA’s Special Supplemental Nutrition Program for Women, Infants, and Children (WIC) use competitive, single-source contracts to reduce the cost of infant formula. These contracts provide significant discounts in the form of manufacturer rebates for each can of formula purchased through WIC. Infants who receive formula through WIC consume more than half of all infant formula in the United States. The manufacturer holding the WIC contract in a State sells the most infant formula in that State, including to consumers not participating in WIC. The infant formula market is highly concentrated. However, comparing market shares over time indicates that the market has become less concentrated. In 1987, the year of the first rebate contract and 2 years before Federal law required that WIC State agencies use cost containment systems, three manufacturers accounted for 99 percent of sales of infant formula in the United States. In 2022, three manufacturers accounted for 83 percent of sales of infant formula. In addition to WIC contracts with manufacturers, other factors influence infant formula market concentration, such as regulation of formula manufactured inside the United States and import restrictions on formula manufactured outside the United States. Entrances and exits of manufacturers and changes in their market shares over time suggest these factors impact firms differently. This chart appears in the USDA, Economic Research Service report The Special Supplemental Nutrition Program for Women, Infants, and Children (WIC): Background, Trends, and Economic Issues, 2024 Edition, published in February 2024.
Monday, April 8, 2024
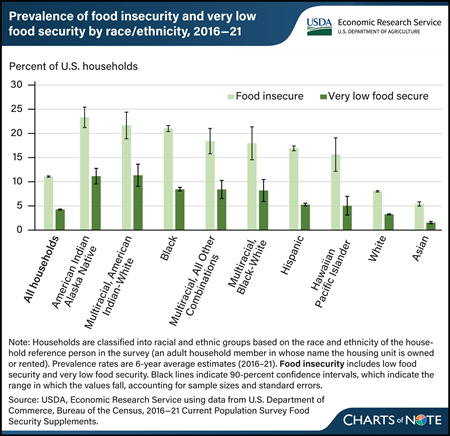
From 2016 to 2021, 11.1 percent of U.S. households experienced food insecurity, meaning they had difficulty providing enough food for all their members because of a lack of resources. Over the same period, 4.3 percent of U.S. households experienced very low food security, a more severe form of food insecurity in which food intake is reduced and eating patterns are disrupted. The prevalence of food insecurity during 2016–21 varied by race and ethnicity. Households headed by a reference person who identified as American Indian and Alaska Native (23.3 percent); Multiracial, American Indian-White (21.7 percent); Black (21.0 percent); Multiracial, All Other Combinations (18.4 percent); Multiracial, Black-White (18.0 percent); Hispanic (16.9 percent); and Hawaiian and Pacific Islander (15.6 percent) had significantly higher rates of food insecurity than the all-household average. The prevalence of food insecurity for households headed by a White (8.0 percent) or an Asian (5.4 percent) reference person was significantly lower than the all-household average. The prevalence of very low food security followed a similar pattern and was statistically significantly different from the all-household prevalence for most race and ethnicity categories. It was not significantly different for Hawaiian and Pacific Islander households. Very low food security ranged from 1.6 percent for Asian households to 11.3 percent for Multiracial, American Indian-White households. Meaningful differences in food insecurity exist across and within racial ethnic groups. Related data are available in the USDA, Economic Research Service report Household Food Insecurity Across Race and Ethnicity in the United States, 2016–21, published in April 2024.
Thursday, April 4, 2024
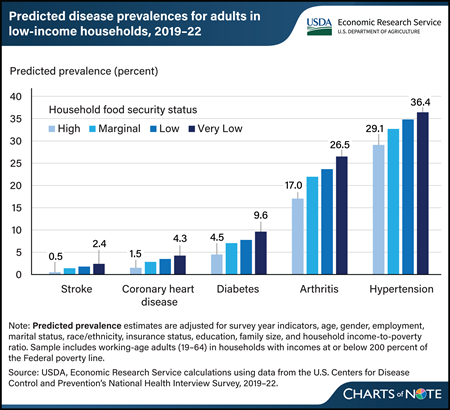
From 2019–22, the predicted prevalence of five selected chronic diseases was 1.9 to 9.5 percentage points higher for adults in very low food-secure households than those in high food-secure households. Researchers at USDA, Economic Research Service (ERS) recently updated estimates of the relationship between food security status and chronic disease among working-age adults in U.S. households with incomes at or below 200 percent of the Federal poverty level. They looked at the prevalence of stroke, coronary heart disease, diabetes, arthritis, and hypertension across four levels of household food security, ranging from high food security (households that reported no problems with or anxiety about being able to consistently obtain adequate amounts of food) to very low food security (in which eating patterns of one or more household members were disrupted and food intake was reduced). Adults in households that were less food secure were more likely to have one or more chronic disease, and the likelihood increased as food insecurity worsened. The prior data from 2011–15 and the more recent data from 2019–22 demonstrate a close link between food security status and health. This chart updates information in the ERS report Food Insecurity, Chronic Disease, and Health Among Working Age Adults, published in July 2017.
Wednesday, April 3, 2024
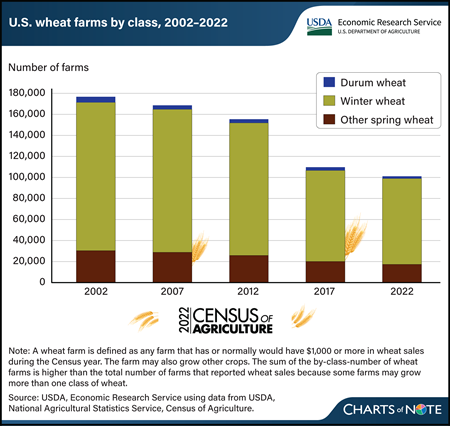
The number of farms producing wheat for grain declined substantially from 2002 to 2022, according to new data from USDA, National Agricultural Statistics Service (NASS) 2022 Census of Agriculture. In 2022, the number of U.S. farms reporting wheat production was 97,014, a 43-percent decrease compared with the 2002 census, when 169,528 farms reported wheat production. The reduction in the number of farms producing wheat was spread across all classes of wheat. The number of farms producing winter wheat—84 percent of U.S. wheat farms in 2022—dropped by nearly 60,000, or 42 percent, between the 2002 and 2022 censuses. Farms producing durum wheat decreased by the largest percentage, down 59 percent from 2002. The number of farms growing spring wheat (other than durum) declined 43 percent from 2002 to 2022. During the same time period, total volume of U.S. wheat produced trended down slightly, largely because of less acreage being harvested. As the profitability of other crops rises, wheat is increasingly planted in rotation with more profitable corn or soybean crops. Among major wheat-producing States, Kansas, which accounts for 15 percent of all U.S. wheat farms, saw a reduction of 9,716 farms—a 40-percent decrease from 2002 to 2022. Texas and Oklahoma reported decreases of 54 and 47 percent, respectively, between 2002 and 2022. Together, these 3 States harvested nearly 32 of percent of the volume of winter wheat produced in 2022, according to data reported by NASS in the Small Grains Annual report. For more details on the 2022 Census of Agriculture, see the NASS Census of Agriculture website. Information on trends in the wheat production sector can be found in the special article, “U.S. Census of Agriculture: Highlighting Changing Trends in Wheat Farming” in USDA, Economic Research Service’s March 2024 Wheat Outlook.
Tuesday, April 2, 2024
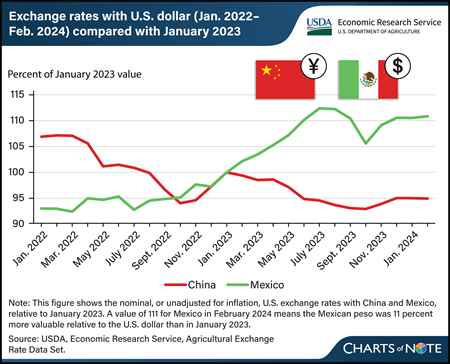
China and Mexico are the top two markets for U.S. agricultural exports by dollar value. Exchange rates are one of several factors that can influence U.S. agricultural trade. All else being equal, a stronger foreign currency favors U.S. exports to that country, and vice versa. For the past 2 years, China’s yuan has depreciated (has become less valuable) relative to the U.S. dollar, implying a weaker value of U.S. exports to China. The opposite has been true for the Mexican peso. The U.S. dollar appreciated in value relative to the currencies of many countries, including China, because of U.S. Federal Reserve interest rate increases during this period. The Mexican peso was an exception to this, as the Bank of Mexico increased interest rates more aggressively and earlier than the Federal Reserve did for U.S. interest rates. In addition, the Mexican government’s comparatively smaller stimulus response to the Coronavirus (COVID-19) pandemic in 2020 and 2021 and optimism regarding nearshoring—in which U.S. companies relocate operations to neighboring Mexico from China—has helped strengthen the peso, according to the Federal Reserve Bank of Dallas. From the perspective of U.S. farmers and agribusinesses, the decrease in the value of the yuan and increase in the value of the peso is generally associated with a decrease in export opportunities to China and an increase in export opportunities to Mexico. Not adjusting for inflation, U.S. agricultural exports to China decreased in value to $33.7 billion in fiscal year (FY) 2023 from $36.2 billion the previous year and are forecast to fall further to $28.7 billion in FY 2024. U.S. agricultural exports to Mexico increased in value from $28.0 billion to $28.2 billion from FY 2022 to 2023 and are forecast at a record high of $28.4 billion for FY 2024. This chart is drawn from USDA, Economic Research Service’s Agricultural Exchange Rate Data Set, February 2024.
Monday, April 1, 2024
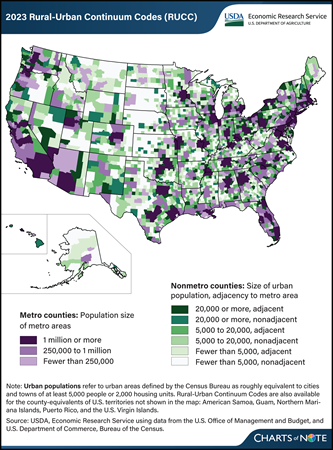
The USDA, Economic Research Service (ERS) has updated its Rural-Urban Continuum Codes (RUCC), which classify all U.S. counties into nine categories from most urban to most rural. The RUCC distinguish U.S. metropolitan (metro) counties by the population size of their metro area and nonmetropolitan (nonmetro) counties by their degree of urbanization and adjacency to a metro area. The RUCC allow researchers and policymakers to add nuance to their county-level analyses by incorporating the population of the Census Bureau’s urban areas with the OMB’s definition of metropolitan counties. The most urban counties belong to metro areas (shown in purple on the map). These are divided into three categories based on the total population of the metro area. Counties that are commonly considered rural are those that do not belong to metro areas (shown in green on the map). The RUCC classify these nonmetro counties into six categories based on the number of people who live in urban areas (small cities or towns) and whether the county is adjacent to a metro area. The most urban of the nonmetro counties are those that had urban area populations of at least 20,000 and are most prevalent in regions such as the Northeast, Great Lakes, and along the coasts. The most rural of the nonmetro counties had urban area populations of fewer than 5,000 and are the most prevalent in the Great Plains and Corn Belt. Counties classified as adjacent to metro areas are considered more urban than their nonadjacent counterparts because their residents have greater access to the diverse employment opportunities, goods, and services available in metro areas. For more information on the RUCC, please see the ERS data product Rural-Urban Continuum Codes.
Thursday, March 28, 2024
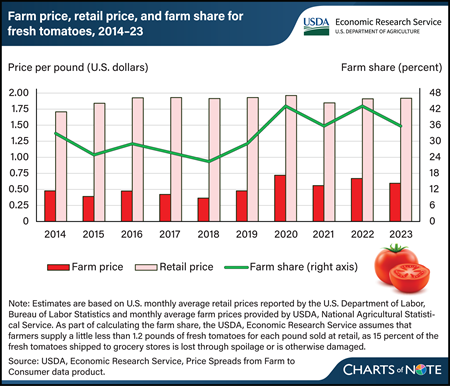
For the fourth straight year, the U.S. farm share of retail prices for fresh, field-grown tomatoes remained above 35 percent in 2023. The farm share is the ratio of what farmers receive to what consumers pay per pound in grocery stores. Retail prices have been mostly stable near $1.92 per pound since 2016. This stability has occurred despite generally higher farm prices since 2020. Farm prices, the amount growers received per pound of fresh tomatoes, fell 7 cents in 2023 from 2022, based on a simple average of monthly prices. USDA, Economic Research Service (ERS) estimates farm-to-retail price spreads for field-grown, fresh-market tomatoes using a simple average of monthly retail prices reported by the U.S. Department of Labor, Bureau of Labor Statistics and monthly farm-level prices reported by the USDA, National Agricultural Statistical Service (NASS). This approach gives equal weight to all months of the year. Same-month farm prices were lower during much of 2023 compared with 2022. However, production is seasonal. In 2023, farm prices were higher during peak domestic production periods than they were during the same periods in 2022. NASS season average price data show farm prices were up about 3.5 cents per pound on an annual basis that gives more weight to months with greater domestic production. The farm share of retail prices would have been even higher in 2023 if viewed on this basis. More information on ERS farm share data can be found in the Price Spreads from Farm to Consumer data product, updated February 27, 2024.
Wednesday, March 27, 2024
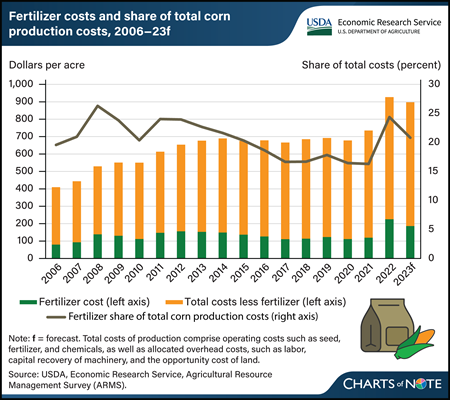
Fertilizer is one of several inputs corn growers buy in the months before April and May, when most U.S. corn acres are planted. Historically, fertilizer is typically the largest variable expense associated with corn production. Every May, USDA’s Economic Research Service (ERS) reports production costs, including fertilizer, for corn and other major commodities in the Commodity Costs and Returns data product. Although fertilizer costs have varied over time, the average cost of fertilizer per acre from 2006 to 2021 was around $125, not adjusting for inflation. Costs jumped to an average of $225.78 per acre in 2022, and then fell to an estimated $186.73 in 2023. This represents an 89-percent increase from 2021 to 2022 followed by a decrease of 17 percent from 2022 to 2023. In addition to fertilizer expenses, other costs of production reported in the data include operating costs, such as seed, fuel, and chemicals, as well as allocated overhead costs, such as labor, capital recovery of machinery, and the opportunity cost of land—a category that reflects rent or income that might have been earned from renting out the land when the land is owned. Fertilizer costs accounted for about 22 percent of total corn production costs per acre from 2006 to 2016, then fell to historical lows averaging around 17 percent from 2017 to 2021. In 2022, price spikes resulted in fertilizer costs jumping to about 24 percent of total costs. While elevated, fertilizer expenses as a share of total costs remained lower in 2022 compared with 2008, when they were 26 percent of total costs. From 2022 to 2023, total corn production costs remained elevated compared with 2021 and before, even as fertilizer costs declined. Iowa prices published by USDA’s Agricultural Marketing Service for the most commonly used fertilizers anhydrous ammonia, urea, and liquid nitrogen (32 percent) show decreases from 2023 to 2024, with slight upticks in the second reporting period of February. Cost of production data for 2023 is set to be released on May 1, 2024. This chart is drawn from the ERS Commodity Costs and Returns data product.
Tuesday, March 26, 2024
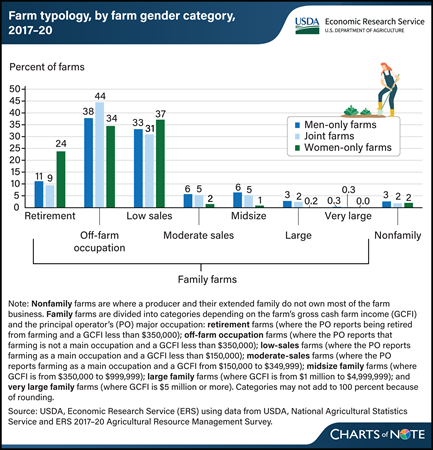
Most farms operated only by women are retirement, off-farm occupation, or low-sales farms, according to findings by researchers with USDA, Economic Research Service (ERS). After examining 2017–20 data from the Agricultural Resource Management Survey (ARMS), researchers found that a greater share of farms operated only by women were retirement farms compared with the shares operated only by men or by men and women jointly, 24 versus 11 and 9 percent, respectively. Retirement farms generate annual gross cash farm income (GCFI) of less than $350,000 with principal operators who report they are retired from farming. Three percent of men-only operations were large family farms (with GCFI of $1 million to $4,999,999), compared to 2 and 0.2 percent of farms operated jointly by men and women, or only women respectively. The ARMS data also show that 7 percent of all farms were operated entirely by women from 2017 to 2020, and 44 percent of all farms were operated jointly by men and women, so 51 percent of all farms had at least one woman operator. For more information, see the ERS report An Overview of Farms Operated by Socially Disadvantaged, Women, and Limited Resource Farmers and Ranchers in the United States, published February 2024.
Monday, March 25, 2024
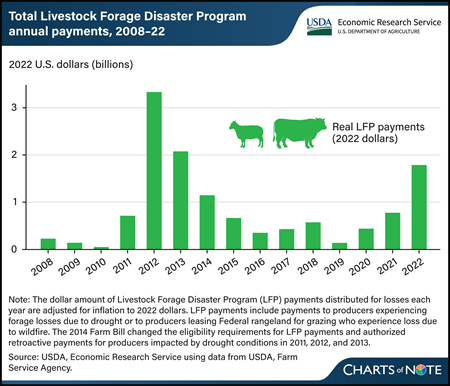
The USDA, Farm Service Agency administers the Livestock Forage Disaster Program (LFP), which provides payments to livestock producers affected by drought. From 2008 to 2022, the program distributed more than $12 billion (in 2022 dollars) in total to livestock producers throughout the United States. Annual LFP payments peaked in 2012 at more than $3 billion (in 2022 dollars) when severe, widespread drought conditions were prevalent throughout much of the central United States, where much of the Nation’s livestock production is concentrated. In general, years with widespread drought (such as in 2012, 2013, and 2022) are associated with larger total annual LFP payments. LFP eligibility is based on drought severity as reported by the U.S. Drought Monitor. If drought conditions become more severe and common in the future because of climate change, LFP payments may increase, with potential impact on the Federal Government’s budget. For more about the LFP and the potential impact of LFP payments on the Federal budget, see the USDA, Economic Research Service report The Stocking Impact and Financial-Climate Risk of the Livestock Forage Disaster Program, published in January 2024.
Thursday, March 21, 2024
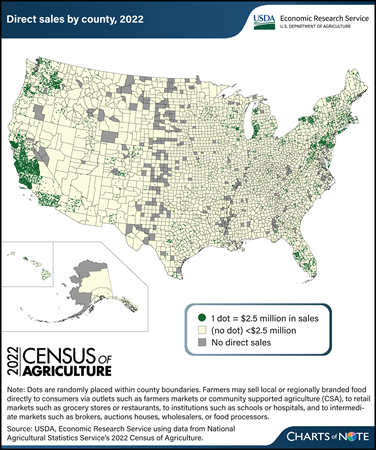
Errata: On March 25, 2024, the map legend was revised to show that areas in yellow without dots represent direct sales of less than $2.5 million.
The Census of Agriculture reports data on local or regionally branded food sold directly to retail outlets, institutions (like schools), intermediate markets (like food hubs), and consumers (via outlets such as farmers markets). These local-food sales channels provide opportunities for farmers to explore revenue streams beyond traditional wholesale markets. Data from the 2022 Census of Agriculture, released in February 2024, show producers sold $17.5 billion in food, including both unprocessed and processed (value-added) food, through direct marketing channels. That was a 25-percent increase (after adjusting for inflation) since the 2017 Census of Agriculture and an annual real growth rate of 4.6 percent. The increase from 2017 was driven by a surge in food sold directly to retail outlets, institutions, and intermediate markets. From 2017 to 2022, sales through these three direct-sales channels increased 33.2 percent (adjusted for inflation) to $14.2 billion, and the number of operations selling through them more than doubled to 60,332. Direct-to-consumer sales through farmers markets, on-farm stores or stands, u-pick operations, community supported agriculture (CSA), and online marketplaces remained consistent with those in 2017 after adjusting for inflation. However, the number of farm operations (116,617) selling directly to consumers in 2022 was 10.3 percent less than in 2017. As was the case in 2017, direct food sales continue to be concentrated along the West Coast, particularly in California (37.7 percent of direct sales), and in the Northeast. Most counties with high volumes of direct sales are in or around metropolitan areas, whose populations provide a large customer base for producers. This chart is based on data obtained from USDA, National Agricultural Statistics Service’s 2022 Census of Agriculture. For more on direct food sales, see the USDA, Economic Research Service report Marketing Practices and Financial Performance of Local Food Producers: A Comparison of Beginning and Experienced Farmers, published in 2021.
Wednesday, March 20, 2024
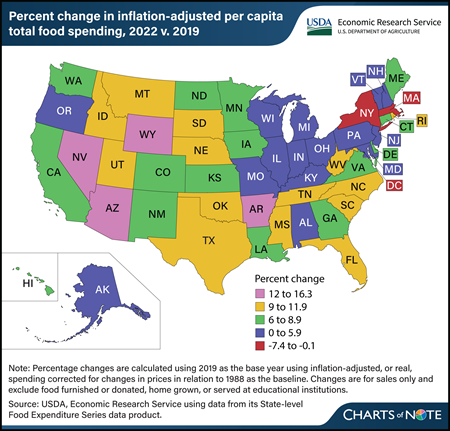
The U.S. food system experienced many changes since 2019, particularly during the Coronavirus (COVID-19) pandemic. Per capita total U.S. food spending increased 6.3 percent in 2022 compared with 2019 when adjusted for inflation. Inflation-adjusted food-at-home spending approached 2019 levels in 2022, while food-away-from-home spending remained high compared with prepandemic levels. However, this trend was not consistent across States. Washington, DC, had the largest decrease in total food spending between 2019 and 2022 (7.4 percent), mainly driven by a 12.9-percent decline in food-away-from-home spending. States with decreases or relatively small increases in total food spending were largely concentrated in the Northeast. Massachusetts and New York each saw decreases of 0.7 percent in inflation-adjusted, per capita total food spending between 2019 and 2022, while food spending in Vermont grew 1.6 percent. Many States with the largest increases in inflation-adjusted, per-capita food spending were concentrated in the West, with Nevada (16.3 percent), Wyoming (15.5 percent), and Arizona (13.9 percent) seeing the largest increases over the period. This chart is drawn from USDA, Economic Research Service’s State-level Food Expenditure Series, updated February 2024. For more on food spending, see the Amber Waves article U.S. Consumers Spent More on Food in 2022 Than Ever Before Even After Adjusting for Inflation, published September 2023.
Tuesday, March 19, 2024
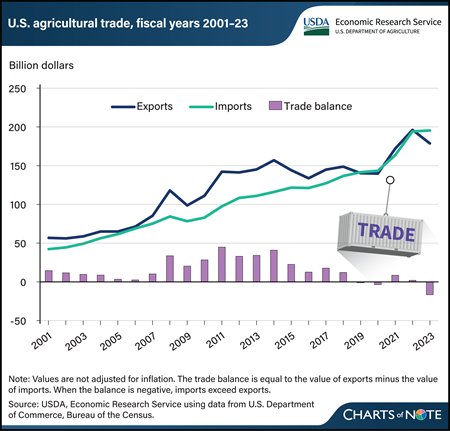
The U.S. agricultural trade balance measures the difference between the values of exported farm goods and those imports from other countries. For nearly 60 years, U.S. agricultural trade maintained a surplus, but in fiscal year (FY) 2019, the balance shifted to a deficit, where it has stayed 3 out of the last 5 fiscal years. In FY 2023, U.S. agricultural imports exceeded exports by $16.6 billion. Imports have largely followed a stable upward trend, while exports have had relatively wide swings. From FY 2013 to 2023, import values increased at a compound annual growth rate of 5.8 percent, and exports grew at a rate of 2.1 percent. Although the U.S. agricultural trade balance is closely watched, it reflects changing consumer tastes, a robust economy, and a strong dollar, and is not an indicator of export competitiveness or import dependence. The U.S. consumer’s growing appetite for high-valued imported goods—such as fruits and vegetables, alcoholic beverages, and processed grain products—has contributed to the expanding trade deficit. Those goods often include products that can’t be easily sourced in the United States, such as tropical products or off-season produce. In contrast, nearly 40 percent of U.S. exports are bulk commodities, whose prices respond more rapidly to global markets. This chart also appears in the USDA, Economic Research Service report Selected Charts from Ag and Food Statistics: Charting the Essentials, 2024.
Monday, March 18, 2024
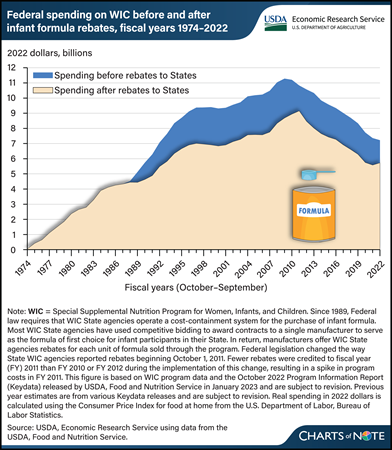
The Special Supplemental Nutrition Program for Women, Infants, and Children (WIC) serves to safeguard the health of low-income pregnant and postpartum women, infants, and children younger than 5 years who are at nutritional risk. State agencies responsible for implementing WIC use cost-containment strategies to reduce program costs. The greatest savings come from strategies used to contain the costs of providing infant formula through the program. Since 1989, most WIC State agencies have used competitive bidding to award contracts to a single manufacturer to serve as the formula of first choice for infant participants in their State. In return, manufacturers offer WIC State agencies rebates for each unit of formula sold through the program. From 1989 to 2022, savings to WIC from the rebates totaled $71.9 billion (in inflation-adjusted 2022 dollars), or 23 percent. Without the rebates, the Federal Government would have spent about $307.5 billion on the WIC program over that period. With the rebates, the Government spent $235.6 billion. This chart is drawn from the USDA, Economic Research Service report The Special Supplemental Nutrition Program for Women, Infants, and Children (WIC): Background, Trends, and Economic Issues, 2024 Edition, published in February 2024.
Thursday, March 14, 2024
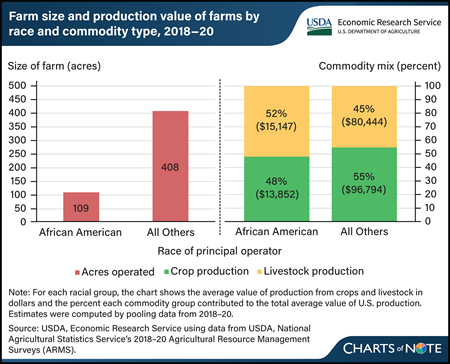
Researchers at USDA’s Economic Research Service (ERS) evaluated characteristics of farms operated by African Americans using data from the 2018–20 Agricultural Resource Management Surveys (ARMS). The researchers observed that farm size and commodities produced differed across race. During 2018–20, the average African-American-operated farm was less than one-third the size of other farms. African-American farms operated an average of 109 acres compared with an average of 408 acres for all other farms. The choice of commodities produced also varied by race. About 83 percent of African-American farms were livestock farms, with livestock production making up more than half of their production value. In contrast, about 66 percent of other farms were livestock farms. The differences in farm size and commodities produced were found to contribute to differences in farm production values. On average, total value of production was about $29,000 for African-American farms, while that of farms with principal operators of other races was about $177,000. Together, these factors contributed to the average African-American farm earning lower net farm income than other farms. This article is drawn from the ERS Amber Waves article Farm Size, Specialization Are Among Factors Influencing Financial Performance of African-American Farms in United States, published in February 2024.
Wednesday, March 13, 2024
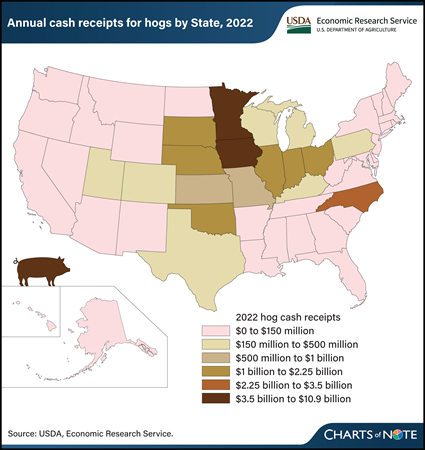
Iowa is the top producer of hogs in the United States, with about $10.9 billion in cash receipts in 2022. Cash receipts represent the value of sales of hogs by farmers to processors or final users. Following Iowa are Minnesota, North Carolina, and Illinois, with cash receipts of $3.6 billion, $3.1 billion, and $2.1 billion, respectively. Iowa accounted for about 35.5 percent of the $30.6 billion in total U.S. cash receipts for hogs in 2022. The top 10 hog-producing States cumulatively accounted for 87.6 percent of hog receipts. The latest Hogs and Pigs report from USDA, National Agricultural Statistics Service indicated there were nearly 75 million hogs in the United States as of December 1, 2023. USDA, Economic Research Service (ERS) estimates farm sector cash receipts—the cash income received from agricultural commodity sales—three times each year. These data include estimates broken down by State and commodity and offer background information on the Nation’s agriculture. The information in this chart is available in the ERS Farm Income and Wealth Statistics data product, updated in February 2024.


