Editor's Pick 2017: Best of Charts of Note
This chart gallery is a collection of the best Charts of Note from 2017. These charts were selected by ERS editors as those worthy of a second read because they provide context for the year’s headlines or share key insights from ERS research.

Thursday, April 6, 2017
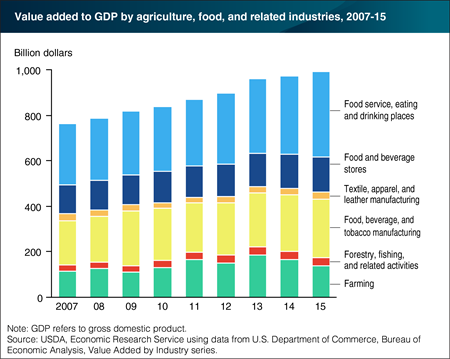
Agriculture and agriculture-related industries contributed $992 billion to the U.S. gross domestic product (GDP) in 2015, a 5.5-percent share. The output of America’s farms contributed $136.7 billion of this sum—about 1 percent of GDP. The overall contribution of the agriculture sector to GDP is larger than this because related sectors rely on agricultural inputs like food and materials used in textile production in order to contribute added value to the economy. In 2015, farming’s contribution to GDP fell for the second consecutive year after reaching a high point of $189.9 billion in 2013. A major reason for this downward trend has been falling commodity prices like corn and soy, which peaked around 2013 and have since fallen by at least 30 percent. The category of food service, eating and drinking places has expanded over a similar timeframe and may be a beneficiary of the lower commodity prices at the farm level. This chart was updated in March 2017 and appears in the ERS data product, Ag and Food Statistics: Charting the Essentials.

