Editor's Pick 2016: Best of Charts of Note
This chart gallery is a collection of the best Charts of Note from 2016. These charts were selected by ERS editors as those worthy of a second read because they provide context for the year’s headlines or share key insights from ERS research.

Friday, December 23, 2016
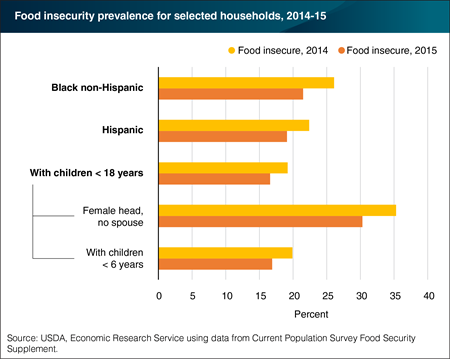
The prevalence of food insecurity in the United States declined from 14.0 percent of households in 2014 to 12.7 percent of households in 2015. Some types of households saw greater declines than others. Food insecurity for both Non-Hispanic Blacks and Hispanics dropped from 2014 to 2015: the former declined from 26.1 to 21.5 percent, while the latter from 22.4 to 19.1 percent. Households with children younger than 18 saw a significant decline in food insecurity—from 19.2 percent in 2014 to 16.6 percent in 2015. Among these households, those headed by single mothers saw their food insecurity prevalence drop from 35.3 percent to 30.3 percent. The prevalence of food insecurity for households with children under 6 years old dropped from 19.9 to 16.9 percent as well. This chart appears in the ERS report, Household Food Security in the United States in 2015, published September 2016.

