Editor's Pick 2015: Best of Charts of Note
This chart gallery is a collection of the best Charts of Note from 2015. These charts were selected by ERS editors as those worthy of a second read because they provide context for the year’s headlines or share key insights from ERS research.

Thursday, December 31, 2015
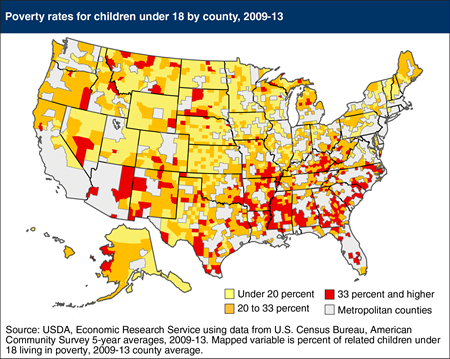
Child poverty rates varied considerably across nonmetropolitan (rural) counties according to 2009-13 county averages (data on poverty for all U.S. counties are available from the American Community Survey only for 5-year averages). According to the official poverty measure, one in five rural counties had child poverty rates over 33 percent. Child poverty has increased since the 2000 Census (which measured poverty in 1999) and the number of rural counties with child poverty rates of over 33 percent has more than doubled. Improving young adult education levels tended to lower child poverty rates over the period, but increases in single-parent households and economic recession were associated with rising child poverty. Metropolitan counties had average child poverty rates of 21 percent in 2009-13. This map appears in the July 2015 Amber Waves feature, Understanding the Geography of Growth in Rural Child Poverty.

Thursday, December 24, 2015
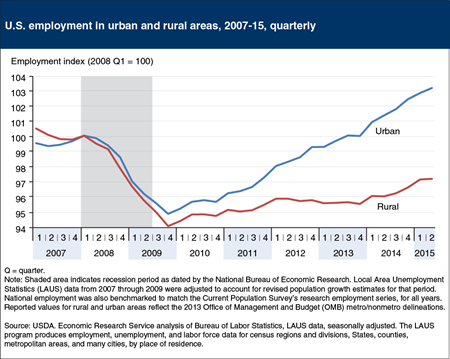
Employment fell by roughly 5 percent in urban areas and 6 percent in rural areas between the first quarter of 2008 and the fourth quarter of 2009—a period that includes the Great Recession. In 2010, the first full year of the economic recovery, urban and rural employment levels grew at comparable rates, and rural areas experienced modest growth the following year. This was followed by 2 years of near-zero employment change before growth resumed in early 2014. An annual growth of more than 1 percent between mid-2014 and mid-2015 has brought the number of employed rural residents (total rural employment) back above 20 million people for the first time since 2008. As of mid-2015, that number remained more than 3 percentage points below its prerecession peak in 2007. This chart is found in the 2015 edition of Rural America At A Glance, released November 30, 2015.

