Editor's Pick 2013: Best of Charts of Note
This chart gallery is a collection of the best Charts of Note from 2013. These charts were selected by ERS editors as those worthy of a second read because they provide context for the year’s headlines or share key insights from ERS research.

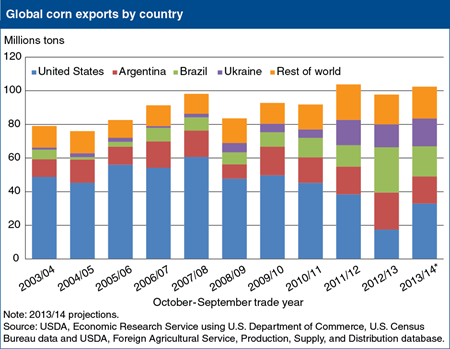
For most of the last century, U.S. corn accounted for between 50 and 75 percent of world corn exports, but over the last decade the United States has lost its dominance in world corn markets. The U.S. ethanol program provided underlying support for corn prices after 2005 and, together with rising global feed demand and policies in some foreign countries, encouraged expansion in foreign corn production, with Brazil and Ukraine notably successful. In 2012/13 (October/September), with several years of below trend U.S. yields compounded by severe drought, foreign corn has become increasingly competitive in world markets. U.S. corn export market share is forecast to fall to less than 20 percent in 2012/13. With record U.S. corn production projected for 2013/14, U.S. export share is expected to increase and the United States is expected to return as the largest exporter. But the U.S. market share is forecast to remain well below 50 percent, while Brazil, Ukraine, and Argentina are each forecast to account for 15 to 20 percent of world corn trade. This chart is adapted from the Feed Grains Chart Gallery. Originally published on Thursday, August 1, 2013.

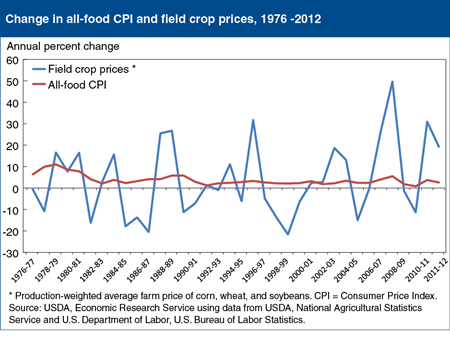
Farm-level commodity prices are far more volatile than food prices, as costs for marketing inputs such as packaging, processing, and transportation mitigate commodity price volatility on supermarket shelves and restaurant menus. Corn, wheat, and soybeans are the three most important field crops to the U.S. food supply. The average farm price of these crops, weighted by total production, regularly rises or falls by over 10 percent from year to year. On average, food prices have become less volatile in recent decades, as food price inflation averaged 8 percent per year in the 1970s, but only 2.8 percent per year since 1990. Commodity prices, alternatively, have grown somewhat more volatile over time. However, large changes in major commodity prices have relatively small impacts on food prices. In 2007-08, the average production-weighted price of these crops increased by 50 percent, while food prices rose 5.5 percent. Similarly, in 2010-11, the crop prices rose 31 percent and food prices increased 3.7 percent. This chart appears in the Food Price Outlook topic page on the ERS website. Originally published on Tuesday, April 23, 2013.

