Editor's Pick 2013: Best of Charts of Note
This chart gallery is a collection of the best Charts of Note from 2013. These charts were selected by ERS editors as those worthy of a second read because they provide context for the year’s headlines or share key insights from ERS research.

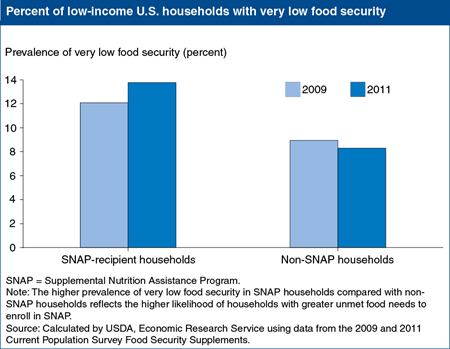
In 2009, as part of the American Recovery and Reinvestment Act (ARRA), Congress temporarily increased the maximum benefit levels of USDA?s Supplemental Nutrition Assistance Program (SNAP) by 13.6 percent, with the intention that, over time, rising food prices would eliminate the ARRA increase. By 2011, inflation had cut the value of the ARRA increase by about half and the percentage of SNAP-recipient households with very low food security had increased to 13.8 percent from 12.1 percent in 2009. Very low food security is characterized by reduced food intake and disrupted eating patterns. Low-income non-SNAP households did not experience worsening food security during this time. ERS analyses of the pre- and post-ARRA periods suggest that future increases in the maximum SNAP benefit of 10 percent would reduce the number of SNAP households with very low food security by about 22 percent, and reducing the maximum benefit by 10 percent would increase that number by about 29 percent. This chart appears in Effects of the Decline in the Real Value of SNAP Benefits from 2009 to 2011, ERR-151, August 2013. Originally published on Friday, August 16, 2013.

