Ag and Food Sectors and the Economy
The U.S. agriculture sector extends beyond the farm business to include a range of farm-related industries. Agriculture, food, and related industries contributed 5.5 percent to U.S. gross domestic product and provided 10.4 percent of U.S. employment; Americans' expenditures on food amount to 12.8 percent of household budgets, on average. Among Federal Government outlays on farm and food programs, nutrition assistance far outpaces other programs.
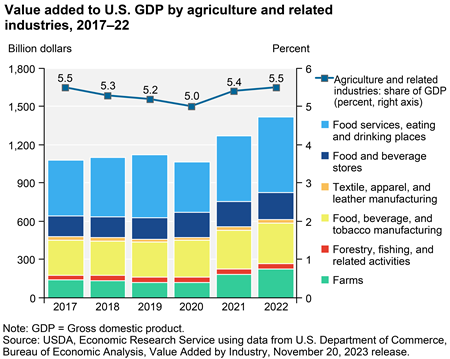
Agriculture , food, and related industries contributed roughly $1.420 trillion to U.S. gross domestic product (GDP) in 2022, a 5.5-percent share. The output of America’s farms contributed $223.5 billion of this sum—about 0.9 percent of U.S. GDP. The overall contribution of agriculture to GDP is larger than 0.9 percent because sectors related to agriculture rely on agricultural inputs to contribute added value to the economy. Sectors related to agriculture include food and beverage manufacturing; food and beverage stores; food services and eating/drinking places; textiles, apparel, and leather products; and forestry and fishing.
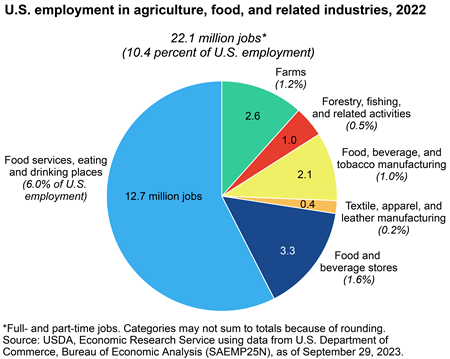
In 2022, 22.1 million full- and part-time jobs were related to the agricultural and food sectors—10.4 percent of total U.S. employment. Direct on-farm employment accounted for about 2.6 million of these jobs, or 1.2 percent of U.S. employment. Employment in agriculture- and food-related industries supported another 19.6 million jobs. Of this, food services, eating and drinking places accounted for the largest share—12.7 million jobs—and food/beverage stores supported 3.3 million jobs. The remaining agriculture-related industries together added another 3.5 million jobs.
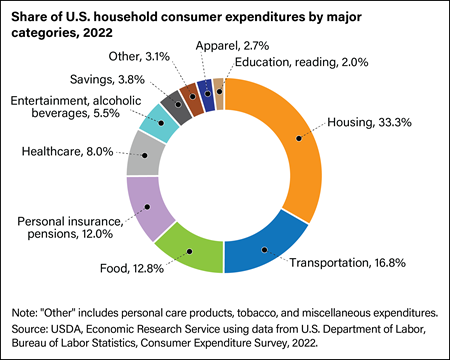
Expenditures on food accounted for 12.8 percent of U.S. households’ spending in 2022, an increase from 12.4 percent in 2021. The share of household expenditures on food ranked third behind housing (33.3 percent) and transportation (16.8 percent). Compared with 2021, the shares of spending for savings, food, transportation, personal insurance/pensions, and apparel categories rose in 2022, and shares for entertainment/alcoholic beverages, healthcare, housing, education/reading, and “other” categories of spending fell.
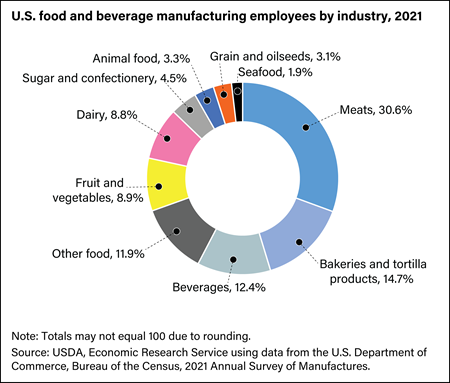
In 2021, the U.S. food and beverage manufacturing sector employed 1.7 million people, or just over 1.1 percent of all U.S. nonfarm employment. In thousands of food and beverage manufacturing plants throughout the country, these employees were engaged in transforming raw agricultural materials into products for intermediate or final consumption. Meat and poultry plants employed the largest percentage of food and beverage manufacturing workers, followed by bakeries and beverage plants.
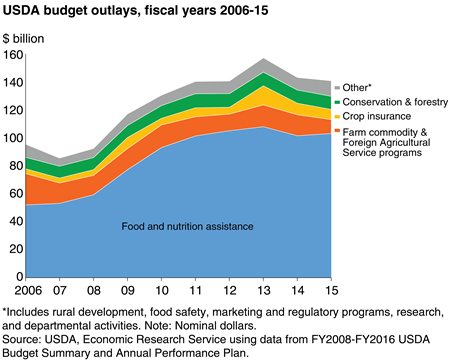
USDA outlays increased by 48 percent from fiscal 2006 to fiscal 2015 (fiscal years begin October 1 and end September 30), with the largest increase coming from food and nutrition assistance programs, which grew especially fast since fiscal 2008, reflecting higher recession-related participation and a temporary increase in per-person benefits from the Supplemental Nutrition Assistance Program (SNAP). An improving economy and expiration of the larger SNAP benefits caused growth of food and nutrition assistance program outlays to slow by fiscal 2012 and decrease in fiscal 2014. Outlays on Federal crop insurance also decreased in fiscal 2014 as extreme weather events subsided and crop prices declined. Commodity program outlays declined in fiscal 2015 with the passing of the new Farm Act in 2014. Food and nutrition assistance accounted for more than 73 percent of USDA outlays in fiscal 2015.

