


Agricultural Economy
(Selected research findings from FY21)
 ERS researchers present a framework for evaluating the effects of changes in capital gains taxation on inherited assets
The Effect on Family Farms of Changing Capital Gains Taxation at Death presents a method for assessing impacts of changes to capital gains taxation at death for family farm estates. The approach accounts for the structural changes in a person’s wealth portfolio that often occurs as a person ages. The method is applied to the American Families Plan, which proposes to eliminate stepped-up basis for inherited assets greater than $1 million for individuals’ estates and $2 million for married couples’ estates while deferring capital gains tax liability on business assets as long as the business remains family operated. The results suggest that of the estimated 32,174 family farm estates in 2021, 1.1 percent would owe capital gains taxes at death, 18.2 percent would not owe capital gains taxes at death but could have deferred tax liability if the farm assets do not remain family owned and operated, and 80.7 percent would have no change to their capital gains tax liability.
Farm income indicators and forecasts measure the financial performance of the U.S. farm sector
ERS provides authoritative information on the financial health of the farm sector, including the performance of farm operations and well-being of farm households. In the September 2021 statement, ERS forecast a 19.5 percent increase in 2021 net farm income relative to 2020 estimates. Over the same period, the median income of farm operator households was forecast to decrease 0.5 percent. Published three times a year, these core statistical indicators provide guidance to policymakers, lenders, commodity organizations, farmers, and others interested in the status of the farm economy. ERS’s farm income statistics also inform the computation of agriculture’s contribution to the gross domestic product for the U.S. economy in the Bureau of Economic Analysis statistics for Gross Domestic Product.
Women are operators in more than half (51 percent) of all farming operations
This report provides statistics on U.S. farms, including production, financial performance, and farm household characteristics by farm size. It also contains a special section on women in agriculture. Women are operators in more than half (51 percent) of all farming operations. Women are the principal operators on 14 percent of operations, and these operations contributed slightly over 4 percent of the total value of production in 2019. Among the findings, 98 percent of U.S. farms are family farms, and they accounted for 86 percent of farm production in 2019. Approximately 90 percent of the farms are small (gross cash farm income less than $350,000), and they accounted for 49 percent of the land operated by farms and 22 percent of production.
The H-2A Agricultural Guest Worker program allows U.S. agricultural employers to hire foreign workers on a temporary or seasonal basis. Many U.S. producers of labor-intensive commodities appear to be adjusting to tighter farm labor markets by employing H-2A workers. All sectors and most regions of the United States experienced significant growth in H-2A employment, but the increase is most pronounced in sectors with high labor requirements and seasonal employment, i.e., fruit and tree nuts, and vegetables and melons. H-2A growth is uneven across the United States with larger employment changes in the Southeast than in other regions. Farm labor contractors (brokers that directly employ farmworkers and lease their services to farms) account for a growing share of H-2A employment.
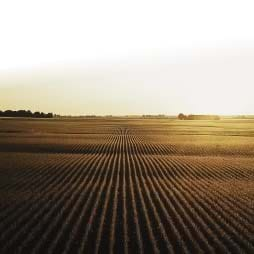
Corn for grain is a major field crop in the United States, with wide-ranging uses including animal feed, ethanol, food, beverages, industrial products, and exports. The costs and returns for corn for grain production in the United States underwent numerous changes over the past several decades. The real price of corn decreased from 1996 through 2005, climbed through 2012, and then declined again, leading to fluctuating net returns, which peaked in 2011. A combination of long-term factors influenced demand for corn, including growing demand for feed to meet rising global meat consumption and expanding biofuel production, as well as periodic weather-related international production shortfalls and declining stocks. Weather, seed technologies, precision agriculture technologies, and irrigation were major factors that influenced the supply and cost of production.
Driven by growing consumer demand for fruits, nuts, and vegetables, U.S. growers are expanding their cultivation of these pollinator-dependent crops. To service the rising number of pollination contracts and seek out quality forage to produce honey, beekeepers move their bees around the country. Using data from a USDA survey of beekeepers, this report quantifies honeybee colony movements over the four seasons and provides a basis for understanding how the transport of honey bee colonies affects pollination services, honey production, and the loss of colonies. The intensity of the use of pollination services across a variety of pollinator-dependent crops in various regions and States is also summarized to explain the timing and volume of colony movements.
Each year, USDA updates and publishes the 10-year supply and demand projections for major crop and livestock commodities in its Agricultural Projections report. The projections—popularly known as the “Baseline”—account for the economic relationships that drive the outlook for U.S. and global supply, demand, and trade for major meats and livestock feeds (corn, soybeans), which are key commodities for the U.S. farm sector performance. The projections are based on expert judgment and models that draw from a range of domestic and international data on supply and demand variables that ultimately affect the U.S. feed-livestock sector. USDA Agricultural Projections to 2030 suggest the domestic use of corn for animal feed—called the feed and residual category—will rise 19 percent between the 2020/21 and 2030/31 marketing years. Corn exports are also projected to grow 19 percent. The domestic use of soybeans, also used in animal feed formulations, is projected to increase by nearly 13 percent, and exports by 8 percent, over the same period. Growth in domestic feed demand for corn and soybeans is strengthened by the 12-percent increase in U.S. exports of beef, pork and poultry projected between 2020 and 2030.
 The majority of rented farmland is owned by landlords who do not operate farms, and a subset of these landlords do not reside in the local farming area
This study looks at the association between landlord absenteeism and multiple measures of long-term economic and agricultural health for the 25 most important agricultural States by cash receipts. The study finds mixed results with respect to investments in soil quality and evidence that the prevalence of absent landlords is associated with declining local employment rates.
This COVID-19 Working Paper estimates the total direct Government assistance to farm operations and farm households in calendar year 2020 from COVID-19 related programs, the Market Facilitation Program, and other Farm Bill programs. The insights from this study supplement the triannual U.S. Department of Agriculture Economic Research Service (ERS) farm income forecasts by providing stakeholders more forecasting details, including information regarding the distribution of Federal payments and eligibility. This further documents methodologies relevant for a timely update of similar payments in the future. Programs specifically designed to address the economic impacts of COVID-19 in 2020 delivered an estimated $35.2 billion. Assistance provided under non-COVID-19 related programs (other than net indemnity payments) delivered an estimated $16.8 billion, and the net indemnity payments provided the remaining $5.7 billion.
 Local food sold directly to consumers, retailers, and institutions may provide financial benefits to beginning and other farmers compared to farmers who market through traditional channels
Local foods are a small but growing share of U.S. agriculture. Marketing channels for local foods include direct sales to consumers (e.g., farmers’ markets, on-farm stores, or pick-your-own stores), grocery stores, restaurants, schools, wholesalers, and food hubs. Local food sales may provide financial benefits to beginning and more experienced farmers compared to farmers who market through traditional channels. This report evaluates the characteristics, production, marketing practices, and financial performance of local food producers with varying levels of farming and direct marketing experience.