Shifting Geography of Population Change
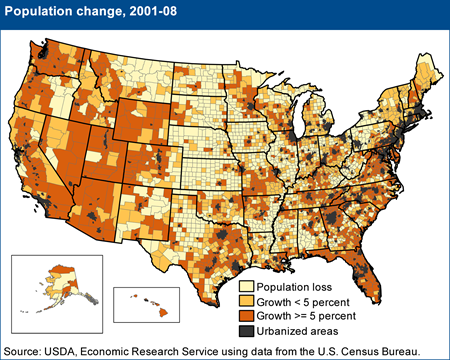
Opportunities for population growth and economic expansion vary widely from one nonmetro county to the next, and a comparison of maps for two time periods (2001-08 and 2010-17) shows that new regional patterns of growth and decline have emerged in recent years. The maps show rates of population growth for all counties, metro and nonmetro. Urbanized areas (shown in dark gray) are at the center of metro areas and nonmetro counties are those that are some distance removed, depending on the size of the metro area.
Geographic patterns of population growth that held sway for decades can be seen on the map for 2001-08:
- Population loss affected most nonmetro counties in the Great Plains from eastern Montana to west Texas, extending into Corn Belt areas of Iowa, Illinois, and parts of other Midwestern States.
- Population loss also occurred in areas of relatively high poverty in the southern Coastal Plains from eastern Texas to Virginia, as well as in Appalachia from eastern Kentucky through upstate New York.
- Rapid population gains in nonmetro counties proximate to large and medium-sized metro areas reflected long-term suburbanization trends that transformed hundreds of rural areas and small towns. Such nonmetro regions include those proximate to Atlanta in northern Georgia, Raleigh-Durham in central North Carolina, and Minneapolis-St. Paul in southern Minnesota.
- Rapid growth was also concentrated in recreation areas with attractive scenery and retirement destinations, such as throughout the Rocky Mountains and Pacific Coast regions, in the Ozarks and southern Appalachia, and along the Gulf of Mexico and southern Atlantic coasts.
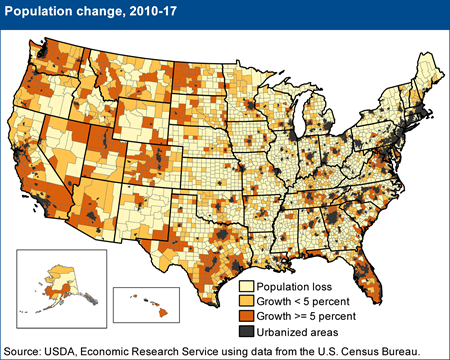
Historic geographic shifts in population growth can be seen on the map below that shows population change since 2010.
- In 2010-17, nonmetro population decline occurred in 16 out of 23 eastern States that had been growing during 2001-08. For example, most metro counties in South Carolina maintained above-average population growth through the housing crisis and recession, but nonmetro areas there have changed from 2.4 percent growth during 2001-08 to -2.3 percent decline since 2010. Extensive areas of population decline have also emerged along the North Carolina-Virginia border, in southern Ohio and northern Kentucky, and throughout New England.
- Population growth slowed considerably in the Mountain West for the first time in decades, affecting numerous counties in Utah, Idaho, Nevada, and elsewhere.
Spurred by an energy boom, large sections of the Great Plains turned around decades of population decline. Other nonmetro regions experienced population gains from energy-related job growth, but the demographic impact has been most visible in sparsely-settled regions such as the Williston Basin in western North Dakota and eastern Montana, the Permian Basin in west Texas and southeastern New Mexico, and the Eagle Ford Field in south Texas. However, the most recent 2 annual periods (2015-16 and 2016-17) show a significant reversal in population growth in these energy-sector regions, in line with recent cut-backs in oil production.
Urban population size, metro proximity, attractive scenery, and recreation potential have historically contributed to nonmetro population growth. For the time-being at least, their influence has weakened. Suburban and exurban population growth has contracted considerably since the Great Recession—for the first time since World War II—affecting not only outlying metro counties but nonmetro counties adjacent to metro areas as well.
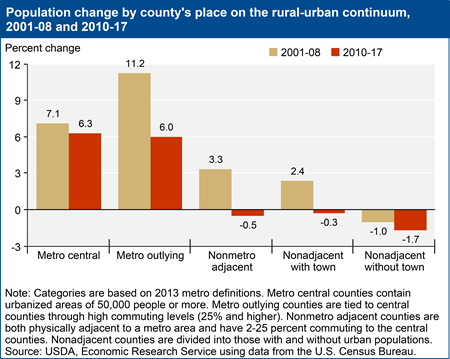
- The housing mortgage crisis slowed suburban development and contributed to a historic shift within metro regions, with outlying counties now growing at a slower rate than central counties (see chart on population change by rural-urban continuum).
- Similarly, nonmetro counties adjacent to metro areas grew rapidly from exurban development for decades, with many hundreds of counties growing large enough to be reclassified as metropolitan. These types of counties declined in population for the first time as a group during 2010-17. The rate of decline was relatively small (-0.5 percent), but the drop from 3.3 percent growth during 2001-08 was larger than the declines in nonadjacent counties with or without a town.
The most recent 2 years of population estimates suggest that this period may simply be a short-term interruption in suburbanization rather than the end of a major demographic regime that has transformed small towns and rural areas throughout the country for decades. Outlying counties in metro areas are once again growing faster than central counties (1.2 percent compared with 0.8 percent in 2016-17). Adjacent nonmetro counties increased in population in 2015-16 and 2016-17, after 6 years of population loss. Despite these recent upticks, it remains to be seen whether suburbanization trends will return to pre-recession levels.
Long-term population growth from steadily booming recreation, tourism, and retirement economies was interrupted as well. During the 1990s and early 2000s, rapid in-migration to nonmetro regions with mountains, lakes, moderate climates, and other natural amenities generated jobs in construction and the service sector, which attracted additional migrants.
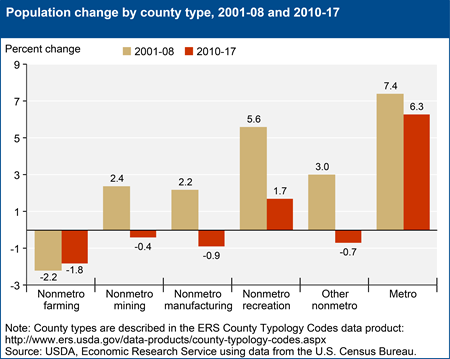
- Population growth in counties with recreation-based employment dropped from a rate of nearly 5.6 percent during 2001-08 to only 1.7 percent since 2010.
- While this represents a dramatic drop in population growth, it still leaves recreation counties growing faster than other types of nonmetro counties.
Along with farming-dependent counties that were already declining in population during 2001-08, manufacturing-dependent counties switched from 2.2 percent population growth in 2001-08 to -0.9 percent population decline in 2010-17.
- Widespread job losses in rural manufacturing, caused by the economic recession, increased global competition, and technological changes have contributed to the nonmetro population downturn since 2010, especially in the eastern parts of the country.
- Population change improved slightly in farming-dependent counties (from –2.2 percent decline in 2001-08 to -1.8 percent in 2010-17), in part because of energy-related job growth that occurred in many such counties in the Great Plains and elsewhere.
- Both farming- and manufacturing-dependent counties have been particularly affected by an aging population, which contributes to slower population growth from natural change.
The -0.4 percent growth rate for nonmetro mining counties during 2010-17 masks a boom-and-bust population cycle during the period. These same counties grew by an average of 0.3 percent per year during 2010-15, then declined -0.9 percent per year in 2015-17, in line with recent cut-backs in energy-sector employment.