


Rural Education
This is a summary of information from the U.S. Bureau of the Census’ American Community Survey and other Federal statistical sources on the educational attainment of the rural (nonmetropolitan) population, and the relationship between educational attainment and economic outcomes. In addition to the following material, the publication Rural Education at a Glance, 2017 Edition summarizes conditions and trends in education in rural areas.
Education is tied to the economic prosperity of rural people and places. The educational attainment of people living in rural (nonmetropolitan) areas has increased markedly over time but has not kept pace with urban (metropolitan) gains, especially in college and postgraduate education. Median earnings rise with higher levels of educational attainment, but more so in urban than in rural areas, compounding the rural earnings disadvantage stemming from lower educational attainment.
Educational Attainment
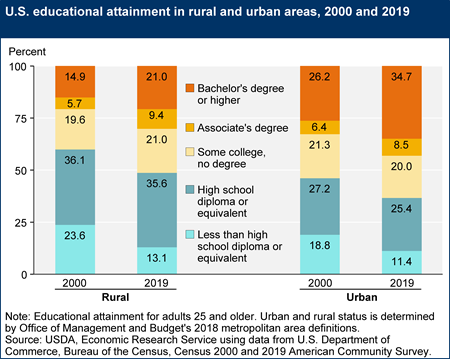
While the overall educational attainment of people living in rural areas has increased markedly over time, the share of adults with at least a bachelor's degree is still higher in urban areas. In 1960, 40 percent of the rural population ages 25 and over had completed high school; by 2019—59 years later—that increased to 87 percent. Over the same period, the proportion of rural adults 25 and older with a bachelor's degree or higher increased from 5 percent to 21 percent; in urban areas, this proportion stood at 35 percent in 2019. The proportion of rural adults with a bachelor's degree or higher increased by 6 percentage points between 2000 and 2019, and the proportion without a high school degree or equivalent, such as a GED, declined by 11 percentage points.
A college completion gap persists for young adults, who are more likely to have completed high school than older adults. Between 2000 and 2019, the share of young adults between the ages of 25 and 34 with a bachelor's degree or higher grew in urban areas from 26 percent to 39 percent. This was a larger increase than observed in rural areas, where the college-educated proportion of young adults rose from 15 percent to 21 percent. A combination of factors could be responsible for the urban-rural college completion gap. Rural household income trails urban household income by roughly 20 to 25 percent, making college relatively less affordable for families living in rural areas. Distance may add another cost to attending college for young people who grow up in rural areas. Those who do complete college may decide to work in urban areas that offer higher wages and more jobs commensurate with their skills and education.
Educational Attainment and Labor Market Outcomes
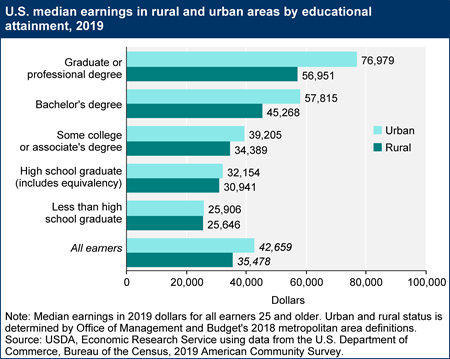
Education is associated with higher earnings in both rural and urban areas. Median earnings for rural working adults with a high school diploma were $30,941 in 2019, which was $5,295 more than the median for rural working adults without a high school diploma or equivalent. The urban-rural earnings gap increases by level of educational attainment. The urban-rural gap in earnings is lowest (about $260) for those with less than a high school diploma/equivalent and is largest (about $20,000) for those with a graduate or professional degree.
The Geography of Low Educational Attainment
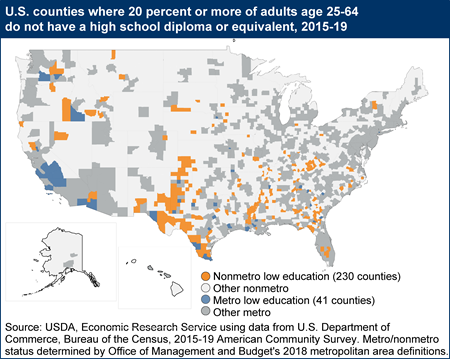
Despite the gains made in educational attainment over time, there is still wide geographic variation in educational attainment within rural areas. The map below shows areas with low levels of educational attainment, defined here as counties where 20 percent or more of the working-age population (adults age 25 to 64) lacked a high school diploma or equivalent during 2015-19. There are 271 such counties in the United States, and a majority of these (230)—about 4 out of 5—are in rural areas. Rural counties with low levels of educational attainment are regionally, economically, racially, and ethnically distinctive. They tend to be clustered in the South (177 counties or 77 percent), more than one-third (96 counties) have an economic base in farming or manufacturing, and more than half (129 counties) are high poverty counties (poverty rate of 20 percent or more), most of which have had persistently high poverty over three or more decades (90 counties). See more on the Geography of Poverty, and the ERS County Typology Codes (a suite of Economic Research Service county classifications that includes persistent poverty and low education). The map below is an update to the low education county type.
The majority (162 counties or 70 percent) of rural low educational attainment counties are areas where African Americans alone (59 counties) or Hispanics of any race (103 counties) comprise 20 percent or more of the total population. Rural Hispanic counties with low education are predominantly in the Rio Grande and Southwest as well as scattered across the Midwest. These counties are much less likely to be high poverty counties (32 percent) than are African American (92 percent) or other (63 percent) rural low-education counties. They also are more likely to be farming counties (35 percent) than their African American counterparts (12 percent), which are mostly in the Southern Coastal Plain and Southeastern Coast, or other (10 percent) low education counties.
A note about the data source for county-level information. The American Community Survey (ACS) was developed by the Bureau of the Census to replace the long form of the decennial census. The ACS uses a rolling sample of U.S. housing units (250,000 monthly) to provide basic population characteristics annually for areas with populations of at least 65,000 people. ACS accumulates samples over 5-year intervals to produce estimates for areas with smaller populations; only the 5-year-average ACS provides coverage for all counties in the United States.