

Retail Trends
USDA, Economic Research Service (ERS) provides information on food store sales and sales growth as well as the share of food sales by retail segment and concentration.
Retail Food Sales and Sales Growth
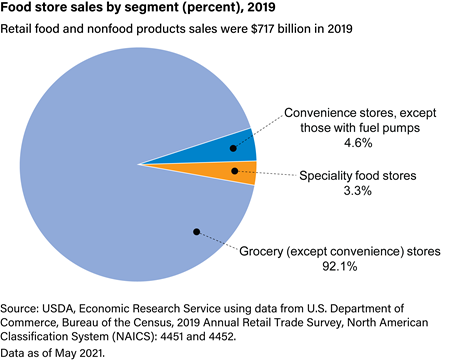
The United States' 115,526 food stores sold $717 billion of retail food and nonfood products in 2019. Grocery stores—including supermarkets and smaller grocery stores, except convenience stores—accounted for the largest share of store sales (92.1 percent), followed by convenience stores without gasoline (4.6 percent). Specialized food stores—including meat and seafood markets, produce markets, retail bakeries, and candy and nut stores—accounted for the remaining 3.3 percent of the total.
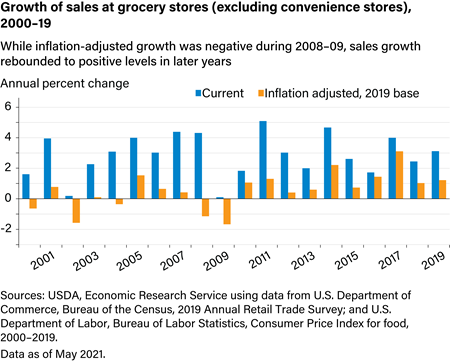
Grocery store (excluding convenience stores) food sales increased following the 2007–2009 Great Recession—a period of economic uncertainty in which traditional grocery retailers experienced negative inflation-adjusted growth. Since 2010, grocery store food sales growth (in current dollars) exceeded the rate of inflation. Inflation-adjusted food sales growth from 2010 to 2019 averaged 1.31 percent per year, compared with –0.19 percent per year from 2000 to 2009.
Download chart data in Excel format
National Food Retail Concentration
Total U.S. food sales at supermarkets, other grocery (except convenience) stores, warehouse clubs, and supercenters reached $653 billion in 2019 (gray bars). At the national level, sales by the 20 largest food retailers totaled $410.4 billion in 2019, accounting for 65.1 percent of total food sales (purple line). This share increased 85.9 percent from 1990 to 2019 (from 35.0 percent to 65.1 percent, respectively).
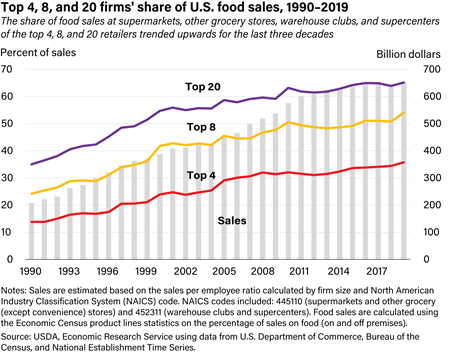
Before and after the Great Recession of 2007–2009, market shares held by the largest 4, 8, and 20 retailers decreased slightly. Since 2012, the longer term trend of an increasing concentration of sales among the United States’ largest retailers has resumed. This trend continued for the top 4 retailers, although the ratio for the top 20 and top 8 fell slightly in 2018, declining by 1.6 and 0.6 percent, respectively. The share of food sales at supermarkets, other grocery (except convenience) stores, warehouse clubs, and supercenters by the top 8 and top 20 retailers rose for 5 consecutive years from 2012 to 2017. The share of food sales by the top 4 retailers rose every year since 2012.