


Food and Beverage Manufacturing
Food and beverage manufacturing plants transform raw food commodities into products for intermediate or final consumption by applying labor, machinery, energy, and scientific knowledge. Some products may serve as inputs for further processing, such as syrup for manufacturing soda. Based on data from the U.S. Department of Commerce, Bureau of the Census’s Annual Survey of Manufactures, these plants accounted for 16.8 percent of sales and 15.4 percent of all employees from all U.S. manufacturing plants in 2021. Because intermediate inputs (primarily food commodities) account for a relatively large share of food and beverage manufacturers' costs, value added in food and beverage manufacturing represents a slightly smaller share (15.0 percent) of value added in all manufacturing.
Meat processing is the largest industry group in food and beverage manufacturing based on sales, value added, and employment. Meat processing includes livestock and poultry slaughter, processing, and rendering. It is the largest industry group in food and beverage manufacturing, with 26.2 percent of sales in 2021. Other important industry groups by sales include dairy (12.8 percent), other foods (12.4 percent), beverages (11.3 percent), and grain and oilseeds (10.4 percent).
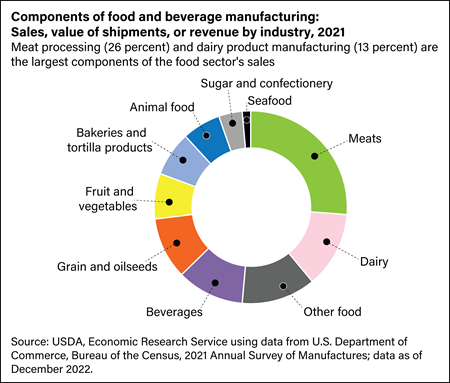
Download chart data in Excel format
Meat processing (22.2 percent) and other food (15.4 percent) are the largest industry groups in the food sector's total value added.
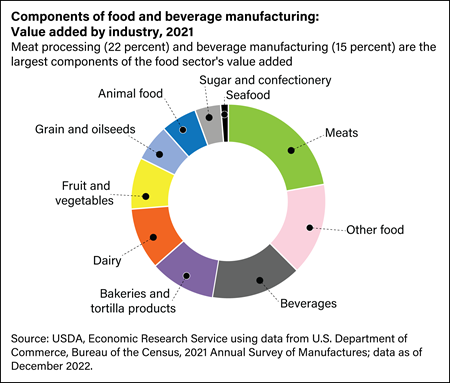
Download chart data in Excel format
Food and beverage processing establishments (plants) employed 1.7 million workers in 2021 (about 15.4 percent of all U.S. manufacturing employment and just over 1.1 percent of all U.S. nonfarm employment). The meat processing industry employed the largest percentage of food and beverage manufacturing workers in 2021 (30.6 percent), followed by bakeries and tortilla producers (14.7 percent).
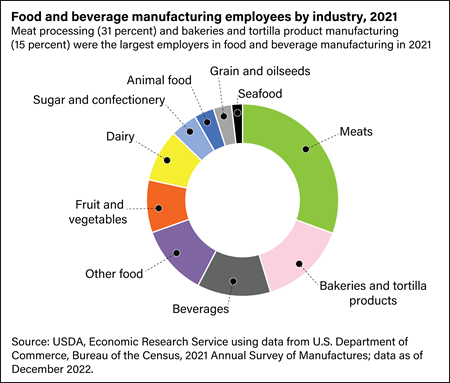
Download chart data in Excel format
There are many food and beverage processing plants in the United States—41,080 in 2021, according to the U.S. Department of Commerce, Bureau of the Census's County Business Patterns. Food and beverage processing plants are located throughout the United States. California had the most food and beverage manufacturing plants (6,301), whereas Texas (2,782) and New York (2,662) were also leading food and beverage manufacturing States. The number of processing plants for various industry segments are also reported in County Business Patterns.
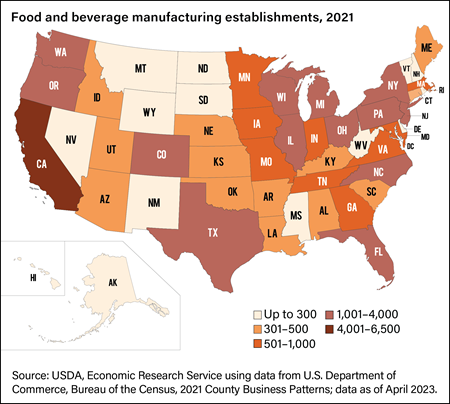
Download map data in Excel format