


Crop Insurance at a Glance
- Federal Crop Insurance Program (FCIP) participation
- Federal Crop Insurance Program insured acreage
- Federal Crop Insurance Program liability by commodity type
- Federal Crop Insurance Program liability by policy type
- Federal Crop Insurance Program indemnities by cause of loss
- Federal Crop Insurance Program loss ratio
- Federal Crop Insurance Program costs
Federal Crop Insurance Program (FCIP) participation
Download chart data in Excel format.
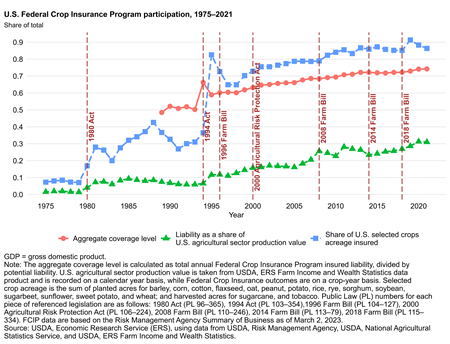
Since its inception in the 1930s, the Federal Crop Insurance Program evolved into a key Federal support program for agriculture in the United States. The USDA, Risk Management Agency (RMA) oversees FCIP and offers agricultural producers financial protection against losses due to adverse events including drought, excess moisture, damaging freezes, hail, wind, disease, and price fluctuations. From 2000 to 2021, FCIP offered financial and administrative support for 133 unique agricultural commodities, covering an average of 284 million acres annually. The average annual FCIP participation from 2000 to 2021 covered 82 percent of eligible acres among producers of barley, corn, cotton, flaxseed, oat, peanut, potato, rice, rye, sorghum, soybean, sugarbeet, sugarcane, sunflower, sweet potato, tobacco, and wheat.
As of 2021, the aggregate crop coverage level (which tracks the ratio of total insured liability to the total potential liability that participants could insure in the program1) reached an all-time high of 74 percent. As shown in the figure above, increased participation was partly the result of legislative changes over the last three decades–including premium subsidies, as well as the introduction of new insurance products. Also, beginning in 2000, RMA introduced a new pricing mechanism known as the continuous rating formula. This mechanism more precisely reflects each producer’s risk of an indemnity and thus results in insurance premiums more tailored to each producer’s unique situation
1 Potential liability for a given producer can be calculated by taking the producer’s total insured liability and dividing by the producer’s chosen coverage level, which represents the total insured liability if that producer were to insure at a 100 percent coverage level. Summing this metric across all participants in the FCIP for a given year provides a metric for the total liability that could conceivably be insured given the year’s current participants and enrolled acreage.
Federal Crop Insurance Program insured acreage
Download chart data in Excel format.
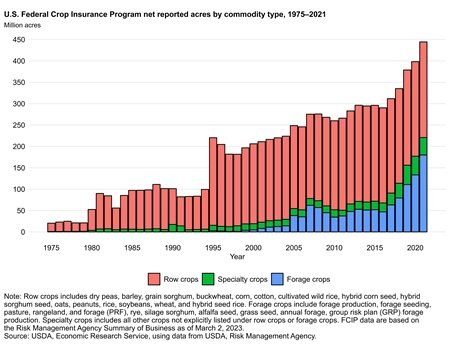
FCIP participation has increased steadily over the last few decades. Insured acreage rose from 206 million acres in 2000 to 296 million acres by 2013. Starting in 2016, insured acres began to rise rapidly—reaching 444 million acres for the 2021 crop year. Much of this recent rise was due to the introduction of policies for Pasture, Rangeland, and Forage (PRF) coverage. Forage crops represented 16 percent of insured acreage in 2016, but this share had risen to 40 percent by 2021.
Federal Crop Insurance Program liability by commodity type
Download chart data in Excel format.
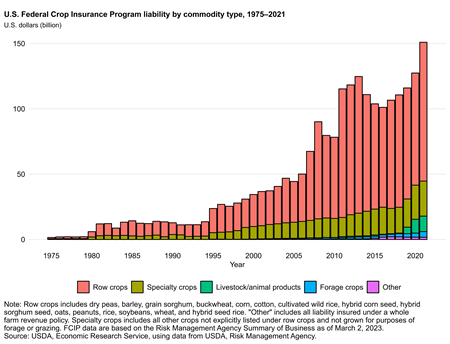
Increases in insured acreage have been met with corresponding increases in total liability—which, as of 2021, was equivalent to 31 percent of the total U.S. agricultural sector production value. The majority of FCIP liabilities are attributable to row crops which represent 70 percent of insured liability in 2021. Behind row crops, specialty crops contribute the next most to total liability (18 percent for 2021). Forage crops, despite representing a large share of total insured acreage, have relatively low monetary values and represented only 3 percent of total liability in 2021.
Federal Crop Insurance Program liability by policy type
Download chart data in Excel format.
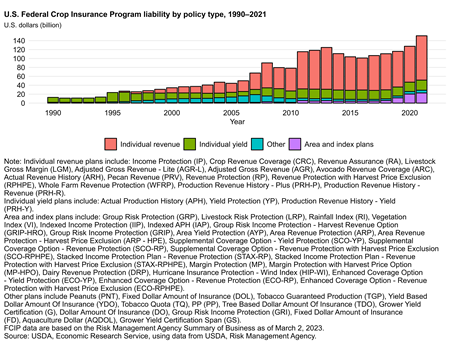
A wide variety of crop insurance products exist, but most can broadly be classified into individual-based policies or area and index-based policies. Further, individual policies can be further classified into yield or revenue protection. Individual policies trigger indemnity payments in response to the individual producer’s loss experience, while area or index plans are conditional on a high level outcome or index (example: reduced yields at the county level) that may not directly correlate with a single insured producer’s experience. Yield-based policies protect against a drop in the quantity of production (i.e., low yields), whereas revenue-based policies guarantee a certain level of production revenue and thus protect against low output prices and/or a drop in the quantity of production. Historically, individual yield-based policies made up most of the insured liability in FCIP. However, starting in the mid-1990s, individual revenue-based policies gained popularity and represented most of the insured liability for the last decade. Area and index plans have been growing in popularity but still represent a relatively small portion (15 percent as of 2021) of total liability when compared to individual policies.
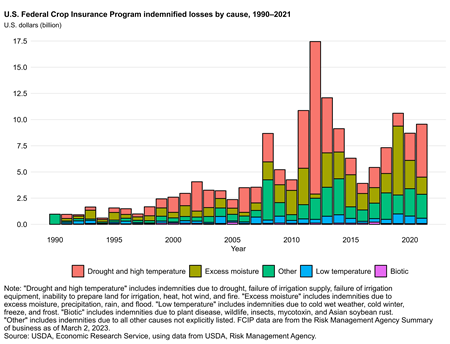
Federal Crop Insurance Program indemnities by cause of loss
Download chart data in Excel format.
Many factors can influence the magnitude of FCIP indemnified losses—including changes in producers’ demand for crop insurance, prevalence of extreme weather events, and changes in crop values over time. Since 2000, annual indemnity payments increased on average by 15.8 percent per year. Although a year-to-year variation exists due to prevailing weather conditions, drought consistently was a leading cause of indemnified losses. Since 2000, 42.1 percent of total indemnity payments were for losses attributed to drought or high temperature. Excess moisture is also frequently responsible for large indemnities—27.5 percent of total indemnity payments since 2000.
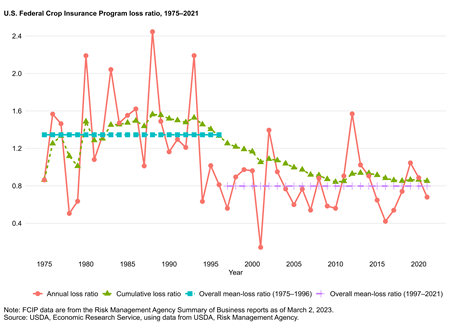
Federal Crop Insurance Program loss ratio
Download chart data in Excel format.
Although indemnities have trended upward for the last several decades, the overall actuarial performance of the program has improved. Prior to the mid-1990s, loss ratios, which measure the ratio of total indemnities to total premiums, were often greater than 1.0—indicating that total indemnities were higher than the sum of collected premiums. Following the passage of the Federal Crop Insurance Reform and Department of Agriculture Reauthorization Act of 1994 (Public Law 103–354), the purchase of crop insurance became a mandatory condition for maintaining eligibility for various benefit programs (including price support programs). This version of the mandatory participation requirement was repealed in 1996. However, a stipulation remained that required farmers who accepted disaster benefits to purchase crop insurance to maintain eligibility for future benefit programs. Additionally, significant underwriting/rating changes were made to the Federal crop insurance program in 1995 (RMA was not established until 1996). The mean loss ratio since 1997 is in line with the congressional mandate (covering projected losses plus reasonable reserve). These legislative changes, along with increases in premium subsidies, helped increase crop insurance participation (and in turn, create a more diversified risk pool). Since 1997, annual loss ratios averaged 0.8, indicating that average annual indemnities total about 80 percent of total premiums.
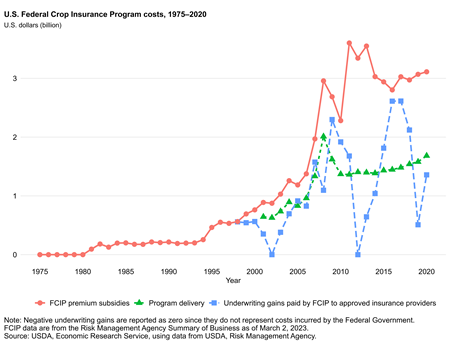
Federal Crop Insurance Program cost
Download chart data in Excel format.
The total cost of maintaining FCIP has also increased with program participation. Premium subsidies, which have historically been the primary policy tool to increase program participation, represent the largest share of total program cost. Premium subsidies totaled $3.11 billion for 2020. In addition, FCIP incurs other costs due to its public-private partnership structure, which is defined via the Standard Reinsurance Agreement (SRA). SRA defines a financial agreement between private insurance companies (formally known as Approved Insurance Providers (AIPs)) and the Federal Government. Under SRA, AIPs sell and service the insurance policies while the Federal Government subsidizes both producers’ purchases and AIPs’ administrative and operating expenses. In 2020, the cost of the program delivery (administrative costs) was $1.68 billion and $1.36 billion was paid as underwriting gains to AIPs. Total FCIP outlays (the sum of premium subsidies, program delivery costs, and underwriting gains) for 2011–2020 averaged $6.06 billion, which is a notable increase compared to the prior decade’s average (direct costs averaged $3.76 billion for 2001–10).