Farm Household Income Estimates
Suggested citation for linking to this discussion:
U.S. Department of Agriculture, Economic Research Service. Farm Household Well-being: Farm Household Income Estimates, November 30, 2023.
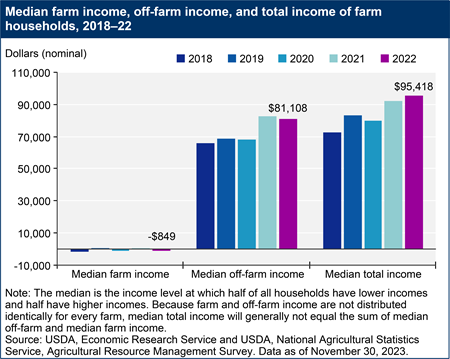
Estimated median total income for farm households increased in 2022 relative to 2021, however, both median farm income and median off-farm income decreased. At the median, household income from farming was -$849 in 2022. Given the broad USDA definition of a farm (see glossary), many small farms are not profitable even in the best farm income years. Median off-farm income in 2022 was $81,108, while the median total household income was $95,418.
(The median is the income level at which half of all households have lower incomes and half have higher incomes. Because farm and off-farm income are not distributed identically for every farm, median total income will generally not equal the sum of median off-farm and median farm income.)
See the Farm Household Income and Characteristics data product table for statistics on principal farm operator household finances for recent years.
2022 Income Varies by Farm Type
The USDA, Economic Research Service (ERS) developed a family farm typology that considers annual gross cash farm income combined with the occupational characteristics of principal farm operators to classify farms into more homogeneous groups. In the USDA, ERS typology, farms with less than $350,000 in annual gross cash farm income are classified as small farms and are further subdivided based on the self-reported primary occupation of the farm’s principal operator. If the operator reports being retired or having a primary occupation other than farming, the farm is classified as a residence farm. If they report farming as their primary occupation and they are not retired from farming, the farm is classified as intermediate. Commercial farms are family farms with $350,000 or more in gross cash farm income, regardless of the principal operator’s primary occupation. In contrast to residence and intermediate farms, commercial farm households derive most of their income from farming activities (see the Farm Household Income and Characteristics data product table on principal farm operator household finances, by farm typology, 2022).
While the number of U.S. family farms has been relatively stable for the past decade, the roughly 2 million U.S. family farms vary significantly in size, level of farm and off-farm income, and total income (see the Farm Household Income and Characteristics data product table on all farms and family farms, by farm size class (gross sales), 1996–2022).
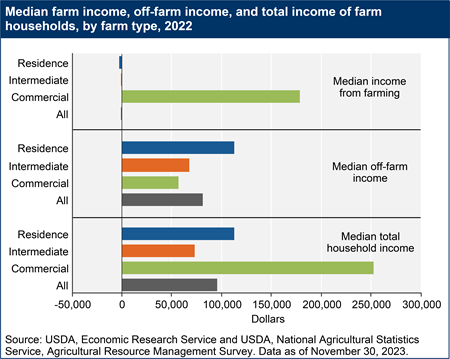
In 2022, the median income from farming was $178,692 for households operating commercial farms, and their median total household income was $252,728. Households associated with intermediate farms reported median farm income of -$125 and a median total household income of $73,304. Residence farms reported median income from farming of -$2,370; however, the substantial off-farm income of residence farm households provided them with higher total median income ($112,794) than intermediate farm households in 2022.
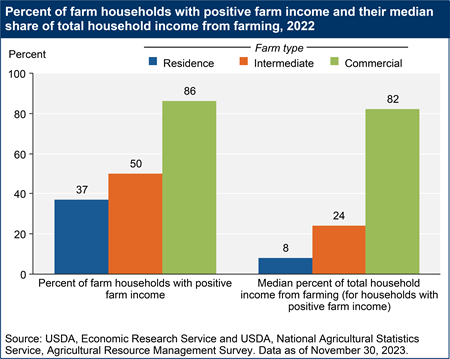
The role of farm income in farm household finances can be further understood by looking at two complementary statistics: the share of households with positive income from farming and, among them, the median percent of total household income derived from farming. Farm income is a small share of total annual income of most farm households operating residence farms, is a secondary source of income for most households operating intermediate farms, and is typically a primary source of income for those operating commercial farms. In 2022, 37 percent of residence farms had positive income from farming, and among those with positive income from farming, that income contributed 8 percent to their total household income at the median. For intermediate farms, 50 percent had positive farm income, which at the median represented 24 percent of their total household income. Finally, 86 percent of commercial farms had positive farm income in 2022, and for those households, farm income accounted for 82 percent of their total household income at the median.
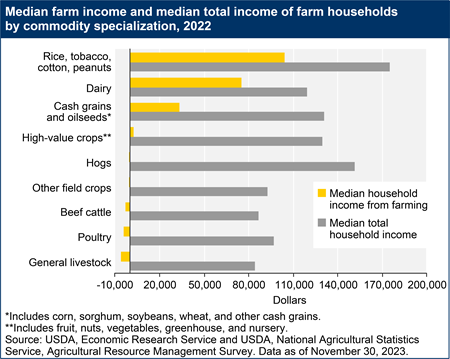
Commodity Specialization
A farm's specialization is determined by the one commodity or group of commodities that makes up at least 50 percent of the farm's total value of agricultural production (see glossary). In any given year, production and market conditions will vary for farms that specialize in different commodities Household income variation may also stem from differences in scale of operation and how much income the operator and other household members can earn off the farm. For example, with its extensive and ongoing time demands, managing a dairy farm rarely permits an operator to work many hours off-farm.
Income by Farm Resource Region
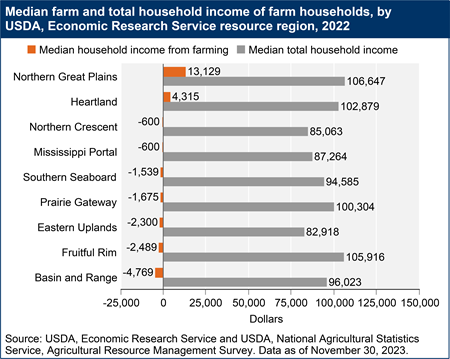
Farm household incomes vary by location, largely reflecting regional differences in farm typology and commodity specialization. USDA, ERS groups farms into nine resource regions based on soil, climate, and agronomic needs. These conditions cut across State boundaries. For details on the farm resource regions, see the ERS brochure, Farm Resource Regions (AIB-760, August 2000).
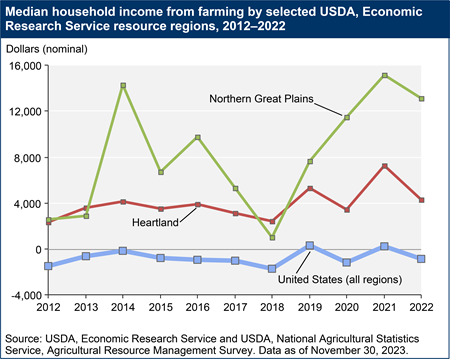
In recent years, only the Northern Great Plains and Heartland Farm Resource Regions have had a consistently positive median farm income for farm households ($13,129 and $4,315, respectively, in 2022), and have the highest total household income. The Heartland has the largest number of farms, the highest value of production, and the most cropland. The region is mainly composed of cash grain and cattle farms. The Northern Great Plains has the most commercial farms and leads production in wheat and barley.