


Farm Bill Spending
Note: Get ERS analysis of the 2018 Farm Act.
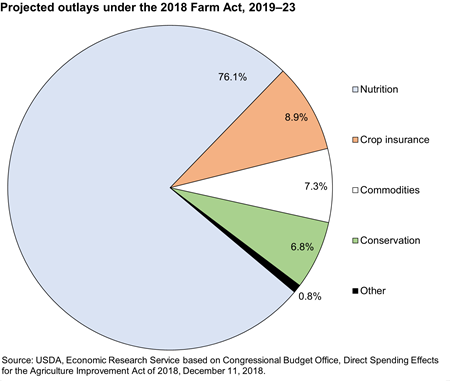
The Agriculture Improvement Act of 2018 (2018 Farm Act) consists of 12 titles governing a wide range of policy areas related to food and agriculture. The Congressional Budget Office (CBO) projected the total cost of the 2018 Farm Act would be $428 billion over the 5-year period 2019–23. Nutrition programs account for about three-fourths of this total, with projected outlays for crop insurance, conservation, and commodities representing nearly all the rest.
Download chart data in Excel format.
The 2018 Farm Act authorizes two kinds of program funding:
Mandatory funding. Programs authorized with mandatory funding are provided funds as needed (or to a statutory level) through the Commodity Credit Corporation (CCC) and are not subject to annual appropriations decisions by Congress. Spending is not constrained by annual limits. Government costs under these programs may vary from year to year, depending on program-participation levels and economic conditions. Congress can alter mandatory-funding levels at any time through new legislation, but there is no automatic reconsideration during the span of the Farm Act. Examples of Farm Act programs provided with mandatory funding include the Supplemental Nutrition Assistance Program (SNAP) as well as most commodity and conservation programs.
Discretionary funding. Programs authorized with discretionary funding may be funded up to the level provided by legislation, but Congress may change the funding level each year for these programs. Once program expenditures reach the level appropriated for that year, no additional funds can be spent unless Congress provides new appropriations. Many research and rural-development programs are funded in this way.
CBO projections include only programs authorized with mandatory funding in the Farm Act.
Four policy areas dominate projected spending under the 2018 Farm Act:
Nutrition. Mandatory nutrition-program spending was projected to account for more than 75 percent of 2018 Farm Act outlays. Details on food and nutrition-assistance-program spending can be found at ERS Ag and Food Statistics: Charting the Essentials, Food Security and Nutrition Assistance.
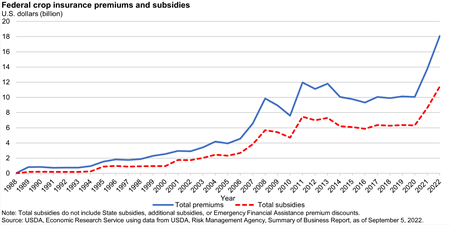
Crop insurance. Under the 2018 Farm Act, crop-insurance-program expenditures were projected to comprise almost 9 percent of total outlays over 2019-23. These expenditures include support to crop-insurance companies for delivery and underwriting, as well as subsidies for farmer premiums.
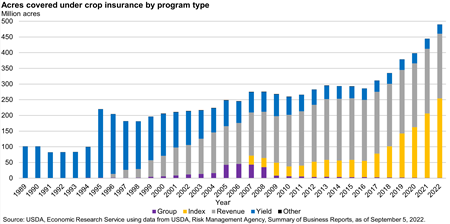
As prices for several major commodities fell from their peaks in 2012-13, premiums and subsidy expenditures correspondingly dropped, since premium calculations depend in part on expected prices and subsidies are a set percentage of the premium. With prices rising again in 2021, premiums and subsidies have followed. Following the introduction of revenue-based insurance policies in the 1990s, their use increased to cover the largest share of enrolled acres. Additionally, index plans and supplemental policy endorsements have gained popularity, in terms of acreage covered, in recent years and have partly contributed to rising premiums and subsidies.
Download chart data in Excel format.
Download chart data in Excel format.
Conservation. Mandatory conservation-program expenditures were projected to account for about 7 percent of outlays under the 2018 Farm Act from 2019-23. Details on conservation-program spending are provided on the ERS website topic page Conservation Programs.
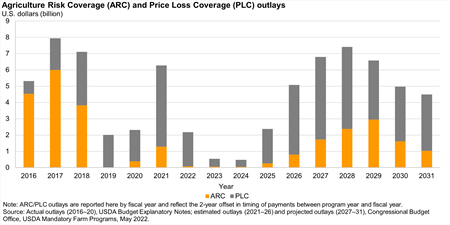
Commodity Programs. Commodity-program payments are projected to make up just over 7 percent of outlays under the 2018 Farm Act from 2019-23. As in the previous Farm Act, commodity payments can respond to changes in yields and market prices, a feature which adds uncertainty to total outlays. For this reason, producers may receive higher or lower payments than the levels initially projected by CBO.
Download chart data in Excel format.
Data sources:
USDA, Economic Research Service farm income data includes calendar-year data, historical and forecast, on direct Government payments.
- U.S. Farm Income and Wealth Statistics, Government Payments provide an interactive database on direct Government payments by program for the United States and individual States. ERS Government-payments data are reported on a calendar-year basis, rather than the fiscal-year basis used by the Congressional Budget Office. ERS does not include crop-insurance data in its Government-payments tables.
USDA, Risk Management Agency (RMA) program data are available by crop year and reinsurance year, historical and most-current years. Crop insurance-program cost and performance data are available on a crop-year basis.
- RMA Summary of Business Application provides an interactive database (updated weekly) of crop insurance-policy characteristics and performance by commodity, State, insurance type, and both crop year and reinsurance year.
- RMA Program Costs and Outlays provides annual tables, by crop year, of Government costs and outlays for the Federal crop-insurance program.