

Background
- U.S. Sugar Production
- U.S. and World Sugar Prices
- High-Fructose Corn Syrup Production and Prices
- U.S. Sweetener Deliveries
U.S. Sugar Production
The United States is among the world's largest sugar producers. Unlike most other producing countries, the United States has both large and well-developed sugarcane and sugarbeet industries. Since the mid-2000s, sugarcane has accounted for between 40 and 45 percent of the total sugar produced domestically, and sugarbeets accounted for between 55 and 60 percent of production. U.S. sugar production has expanded from an early-1980s average of 6.0 million short tons, raw value (STRV) to an average 9.0 million STRV since 2016/17. The production increases are due to a substantial investment in new processing equipment, the adoption of new technologies, the use of improved crop varieties, and acreage expansion (because of higher prices for sugar crops relative to alternative crops).
Sugarcane and sugarbeet yields can vary widely from year to year because of weather, but yields for both have tended to increase over time. The growth of sugarcane yields has been particularly impressive in Florida and Louisiana because of varietal improvements, investments in improved harvesting technologies, and other technological changes. Sugarbeet yields have ranged from a low of 18.6 short tons per acre in fiscal year (FY) 1993 to a high of 32.8 tons per acre in FY 2018.
The number of farms growing sugarcane and sugarbeets has continuously declined over the past two decades, while the average area harvested per farm increased. According to the 2017 Census of Agriculture, the total number of farms growing sugarbeets and sugarcane decreased from 4,714 in 2007 to 4,123 in 2017. The consolidation in the industry is more apparent compared to 2002 when 5,980 sugarbeet and sugarcane farms were in operation. From 2012 to 2017, the number of farms growing sugarbeets declined from 3,913 to 3,496, while average area harvested per farm rose slightly from 319 to 329 acres. Similarly, from 2012 to 2017, the number of sugarcane farms dropped from 666 to 627, which is down from 1,079 sugarcane farms in the United States in 1997.
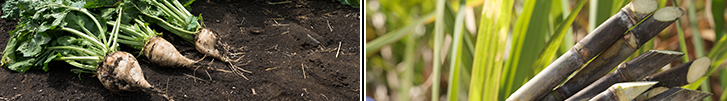
Sugarcane Production
Sugarcane is one of the essential raw material sources of manufactured sugar in the United States. Sugarcane, a tall perennial grass, is grown in tropical and semitropical climates. After the planting of cane stalk cuttings, the plant matures in 1-2 years. Two to four crops are harvested from the original plantings, unless the plants are impaired or destroyed by frost, disease, or other causes. Once harvested, sugarcane must be processed quickly before its sucrose deteriorates.
In the United States, sugarcane is produced in Florida, Louisiana, and Texas. Acreage of sugarcane for sugar rose from an average 704,000 acres in the first half of the 1980s to 903,400 acres in FY 2020/21. Over the same period, sugar produced from sugarcane grew from 2.910 million STRV to 4.251 million STRV in 2020/21.
Florida's sugarcane production has expanded significantly since the United States ceased importing sugar from Cuba in 1960. Florida is the largest cane-producing region in the United States. Most of the sugarcane is produced in organic soils along the southern and southeastern shore of Lake Okeechobee in southern Florida, where the growing season is long and winters are generally warm. Florida produced an average 2.06 million STRV of sugar between FY 2017 and FY 2021.
In Louisiana, the northernmost cane-growing State, sugarcane production has been largely confined to the Delta, where soils are fertile and the climate is warm. However, the sugar industry in Louisiana has expanded northward and westward into nontraditional sugarcane growing areas. Most of the expansion in sugarcane acreage has occurred when returns for competing crops, such as rice and soybeans, have decreased. Louisiana production has also expanded because of the adoption of high-yielding sugarcane varieties, along with investments in new harvesting combines. Louisiana produced an average 1.782 million STRV of sugar between FY 2017 and FY 2021.
Texas sugarcane is produced in the lower Rio Grande Valley in the southern tip of the State. The area has a subtropical climate—long, hot summers and short, mild winters. Killing freezes are a recurrent threat, and hurricane and drought have significantly reduced production in some years. Production of sugarcane in Texas resumed with the 1973 crop after years of inactivity. During the 1980s, total harvested area averaged about 35,000 acres and varied little. Sugarcane production averaged about 100,000 tons per year for the same period, but varied from year to year because of changes in yields. FY 2001 saw a 50-percent expansion in sugarcane acreage from the previous year. Area harvested has averaged about 36,100 acres since FY 2017, and sugar produced averaged 143,000 STRV over the same period.
Hawaii's sugarcane production until recently was spread across the islands of Hawaii, Kauai, Maui, and Oahu, but closures of processing plants and competing uses for sugar land have resulted in the final mill on Maui ceasing operation in 2016.
Sugarbeet Production
Sugarbeets are the other leading raw material for manufactured sugar in the United States. This is a sturdy crop grown in a wide variety of temperate climatic conditions and planted annually. Sugarbeets can be stored for a short while after harvest, but must be processed before sucrose deterioration occurs. A recent development has been the introduction of genetically modified (GM) seed varieties. In the 2009/10 crop year, GM varieties accounted for about 95 percent of planted area, up from about 60 percent in 2008/09. While there have not been any updates in reporting since 2009/10, GM varieties have remained at comparable levels in subsequent years.t years.
Sugarbeets are grown in 4 regions encompassing 11 States and tend to be grown in rotation with other crops. The Great Lakes region (Michigan) is the only growing region east of the Mississippi River. The other three growing areas are the Upper Midwest (Minnesota and North Dakota), the Great Plains (Colorado, Montana, Nebraska, and Wyoming), and the Far West (California, Idaho, Oregon, and Washington). The western regions represent dryland farming that depends on irrigation as a primary water source. The eastern regions depend on rainfall. Historically, sugarbeet yields in the western areas have tended to be higher than in the east. However, with the adoption of new disease-resistant and GM seed varieties, yields in the eastern areas are much closer to those in western areas. In all areas, sugar production is enhanced by technologies that allow the desugaring of molasses, which otherwise would be a relatively low-value byproduct.
The largest and most dynamic region for sugarbeet production is in or close to the Red River Valley of western Minnesota and eastern North Dakota. Area planted in the Red River region increased consistently through the 1990s and into the 2000s and has accounted for the majority of total planted U.S. sugarbeet acreage. Long, cold winters aid the storage of sugar beets harvested in October and allow the slicing of sugarbeets well into the following spring, thereby making more efficient use of slicing capacity at the factories. Michigan, which is typically the third-largest sugarbeet producer in terms of planted area, has a similar production system, although relatively warmer temperatures mean the slicing season is more constrained to the late winter and early spring.
Sugarbeet production in the Far West occurs in Idaho (which is typically the second-largest sugarbeet-producing State by planted area), Washington, and portions of Oregon and California. Production in these States is typically on irrigated land. The sugarbeet processing season is also shorter than in the Red River Valley, although investment in ventilated and covered storage techniques has allowed for a longer season and improved the quality of processed sugarbeets. Contraction of production in this area is primarily due to the closure of three out of the four mills in California over the past few decades, with California production occurring only in the Imperial Valley.
Sugarbeet production occurs in the Upper Great Plains (north-central Wyoming, Montana, and western North Dakota) and Central Grain Plains (southeastern Wyoming, Colorado, and Nebraska). This region typically accounts for about one-eighth of national planted area. As in the Far West, most sugarbeet production in the plains areas occurs on irrigated land. Investment in covered and ventilated storage facilities has also lengthened the slicing season and improved processed sugarbeet quality and processing efficiency in these areas.
Annual Cash Receipts
Cash receipts for U.S. sugar growers vary with sugar yields and prices. Cash receipts for sugarbeets were $1.184 billion in the 2018/19 crop year and $1.098 billion in the 2019/20 crop year. Sugarcane cash receipts were $1.000 billion in the 2018/19 crop year and $1.160 billion in the 2019/20 crop year. On average, the sugar crops account for less than 1 percent of the cash receipts received by U.S. farmers for all agricultural commodities.
U.S. and World Sugar Prices
The two key sugar prices in the United States that have implications for U.S. sugar policy are those for raw cane sugar and refined beet sugar. The domestic raw sugar price is based on the price of the nearby futures contract settlement price listed by the Intercontinental Exchange (ICE) (often referred to as the Number 16 contract). There is no futures market for U.S. refined sugar, but a price range for wholesale Midwest refined beet sugar, free on board (FOB) factory, is quoted each week in Milling and Baking News. Since 2009/10 (October-September fiscal year), the U.S. wholesale beet sugar price has ranged between a low average of 28.84 cents a pound in 2012/13 and a high average of 55.81 cents a pound in 2010/11. The U.S. raw sugar price has similarly ranged to an average of 21.00 cents a pound in 2012/13 from an average of 38.46 cents a pound in 2010/11.
U.S. sugar prices have been above the world futures contract prices listed by the ICE, in large part due to domestic policies such as domestic marking allotments, the non-recourse sugar loan program, and tariff-rate quotas. (For further discussion, see the Policy chapter). The global sugar market is less integrated than other major agricultural commodity markets, however, due to diverse and complex domestic policies of most major sugar-producing and trading countries. As a result, wholesale and retail sugar prices around the globe are influenced by local agricultural and trade policies and vary greatly from market to market, rather than simply reflecting the world futures price.
The world raw sugar price is represented by the nearby futures contract listed by the ICE (commonly referred to as the Number 11 contract). The monthly average world price averaged about 19.23 cents a pound between 2009/10 and 2016/17, but has ranged between 13.42 cents per pound in 2014/15 and 28.42 cents per pound in 2010/11. The world refined sugar price is also measured by the nearby futures contract settlement prices in the ICE—often referred to as the Number 5 contract. Refined prices are higher than raw sugar prices, reflecting the cost of refining and storing sugar to a higher polarity for human consumption. World refined sugar prices have averaged about 23.75 cents a pound from 2009/10 to 2015, ranging between 17.07 cents per pound in 2014/15 and 32.63 cents per pound in 2010/11.
High-Fructose Corn Syrup Production and Prices
High fructose corn syrup (HFCS) is one of several products—along with glucose, dextrose, corn starch, ethanol, and other products—derived from the wet milling of corn. U.S. corn refiners produce high fructose corn syrup by first converting corn starch to a syrup that is nearly all dextrose. Enzymes isomerize the dextrose to produce a 42-percent fructose syrup called HFCS-42. By passing HFCS-42 through an ion-exchange column that retains fructose, corn refiners draw off 90-percent HFCS and blend it with HFCS-42 to make a third syrup, HFCS-55.
Demand for HFCS is driven by demand for products that use the syrups as inputs. For HFCS-55, the major use is in the beverage industry. Major food users of HFCS-42 include the beverage industry, processed food manufacturers, cereal and bakery producers, multiple-use food manufacturers, the dairy industry, and the confectionery industry. Growth in these sectors has typically accounted for growing sales of HFCS-55 and HFCS-42. Supersweet HFCS-90 is used in foods where very little is needed to provide sweetness.
Domestic production of HFCS increased from 2.2 million short tons in 1980 to a peak of 9.5 million tons, dry weight, in 1999 as HFCS replaced more expensively priced sugar in a variety of uses. Since 2000, production of HFCS has declined by about 19 percent, with 2019 production totaling 7.9 million tons. In 1997, corn used to produce HFCS broke through the 500-million bushel level and reached as high as 552 million bushels in 1999. Similar to production trends, however, since 2010 HFCS has accounted for between 425 and 520 million bushels. Sweeteners had accounted for as much as 10 percent of U.S. corn production in the past. Declining HFCS production and increasing corn production, which has been stimulated by increasing demand for ethanol, has resulted in the sweeteners accounting for about 6 percent of the U.S. corn crop.
U.S. Sweetener Deliveries
Deliveries of sugar and other sweeteners have averaged about 21 million tons since 2010 and have remained stable over the past 20 years. Other sweetener deliveries include corn sweeteners (high-fructose corn syrup, glucose syrup, and dextrose), honey, maple syrup, and other edible syrups but exclude the deliveries of noncaloric sweeteners.
Per capita deliveries of caloric sweeteners increased by 34 pounds, or 29 percent, from 1970 to 153.2 pounds in 1999. From the peak in 1999, per capita sweetener deliveries have decreased by 28.3 pounds to 123.3 pounds in 2019. Refined sugar deliveries account for more than 50 percent of total sweetener deliveries compared with HFCS, which accounts for about one-third of deliveries. While per capita deliveries have been trending downward since 2000, the share of sweeteners accounted for by refined sugar has increased from 44 percent in 2010 to 56 percent in 2019. This increase has come primarily at the expense of HFCS deliveries.