

Documentation for the Farm Sector Cash Receipts Estimation
Beginning with the August 2015 release, ERS adopted a methodology that enabled estimation of an expanded detail of commodity cash receipt data in the Farm Income and Wealth Statistics data product. This page explains the methodology used to estimate previously unpublished State-level cash receipts. It begins with a brief discussion about why the method was necessary, outlines a detailed explanation of the methodology, and details the method's implications and benefits.
Why Is a Revised Cash Receipts Estimation Method Necessary?
Each August, ERS produces estimates of the prior year's cash receipts—the cash income the farm sector receives from commodity sales. ERS data draw heavily on sales data collected and released to the public by USDA's National Agricultural Statistics Service (NASS). However, to protect the confidentiality of individual survey respondents, NASS does not publish detailed sales data for all commodities in all States. When these data cannot be published separately for a particular State, NASS maintains confidentiality by combining the data with other unpublished State-level data in an "Other States" grouping. This reduces the amount of commodity detail available and limits ERS reporting to approximately 60 percent of each State's cash receipts at the individual commodity level. Using this method, it is only possible to publish detailed data on hogs, milk, broilers, rice, wheat, corn, and tobacco. As shown in the annual cash receipts by commodity (condensed), U.S. and States table, the remainder of each State's cash receipts are reported only at an aggregated level.
Detailed State-level commodity information allows farmers, agribusinesses, lenders, policymakers, and the general public to analyze State-level commodity trends. For example, soybean cash receipts—the value of which is the second largest across all U.S. crops—had to be combined with other oil crops to ensure the confidentiality of producers of other oil crops. Using ERS' method detailed below, all soybean cash receipts data (over $41 billion, on average, from 2008-14) could be separately reported for each producing State, rather than aggregated into a broader category (oil crops).
How ERS Now Estimates State-level Cash Receipts
To overcome data limitations and increase the level of published commodity detail, ERS worked with NASS to develop an approach that allows ERS to estimate State-level cash receipts from the "Other States" grouping reported by NASS. ERS and NASS determined that it was important to adopt a simple and transparent method that is consistent with other aspects of the Farm Income and Wealth Statistics data product. This method builds on a procedure that is already in place to allocate NASS published regional production expense data to individual States using Census of Agriculture expense data. The major additional contribution over the expense method is the introduction of an algorithm to automatically select a distribution variable that most closely approximates cash receipts among several candidates from Census of Agriculture data. This results in the NASS Other States cash receipts (i.e., sales) data allocated to the underlying States by the best available commodity data on sales, production, inventory, or number of producers available from the Census of Agriculture (COA). To ensure transparency and reproducibility, the approach relies on publicly available information reported in NASS Quickstats.
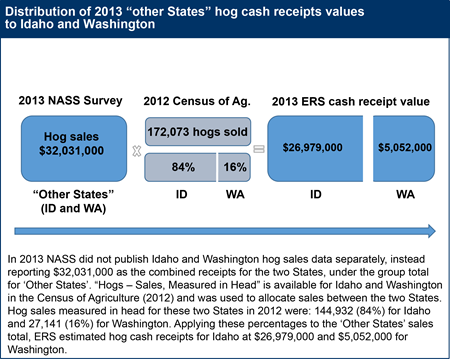
For example, in 2013 NASS was unable to separately publish Idaho and Washington hog sales data, instead reporting $32,031,000 as the combined receipts for the 2 States, under the group total for "Other States." "Hogs – Sales, Measured in Head" is available for both Idaho and Washington in the Census of Agriculture (2012) and used to allocate sales between the two States. Hog sales measured in head for these 2 States in 2012 were: 144,932 (84%) for Idaho and 27,141 (16%) for Washington. Applying these percentages to the "Other States" sales total, the hog cash receipts for Idaho is $26,979,000, while $5,052,000 is allocated to Washington.
Impact of Revised Cash Receipts Estimation Method
Beginning with the August 2015 data release, the Farm Income and Wealth Statistics data product incorporated this method for estimating cash receipts for data in 2008 forward. The method allows for substantially greater publishable detail—up to 94 percent of the total value of State cash receipts are now published at an individual commodity level, with the remainder included in the "all other animals and products" and "miscellaneous crops" categories. Originally, only 60 percent of the total value of each State’s cash receipts was reported.
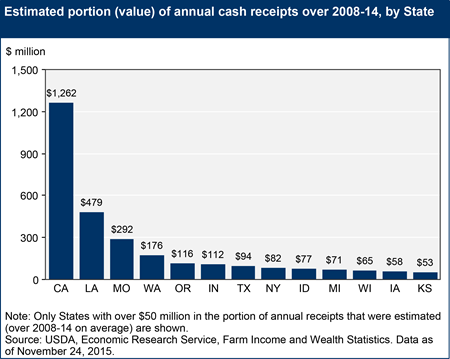
To fully understand the revised method's impact, it is useful to analyze both the dollar value and share of cash receipts estimated by the revised method for each State. The overall impact in terms of cash receipt dollars estimated by the method is relatively small for any single State. For example, California had the highest dollar value estimated using the revised method—on average, $1.3 billion out of $43.6 billion of California's annual cash receipts were estimated from 2008 to 2014. All other States had less than $0.5 billion estimated, and most were below $0.1 billion.
California had under $1.3 billion (2.9 percent) of average annual cash receipts estimated using the revised method, 2008-14
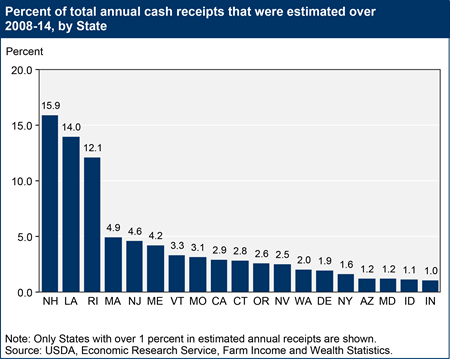
The share of cash receipts estimated using the revised method varies by State (because unpublished NASS data vary by State), but overall the revised methodology had a small impact on cash receipt data. New Hampshire (16 percent), Louisiana (14 percent), and Rhode Island (12 percent) have the largest share of their State-level total cash receipts estimated by the revised approach, on average, from 2008 to 2014. However, no other State had greater than 5 percent of cash receipts estimated this way, and the majority had less than 1 percent.
Only three States had more than 5 percent of their average annual cash receipts estimated using revised method, 2008-14
While both the dollar amount and share of total cash receipts estimated under the revised method are relatively small, the approach has had a large impact on ERS' ability to report detailed cash receipts. As a result of the change, the Farm Income and Wealth Statistics data product is now able to report detailed, State-level cash receipt data for an additional 113 commodities, compared to the aggregated version of the cash receipts table, which shows only 7 commodities. The annual cash receipts by commodity, U.S. and States table shows the level of detail that is now possible. The additional detail also makes it feasible to create new reports that allow users to choose a State and get commodity cash receipt rankings or choose a commodity to get ranked States. ERS was also able to use the additional information to create interactive visualizations that allow users to explore the newly available data.
Method for Choosing the Census of Agriculture Variable to Allocate Other State Cash Receipts
To make the revised cash receipts method as transparent and repeatable as possible, the method uses publicly available Census of Agriculture (COA) data to allocate the published NASS “Other States” data to the underlying States. Data from the most recent COA is used in the allocation process. It is necessary to select a distribution variable that most closely approximates cash receipts among several candidates from COA data. Ideally, it would be possible to use sales or production dollar values for each commodity. However, some of the COA sales or production values are also unpublished. As a result, additional variables are considered including inventory and number of operations. We also consider the same variables for broader commodity categories (i.e., animal totals sales). A ranking system is used to determine the COA variable used to distribute the "Other States" value.