ERS Charts of Note
Subscribe to get highlights from our current and past research, Monday through Friday, or see our privacy policy.
Get the latest charts via email, or on our mobile app for  and
and 
Wednesday, March 20, 2024
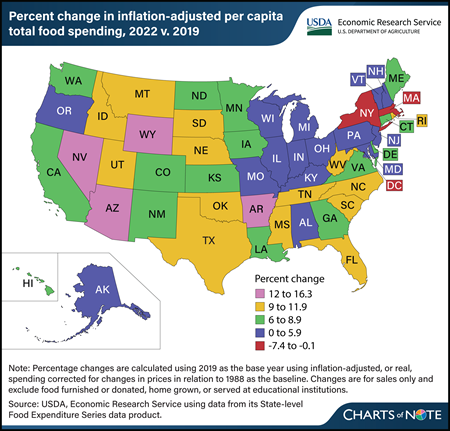
The U.S. food system experienced many changes since 2019, particularly during the Coronavirus (COVID-19) pandemic. Per capita total U.S. food spending increased 6.3 percent in 2022 compared with 2019 when adjusted for inflation. Inflation-adjusted food-at-home spending approached 2019 levels in 2022, while food-away-from-home spending remained high compared with prepandemic levels. However, this trend was not consistent across States. Washington, DC, had the largest decrease in total food spending between 2019 and 2022 (7.4 percent), mainly driven by a 12.9-percent decline in food-away-from-home spending. States with decreases or relatively small increases in total food spending were largely concentrated in the Northeast. Massachusetts and New York each saw decreases of 0.7 percent in inflation-adjusted, per capita total food spending between 2019 and 2022, while food spending in Vermont grew 1.6 percent. Many States with the largest increases in inflation-adjusted, per-capita food spending were concentrated in the West, with Nevada (16.3 percent), Wyoming (15.5 percent), and Arizona (13.9 percent) seeing the largest increases over the period. This chart is drawn from USDA, Economic Research Service’s State-level Food Expenditure Series, updated February 2024. For more on food spending, see the Amber Waves article U.S. Consumers Spent More on Food in 2022 Than Ever Before Even After Adjusting for Inflation, published September 2023.
Tuesday, March 19, 2024
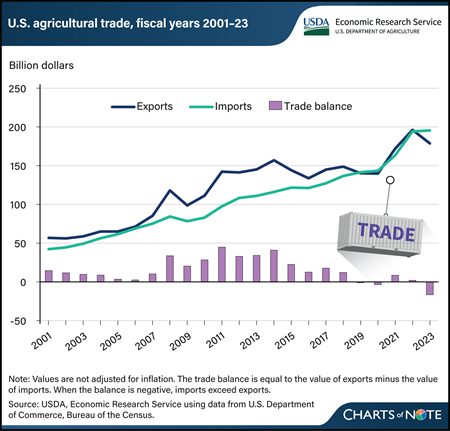
The U.S. agricultural trade balance measures the difference between the values of exported farm goods and those imports from other countries. For nearly 60 years, U.S. agricultural trade maintained a surplus, but in fiscal year (FY) 2019, the balance shifted to a deficit, where it has stayed 3 out of the last 5 fiscal years. In FY 2023, U.S. agricultural imports exceeded exports by $16.6 billion. Imports have largely followed a stable upward trend, while exports have had relatively wide swings. From FY 2013 to 2023, import values increased at a compound annual growth rate of 5.8 percent, and exports grew at a rate of 2.1 percent. Although the U.S. agricultural trade balance is closely watched, it reflects changing consumer tastes, a robust economy, and a strong dollar, and is not an indicator of export competitiveness or import dependence. The U.S. consumer’s growing appetite for high-valued imported goods—such as fruits and vegetables, alcoholic beverages, and processed grain products—has contributed to the expanding trade deficit. Those goods often include products that can’t be easily sourced in the United States, such as tropical products or off-season produce. In contrast, nearly 40 percent of U.S. exports are bulk commodities, whose prices respond more rapidly to global markets. This chart also appears in the USDA, Economic Research Service report Selected Charts from Ag and Food Statistics: Charting the Essentials, 2024.
Monday, March 18, 2024
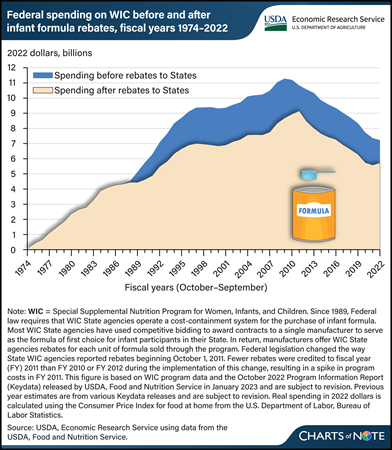
The Special Supplemental Nutrition Program for Women, Infants, and Children (WIC) serves to safeguard the health of low-income pregnant and postpartum women, infants, and children younger than 5 years who are at nutritional risk. State agencies responsible for implementing WIC use cost-containment strategies to reduce program costs. The greatest savings come from strategies used to contain the costs of providing infant formula through the program. Since 1989, most WIC State agencies have used competitive bidding to award contracts to a single manufacturer to serve as the formula of first choice for infant participants in their State. In return, manufacturers offer WIC State agencies rebates for each unit of formula sold through the program. From 1989 to 2022, savings to WIC from the rebates totaled $71.9 billion (in inflation-adjusted 2022 dollars), or 23 percent. Without the rebates, the Federal Government would have spent about $307.5 billion on the WIC program over that period. With the rebates, the Government spent $235.6 billion. This chart is drawn from the USDA, Economic Research Service report The Special Supplemental Nutrition Program for Women, Infants, and Children (WIC): Background, Trends, and Economic Issues, 2024 Edition, published in February 2024.
Thursday, March 14, 2024
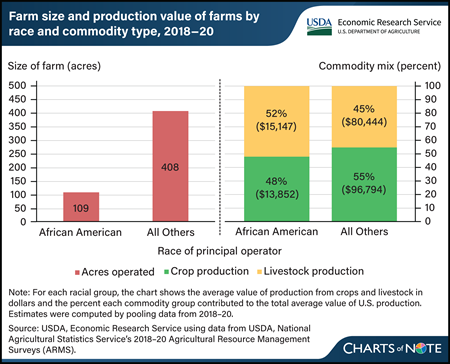
Researchers at USDA’s Economic Research Service (ERS) evaluated characteristics of farms operated by African Americans using data from the 2018–20 Agricultural Resource Management Surveys (ARMS). The researchers observed that farm size and commodities produced differed across race. During 2018–20, the average African-American-operated farm was less than one-third the size of other farms. African-American farms operated an average of 109 acres compared with an average of 408 acres for all other farms. The choice of commodities produced also varied by race. About 83 percent of African-American farms were livestock farms, with livestock production making up more than half of their production value. In contrast, about 66 percent of other farms were livestock farms. The differences in farm size and commodities produced were found to contribute to differences in farm production values. On average, total value of production was about $29,000 for African-American farms, while that of farms with principal operators of other races was about $177,000. Together, these factors contributed to the average African-American farm earning lower net farm income than other farms. This article is drawn from the ERS Amber Waves article Farm Size, Specialization Are Among Factors Influencing Financial Performance of African-American Farms in United States, published in February 2024.
Wednesday, March 13, 2024
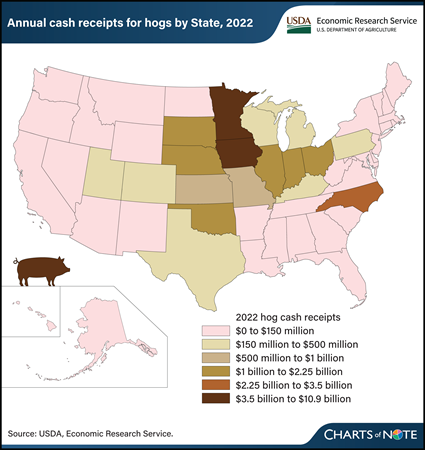
Iowa is the top producer of hogs in the United States, with about $10.9 billion in cash receipts in 2022. Cash receipts represent the value of sales of hogs by farmers to processors or final users. Following Iowa are Minnesota, North Carolina, and Illinois, with cash receipts of $3.6 billion, $3.1 billion, and $2.1 billion, respectively. Iowa accounted for about 35.5 percent of the $30.6 billion in total U.S. cash receipts for hogs in 2022. The top 10 hog-producing States cumulatively accounted for 87.6 percent of hog receipts. The latest Hogs and Pigs report from USDA, National Agricultural Statistics Service indicated there were nearly 75 million hogs in the United States as of December 1, 2023. USDA, Economic Research Service (ERS) estimates farm sector cash receipts—the cash income received from agricultural commodity sales—three times each year. These data include estimates broken down by State and commodity and offer background information on the Nation’s agriculture. The information in this chart is available in the ERS Farm Income and Wealth Statistics data product, updated in February 2024.
Tuesday, March 12, 2024
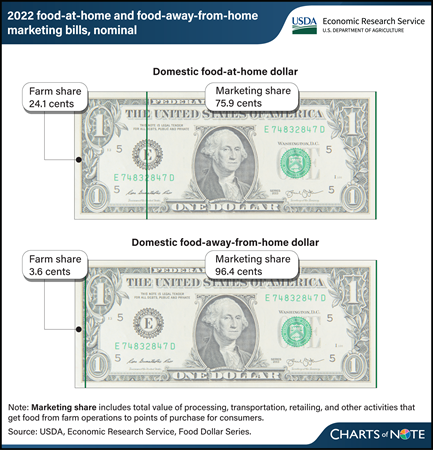
In 2022, farm establishments received 24.1 cents for each dollar spent on food at home and 3.6 cents for each dollar spent on food away from home. These amounts, called farm shares, highlight the different paths that food takes from farms to consumers' points of purchase. Food-at-home dollars include food purchases from outlets such as grocery stores, supermarkets, and wholesale clubs that are meant to be prepared at home. Food-away-from-home dollars include food purchases at restaurants, including delivery and carry-out, and other venues where the food is eaten on the premises. The remainder of each food dollar makes up the marketing share, which is the total value of processing, transportation, retailing, and other activities that get food from farm operations to points of purchase for consumers. In 2022, the marketing share was 75.9 cents per food-at-home dollar and 96.4 cents per food-away-from-home dollar. The marketing share can change based on many factors, such as consumer preferences and the costs of production inputs. The marketing share is higher for food away from home because of the higher costs of preparing and serving meals. Find additional information in the USDA, Economic Research Service’s (ERS) Amber Waves article ERS Food Dollar's Three Series Show Distributions of U.S. Food Production Costs, published in December 2023, and the ERS Food Dollar Series data product, updated November 15, 2023.
Monday, March 11, 2024
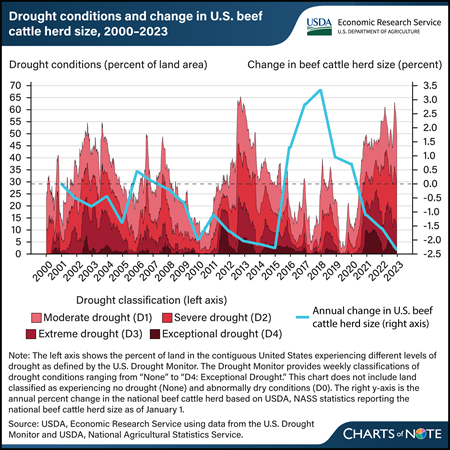
Beef cattle operations that rely on precipitation to grow forage to feed their herds are particularly vulnerable to drought. When drought conditions diminish forage production and availability, beef cattle producers often must buy supplemental feed and forage or reduce their herd size. Periods of more intense drought are associated with decreases in the U.S. beef cattle herd size, such as when the national beef cattle herd shrank about 1 to 2 percent a year during drought between 2011 and 2015. This chart also shows that cattle numbers grew in the less intense drought years of 2015 to 2018. Other factors outside of drought conditions also influence changes in the beef cattle herd size, including feed and forage prices, extreme precipitation events, supply chain issues, and the natural life cycles of livestock (i.e., the cattle cycle). To support livestock producers negatively impacted by drought conditions, the USDA administers a range of programs such as the USDA, Farm Service Agency’s Livestock Forage Disaster Program (LFP), which provides payments to livestock producers whose forage production is diminished by drought. LFP eligibility is determined by drought conditions reported by the U.S. Drought Monitor. Many livestock species, ranging from beef cattle to reindeer, are eligible for LFP payments. LFP payment rates are species specific and designed to cover about 60 percent of monthly feed and forage costs. For more about the U.S. beef cattle herd, the LFP, and the potential impact of LFP payments on the Federal budget, see the USDA, Economic Research Service report The Stocking Impact and Financial-Climate Risk of the Livestock Forage Disaster Program, published in January 2024.
Friday, March 8, 2024
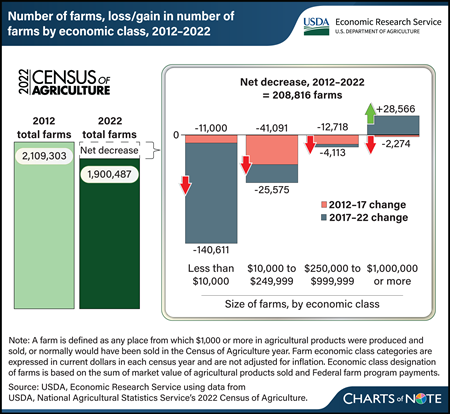
In 2022, farms in the United States numbered 1,900,487, down from 2,109,303 in 2012, according to data from the 2022 USDA Census of Agriculture released in February 2024. That represented a 10-percent (208,816 farms) decline from 2012 to 2022. The Census of Agriculture is a complete count of U.S. farms conducted every 5 years by USDA, National Agricultural Statistics Service. As such, it provides a picture of how different-sized farms, categorized by economic class, changed. In looking at the last two 5-year survey periods, the number of farms decreased in all four farm size categories from 2012 to 2017, represented by the red part of bars in the chart. From 2017 to 2022 (represented by gray part of bars), there was an overall decrease in the number of farms, with a drop in the smallest three economic class categories and an increase in the number of farms with annual revenue of $1 million or more. Farms with annual revenue of less than $10,000 dropped the largest in number within the decade, declining by 151,611 farms, or 13 percent. On the other hand, large farms of $1 million or more in revenue increased by 32 percent, that is, from 81,660 farms in 2012 to 107,952 farms in 2022. The number of farms with $10,000 to $249,999 in revenue declined by 66,666 (a 9-percent decrease) from 2012 to 2022, and farms with revenue of $250,000 to $999,999 declined by 16,831 (a 10-percent decrease). To explore the 2022 Census of Agriculture, see the NASS Census of Agriculture website. For more information on farm structure and its relationship with agriculture, as well as other statistics on the financial performance of farms and ranches, see USDA, Economic Research Service’s report America’s Farms and Ranches at a Glance: 2023 Edition, published in December 2023, which draws on data from the NASS Agricultural Resources Management Survey (ARMS) of farm operations in 2022.
Thursday, March 7, 2024
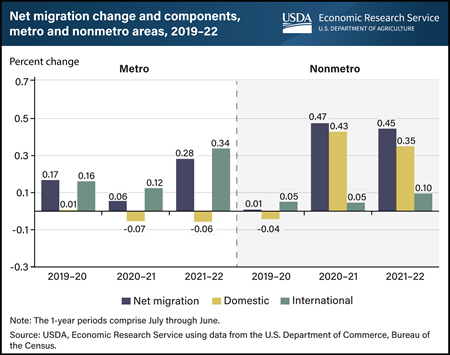
Both rural (nonmetro) and urban (metro) populations grew because of increased migration over the last few years; however, the sources of the increased migration are different. In 2020–21 and 2021–22, rural areas experienced an increase in population because more people moved from urban to rural areas than in the opposite direction, a reversal of domestic migration trends from the previous decade. Domestic migration occurs when people move among areas within the United States. Net domestic migration in rural areas jumped from near zero in 2019–20 to more than 0.35 percent in the last two years. Fear of exposure to Coronavirus (COVID-19) in urban areas and the subsequent increase in remote work contributed to this dramatic shift in migration patterns. Conversely, urban areas increased their population through migration from other countries. International migration to urban areas reached a peak of 0.34 percent in 2021–22. The growth in migration rates for both urban and rural areas are somewhat offset by elevated death rates (which are falling from pandemic highs) and lower birth rates. This chart is drawn from the USDA, Economic Research Service report Rural America at a Glance, published in November 2023.
Wednesday, March 6, 2024
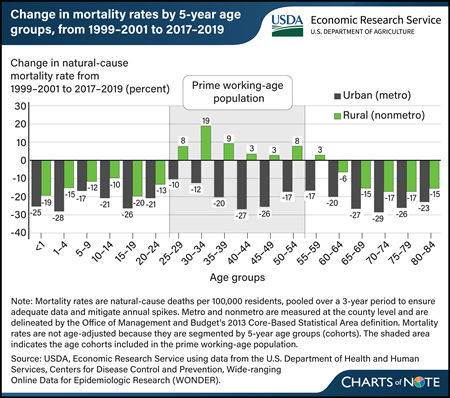
Over the last two decades, disease-related (natural-cause) mortality rates have widened between rural and urban areas, especially for the prime working-age population (aged 25–54). Researchers with USDA, Economic Research Service (ERS) compared natural-cause mortality in rural and urban areas between two 3-year periods, 1999–2001 and 2017–2019. They found the gap between rural and urban natural-cause mortality rates widened between the two time periods. Natural-cause mortality rates decreased across all age groups in urban areas. In rural areas, mortality rates decreased for most age groups (although not as much as for the same groups in urban areas) but increased for the prime working-age population. The rural group with the largest increase (19 percent) in natural-cause mortality rates was 30- to 34-year-olds. Increased mortality rates for people who are of prime working age are an indicator of worsening population health, which could have negative implications for rural families, communities, employment, and the economy. This chart appears in the ERS report The Nature of the Rural-Urban Mortality Gap, published in March 2024.
Tuesday, March 5, 2024
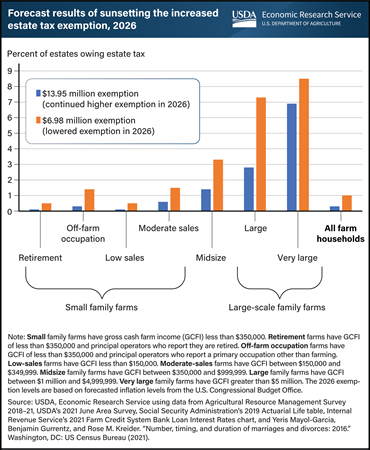
The 2017 Tax Cuts and Jobs Act (TCJA) made significant changes to Federal individual income and estate tax policies, though some policies were temporary. In 2018, the TCJA increased the estate tax exemption amount from $5.49 million to $11.18 million. This increase is set to expire at the end of 2025. The exclusion amount will revert in 2026 to the pre-TCJA level, adjusted for inflation, of $6.98 million per deceased person. For married couples, a portability provision in estate tax law allows the surviving spouse to use any unused portion of the deceased spouse’s exemption. Researchers with the USDA, Economic Research Service (ERS) estimated the expiring increased exemption would be $13.95 million per person at the time of the expiration. Lowering the level of the estate tax exemption in 2026 is estimated to increase the percent of farm operator estates taxed from 0.3 to 1.0. This means that of the estimated 40,883 estates that are expected to be created in 2026, the expiration of the increased exemption would raise the number of estates that owe tax from 120 to 424. Large farms (gross cash farm income between $1 million and $5 million) would experience the largest increase in the share of estates owing estate tax, increasing from 2.8 to 7.3 percent. Total Federal estate taxes for farm estates would be expected to more than double to $1.2 billion if the provision were allowed to expire. The information in this chart appears in the ERS publication An Analysis of the Effect of Sunsetting Tax Provisions for Family Farm Households published in February 2024.
Monday, March 4, 2024
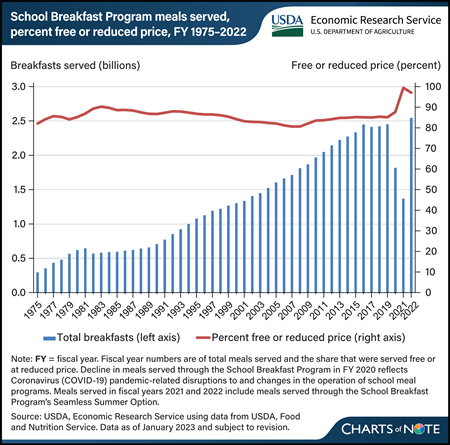
The USDA’s School Breakfast Program (SBP) has served about 63 billion meals since it was permanently authorized as a Child Nutrition Program in 1975. Any student in a participating school can get breakfast through the program. Students can receive a free breakfast if their household’s income is at or below 130 percent of the Federal poverty line (FPL), a reduced-price breakfast if their household’s income is between 130 and 185 percent of the FPL, and a full-price breakfast if their household’s income is above 185 percent of the FPL. The number of breakfasts served increased each year from 1982 through fiscal year (FY) 2016, before plateauing at about 2.4 billion meals from FY 2017 through FY 2019. On average, 85 percent of breakfasts were served for free or at a reduced price each year during this period. The onset of the Coronavirus (COVID-19) pandemic in March 2020 interrupted school operations, including the provision of meals, and the number of breakfasts served through the SBP dropped to about 1.8 billion breakfasts in FY 2020. The decrease reflected the use of USDA pandemic waivers, which allowed schools to serve meals through the Summer Food Service Program. From the end of FY 2021 through FY 2022, schools transitioned to serving meals through the SBP’s Seamless Summer Option. In FY 2022, the SBP provided 2.5 billion breakfasts, similar to prepandemic years. The data for this chart are from the USDA, Economic Research Service’s School Breakfast Program topic page.
Thursday, February 29, 2024
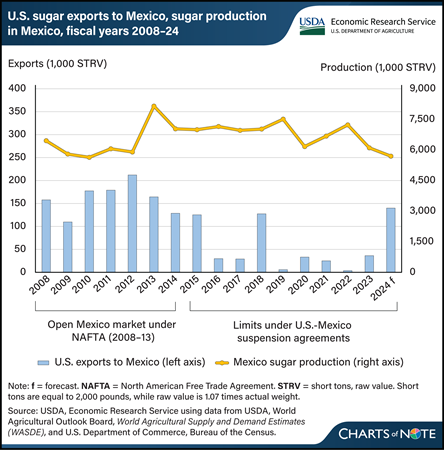
U.S. sugar exports for fiscal year 2024 are forecast to be the largest in 6 years, rising to an estimated 160,000 short tons, raw value (STRV) in the February 2024 World Agricultural Supply and Demand Estimates (WASDE) report. About 88 percent of that volume is expected to go to Mexico, where sugar production has fallen to a 15-year low. This would put U.S. sugar exports to Mexico on par with those during 2008–13, when the North American Free Trade Agreement (NAFTA) was active. Under NAFTA, Mexico could import U.S. sugar without tariffs or quotas, and U.S. exports averaged 167,000 STRV while the trade agreement was in effect. At the time, most of the sugar was imported by Mexico-based manufacturers participating in a promotion program commonly known as IMMEX. The program provided tax incentives if the companies used imported U.S. sugar in food products that would be re-exported within a certain amount of time. In 2014, in response to U.S. investigations into subsidies affecting sugar imports from Mexico, the two countries reached agreements that suspended the investigations and restricted the price and quantity of Mexico’s sugar exports to the United States. Mexico then declared that sugar imported from the United States would no longer qualify for duty-free treatment under IMMEX if that sugar was the beneficiary of the U.S. version of a re-export program. After that, U.S. sugar exports to Mexico fell to below 50,000 STRV, on average, each fiscal year. In the last 2 years, however, the United States increased its sugar exports to Mexico as U.S. domestic beet and cane sugar production rose and Mexico experienced back-to-back years of low production related to drought and reduced fertilizer use. This chart is based on information in the USDA, Economic Research Service’s Sugar and Sweeteners Outlook: February 2024.
Wednesday, February 28, 2024
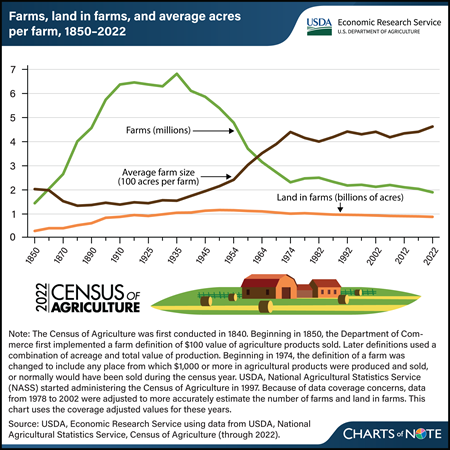
The number of farms in the United States has fallen below 2 million for the first time since before the Civil War, according to the recently released 2022 Census of Agriculture. In 2022, there were 1,900,487 farms in the country, a 7-percent decline from the level reported in the 2017 Census. A farm is defined as an establishment that produced and sold, or would have sold in normal conditions, at least $1,000 in agricultural production in a year. The Census of Agriculture, conducted every 5 years by USDA, National Agricultural Statistics Service (NASS), includes producer responses to questions about their farming operations. The latest Census also reported that the total U.S. land in farms declined 2.2 percent to 880 million acres in 2022. This decline, when combined with the higher proportional decline in the number of farms, meant that the average farm size increased by 5 percent to 463 acres per farm. For more details from the 2022 Census of Agriculture, see the NASS Census of Agriculture website. For more information on farm structure and its relationship with agriculture, as well as other statistics on the financial performance of farms and ranches, see USDA, Economic Research Service’s recent report America’s Farms and Ranches at a Glance: 2023 Edition, published in December 2023, which draws on data from the NASS Agricultural Resources Management Survey of farm operations in 2022.
Tuesday, February 27, 2024
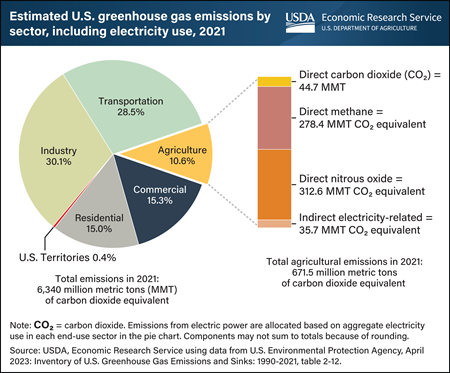
Farming activities in the United States accounted for 10.6 percent of U.S. greenhouse gas emissions in 2021. From 2020 to 2021, agricultural greenhouse gas emissions remained nearly constant but decreased from 11.1 percent to 10.6 percent as a share of total U.S. emissions because of changes in other industries. The U.S. Environmental Protection Agency estimated that in 2021, agriculture emitted 312.6 MMT as nitrous oxide (N2O), 278.4 MMT as methane (CH4), 44.7 MMT as on-farm carbon dioxide (CO2), and 35.7 MMT emitted indirectly through the electricity that the agricultural sector uses. Emissions include activities that emit nitrous oxide, such as fertilizer application and manure storage and management, and methane from enteric fermentation (a normal digestive process in animals). Of the common economic sectors in the United States defined by the Energy Information Administration, industry accounted for the largest portion of total greenhouse gas emissions (30.1 percent), followed by transportation, commercial, residential, agriculture, and U.S. territories (no specific consumption data can be attributed within the territories, so they are listed as a group). Total U.S. greenhouse gas emissions in 2021 were 2.3 percent lower than they were in 1990. This chart appears in the USDA, Economic Research Service topic page Climate Change.
Monday, February 26, 2024
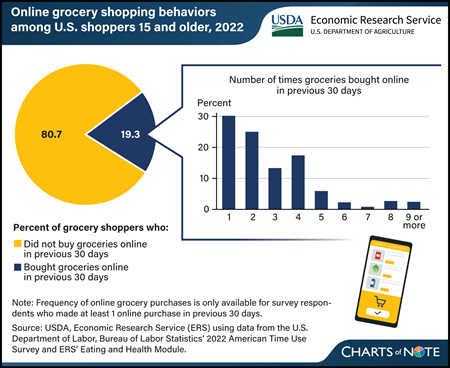
Recent nationally representative survey data from 2022 revealed that nearly 2 in 10 (19.3 percent) U.S. residents who regularly shopped for groceries did so online at least once in the last 30 days. However, the frequency of online shopping varied. At the time of the survey, among those who bought groceries online in the past month in 2022, 30.2 percent did so once, 25.1 percent made 2 online grocery purchases, and 44.7 percent purchased groceries online 3 or more times. Time constraints were the main reason people bought groceries online, while the main reason for not shopping online for groceries was that people like being able to see and touch products in person, according to the survey. USDA, Economic Research Service (ERS) has collected data through the ERS-developed Eating and Health Module of the U.S. Department of Labor Bureau of Labor Statistics’ American Time Use Survey (ATUS) in 2006–2008, 2014–2016, and 2022–2023. In 2022, the Eating and Health Module captured for the first time nationally representative data concerning the prevalence and frequency of U.S. residents who report shopping for groceries online. This chart appears in the Amber Waves article New Survey Data Show Online Grocery Shopping Prevalence and Frequency in the United States, published in February 2024.
Thursday, February 22, 2024
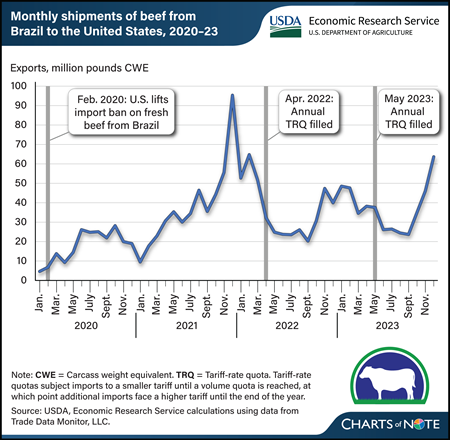
Brazil’s beef exports to the United States have grown rapidly since the easing of U.S. restrictions on imports of fresh beef from Brazil in 2020. In addition, Brazil’s beef exports have shifted in seasonality toward a trend of late-year shipments caused by a tariff-rate quota that resets on January 1 of each year. With tariff-rate quotas, imports are first subject to a smaller tariff, then once a specific volume of imports is met, any additional imports are subject to a higher tariff. U.S.-bound beef exports from Brazil first surged in late 2021. After trailing off in 2022, exports to the United States surged again later that year then once again in late 2023. Brazil starts shipping product to the United States late in the year to arrive when the quota reopens on January 1. Once the quota is filled, the higher beef tariff reduces Brazil’s competitiveness in the U.S. beef market, causing exports to slow. Total U.S. imports, a measure of the shipments once they reach U.S. soil, were once strongest during the second or third quarter. However, large amounts of beef from Brazil now arrive in January, resulting in expectations for higher imports in the first quarter. The quarterly forecast for U.S. beef imports in 2024 reflects this new seasonality. As of February 12, the 2024 quota was already more than 85 percent filled, according to the U.S. Customs and Border Protection Commodity Status Report. This chart is drawn from the USDA, Economic Research Service’s February 2024 Livestock, Dairy, and Poultry Outlook.
Wednesday, February 21, 2024
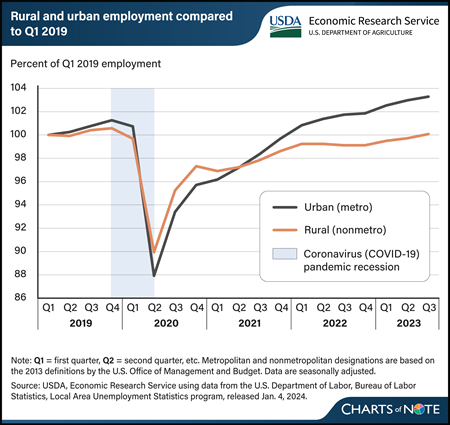
The Coronavirus (COVID-19) pandemic affected employment in rural and urban areas differently. Before the pandemic, employment growth was higher and unemployment rates were slightly lower in urban areas. However, these trends reversed during the pandemic. In the second quarter of 2020, urban employment fell to 88 percent of prepandemic (Q1 2019) employment levels, while rural employment fell to 90 percent of prepandemic levels. Unemployment during the pandemic reached a high of 13.3 percent in urban areas and 11.4 percent in rural areas, compared with prepandemic rates of 3.8 and 4.2 percent, respectively. Rural and urban employment grew quickly in the third and fourth quarters of 2020 as many sectors of the economy reopened. Employment growth slowed in 2021, but more in rural areas than in urban. Urban employment recovered to prepandemic levels by the first quarter of 2022, and the urban unemployment rate dropped below the rural rate once again in the second quarter of 2022. Meanwhile, the slow employment growth rate in rural areas in 2022 (0.5 percent) was similar to rates in the years between the Great Recession of 2008 and the COVID-19 pandemic. From 2010 to 2019, the annual average employment growth rate in rural areas was 0.4 percent compared with 1.6 percent in urban areas. Rural employment recovered to prepandemic levels in the third quarter of 2023, more than one year after urban employment did. Rural unemployment rates in 2023 were at their lowest point (3.6 percent) since before 1990. This figure updates data in the USDA, Economic Research Service report Rural America at a Glance, published in November 2023.
Tuesday, February 20, 2024
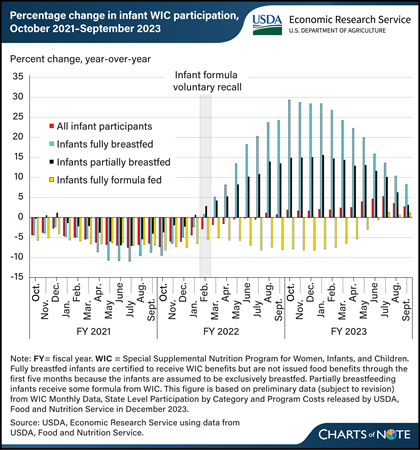
The number of breastfed infants in USDA’s Special Supplemental Nutrition Program for Women, Infants, and Children (WIC) began to increase around the start of infant formula supply chain disruptions in 2022. In February 2022, a voluntary recall of some powder infant formulas and a temporary closure of a formula manufacturing facility compounded Coronavirus (COVID-19) pandemic-related supply chain issues that limited the supply of infant formula. National monthly WIC participation data provide insights into how caregivers of WIC-participating infants responded to these challenges. In March 2022, the number of fully formula feeding infants decreased 5 percent, while the number of partially breastfed infants increased 4 percent and the number of fully breastfed infants increased 5 percent compared with the same month in the previous year. By October 2022, the number of fully formula feeding infants had decreased 8 percent, while the number of partially breastfed infants increased 15 percent and the number of fully breastfed infants increased 29 percent from one year before. The increases in the numbers of breastfed infants continued in fiscal year 2023, remaining above previous year numbers through September. This chart is drawn from the USDA, Economic Research Service report The Special Supplemental Nutrition Program for Women, Infants, and Children: Background, Trends, and Economic Issues, 2024 Edition, published in February 2024.
Thursday, February 15, 2024
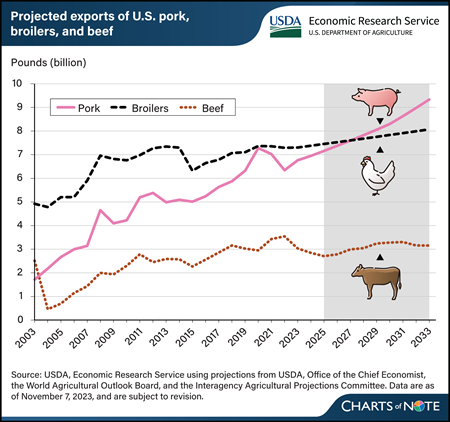
The volume of U.S. meat exports in major categories is projected to grow through 2033, according to USDA long-term projection data. Rising incomes abroad and a moderately declining real exchange rate of the U.S. dollar against the currencies of major agricultural trade partners lend support to U.S. red meat and poultry exports. Notably, by 2028, pork exports are set to exceed exports of broiler chickens for the first time since 1976. Steady growth in U.S. pork production, driven by a combination of increasing slaughter weights, rising pigs per litter, and higher inventories, is projected to support rapid growth in exports. New environmental policies in the European Union (EU) are expected to impact regional pork production and reduce growth of EU’s exports, enhancing U.S. competitiveness. U.S. pork exports are projected to increase 34 percent from an expected 6.95 billion pounds in 2024 to a projected 9.34 billion pounds by 2033. By 2026, U.S. pork exports are expected to surpass the previous record of 7.28 billion pounds set in 2020, when import demand in China spiked at the height of China’s African swine fever epidemic. This chart appears in the USDA, Economic Research Service Amber Waves article, U.S. Pork Export Volumes Projected to Surpass Chicken in the Next Decade, February 2024.


