
The top 5 U.S. agricultural trading partners accounted for 61 percent of U.S. agricultural exports in 2024
- by James Kaufman
- 4/1/2025
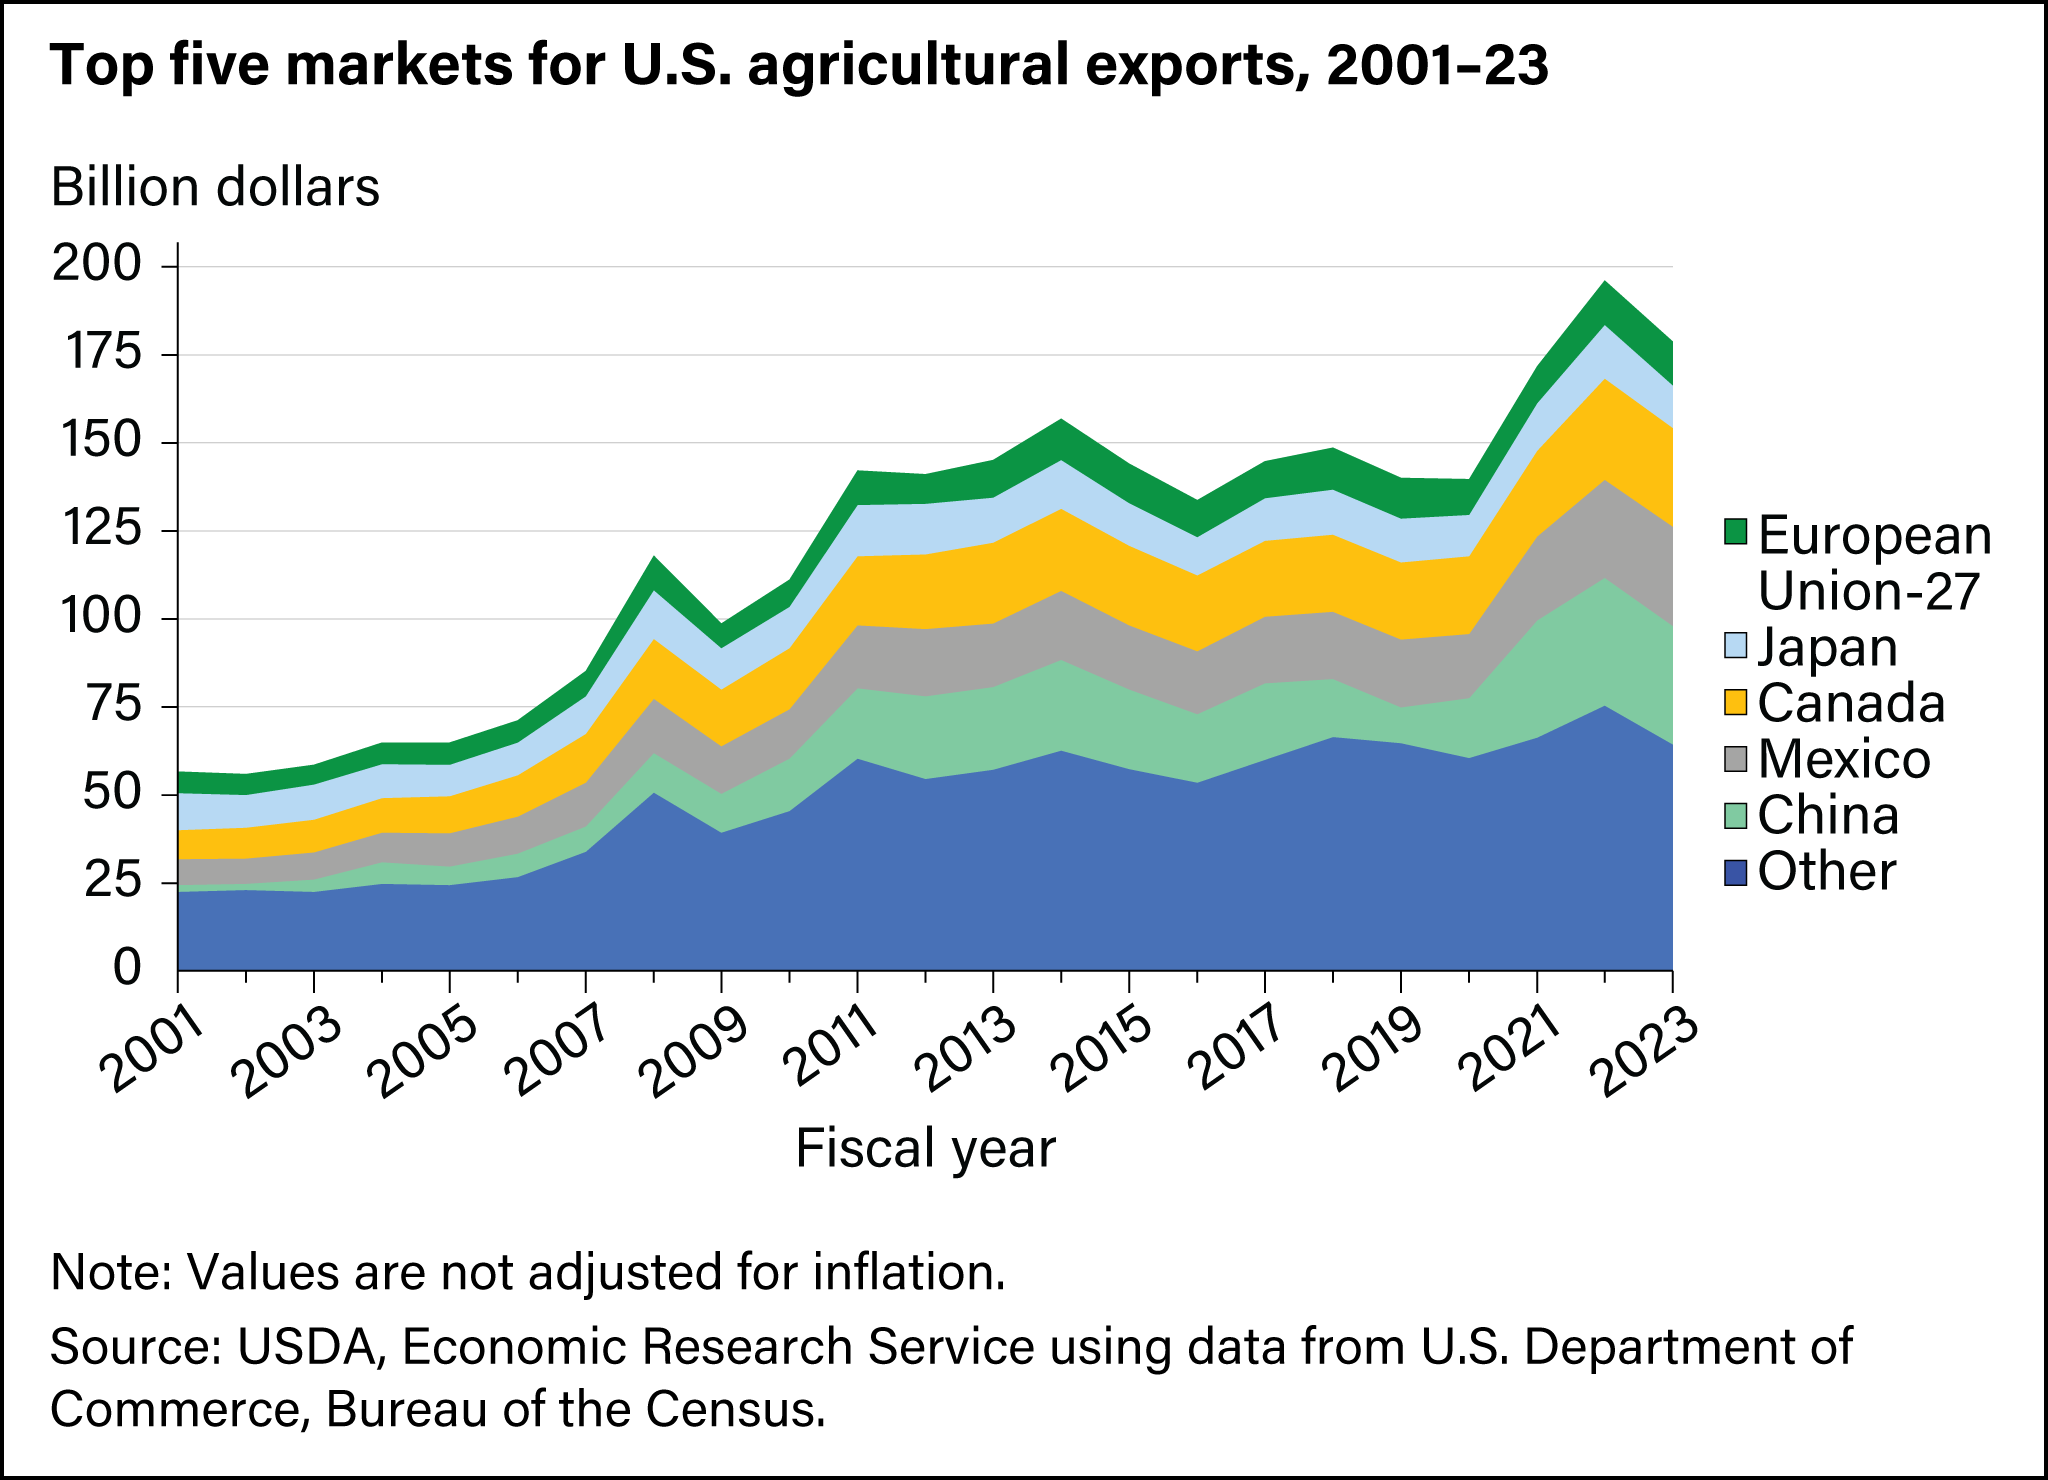
The top 5 U.S. markets accounted for 61 percent of the total value of U.S. agricultural exports in 2024. Mexico surpassed China and Canada in 2024 to become the top market at a record $30.3 billion, a 7-percent increase from 2023. Top U.S. agricultural exports to Mexico included corn, pork, dairy, soybeans, poultry, and beef. Exports to Canada, the second largest export market, were $28.4 billion. Top U.S. agricultural exports included bakery goods, fresh vegetables and fruits, ethanol, non-alcoholic beverages, and food preparations. China fell to third place with U.S. exports valued at $24.7 billion, down 15 percent from 2023, as soybean and corn sales fell amid rising competition from South America. U.S. agricultural exports to the European Union reached a record $12.8 billion in 2024, a 1-percent increase from 2023, led by strong tree nut and record distilled spirit sales.